Figure
1.
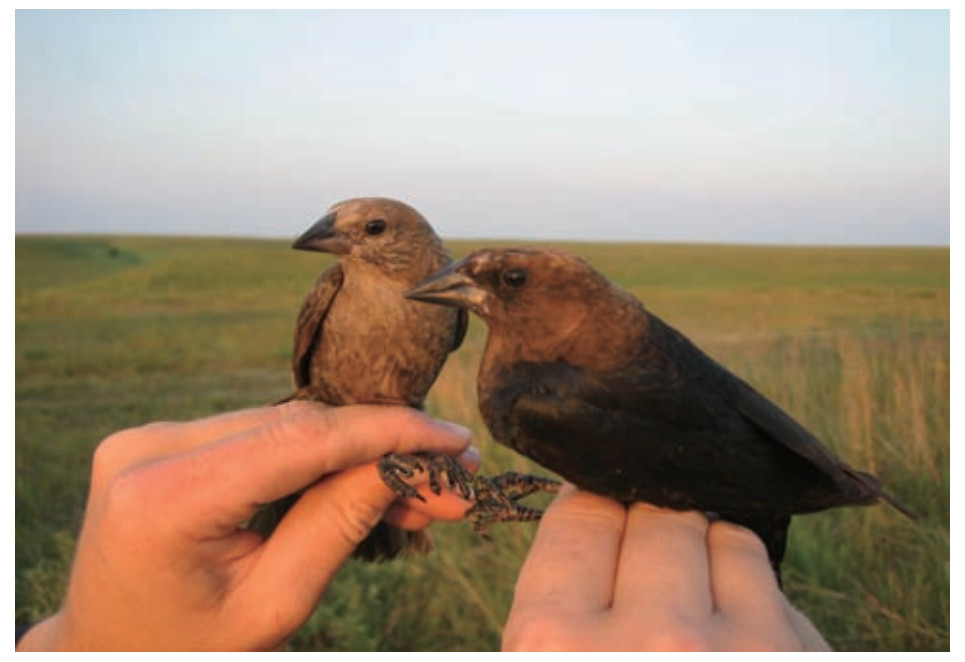
A female (left) and male (right) Brown-headed
Cowbird (photo by J. Rivers)
| Citation: |
Brian D. PEER, James W. RIVERS, Stephen I. ROTHSTEIN. 2013: The Brown-headed Cowbird: North America's avian brood parasite. Avian Research, 4(1): 93-98. DOI: 10.5122/cbirds.2013.0006

|
There are five species of parasitic cowbirds (Molothrus) and the Brown-headed Cowbird (M. ater) is the only widespread species in North America. The Brown-headed Cowbird is a host generalist and is typically found in open habitats and forest edges. The cowbirds are of a more recent origin than many other brood parasites and perhaps as a result, cowbird adaptations for parasitism and their hosts' counter-adaptations to thwart parasitism do not appear as sophisticated as those of other brood parasite-host systems. Because of its generalist nature, the cowbird has the potential to negatively impact endangered host species whose populations are limited due to anthropogenic habitat loss. As a consequence, the Brown-headed Cowbird is one of the few brood parasitic species that is the subject of control programs to limit its effects on such hosts.
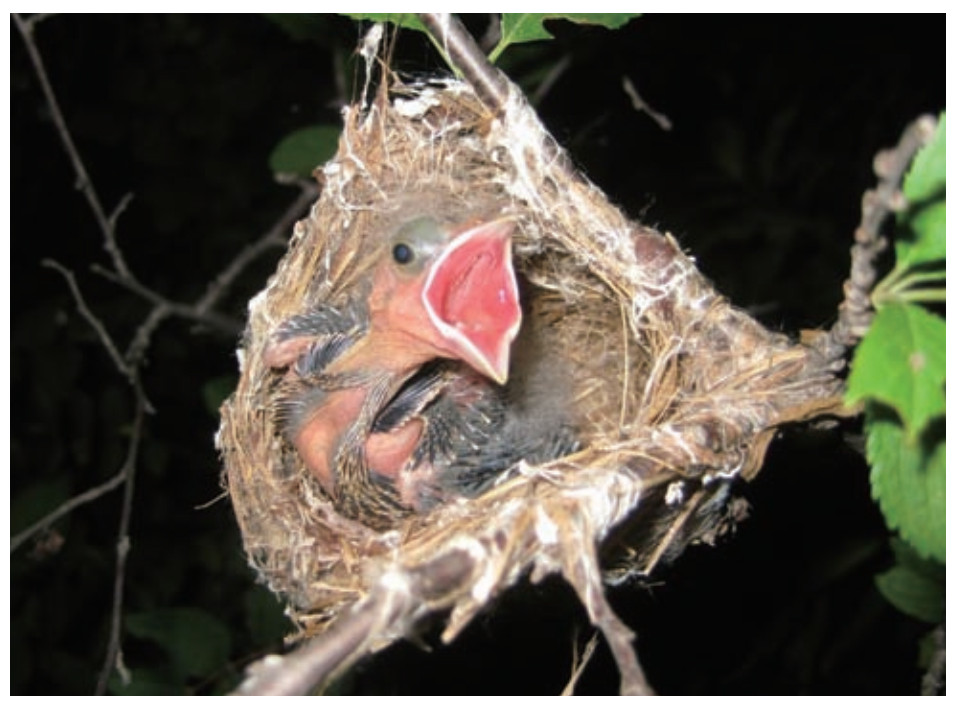
The Brown-headed Cowbird (Molothrus ater; Figs. 1 and 2) is the only widespread brood parasite in the United States and Canada. The Bronzed Cowbird (M. aeneus) is restricted to the southern United States (Peer and Sealy, 1999a; Ellison and Lowther, 2009) and the Shiny Cowbird (M. bonariensis) is found in limited numbers in the southeastern United States (Reetz et al., 2010; Post and Sykes, 2011). It was believed that the Shiny Cowbird would rapidly invade and spread into the southeastern states (Cruz et al., 1998; 2000), but their range expansion has stalled for reasons that are unclear. The Bronzed and Shiny Cowbirds are found primarily in the Neotropics and this region also has the remaining two species in the parasitic cowbird clade, the Giant (M. oryzivorus) and Screaming (M. rufoaxillaris) Cowbirds. The latter is one of the most special-ized brood parasites in the world, primarily parasitizing a single species and on occasion four other species (DiGiacomo et al., 2010). In contrast, the Shiny Cowbird (266 hosts), followed closely by the Brown-headed Cowbird (247 hosts; Lowther, 2012), has the largest number of known host species of any brood parasite.
Cowbirds are considered grassland and edge species, but they also search for host nests in forested habitats. Brown-headed Cowbirds (hereafter cowbirds) commute large distances (7–15 km) on a daily basis between breeding and foraging locations (Dufty, 1982; Rothstein et al., 1984; Thompson, 1994; Curson et al., 2000). Their foraging habitat includes grasslands and pastures where they feed on seeds and invertebrates (Ortega, 1998), and they show a distinct preference for foraging in association with livestock which flush insects in these areas (Ortega, 1998). Historically, cowbirds followed and foraged in association with bison (Bison bison) herds (Mayfield, 1965). Their preference of open habitats has also impacted the evolution of host defenses, because all hosts known to eject cowbird eggs mostly nest in grasslands or open areas along edges apparently due to the fact these hosts have had the longest period of time to evolve defenses (Peer and Sealy, 2004).
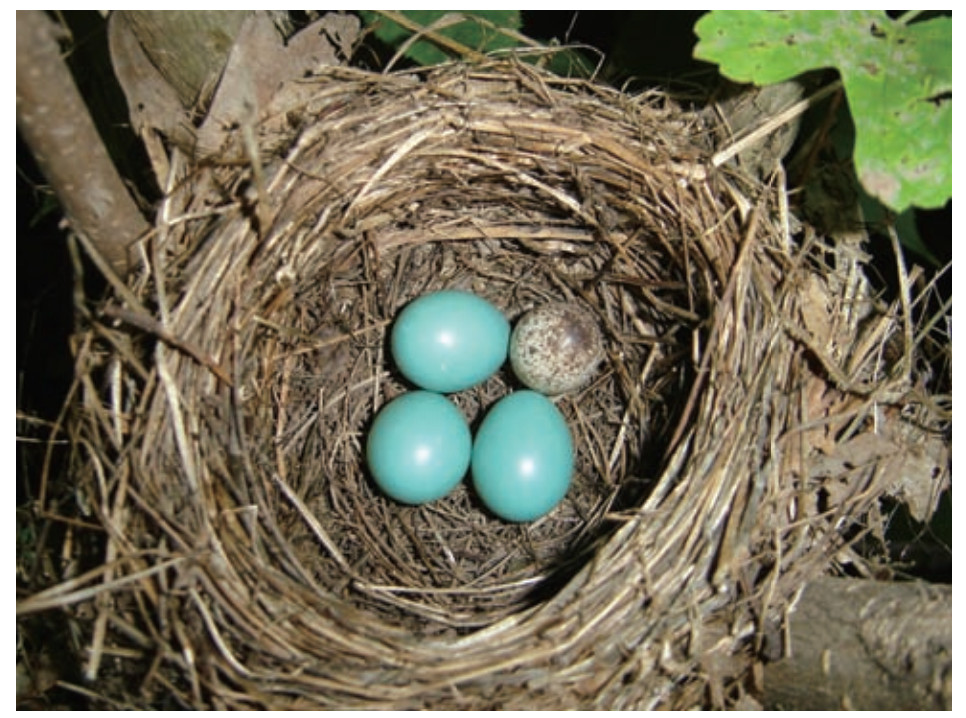
The cowbird is a host generalist and usually parasitizes open-cup nesting species and avoids those that nest in cavities (Ortega, 1998; but see Peer et al., 2006; Hoover and Robinson, 2007). Cowbirds use hosts that feed their young insects (Ortega, 1998), but they also parasitize those with diets of seed and fruit despite the fact their young do not survive on such diets (Rothstein, 1976; Middleton, 1991; Kozlovic et al., 1996). Parasitism frequencies vary regionally, within hosts, and seasonally. For example in the fragmented forests of Illinois, parasitism frequencies are often 100% (Robinson, 1992; Fig. 3). Birds nesting at forest edges and in shrublands are parasitized at intermediate frequencies and those nesting in grasslands in the same region are rarely parasitized (Peer et al., 2000). In contrast, in the center of the cowbird's historic range in Kansas where the landscape consists almost wholly of grasslands, grassland species are parasitized at high frequencies (Elliott, 1978; Rivers et al., 2010). Parasitism of some host species, notably the Red-winged Blackbird (Agelaius phoeniceus) and Dickcissel (Spiza americana), also vary geographically (Linz and Bolin, 1982; Jensen and Cully, 1995; Searcy and Yasukawa, 1995) possibly due to alternative host choices within given avian communities (e.g., Barber and Martin, 1997).
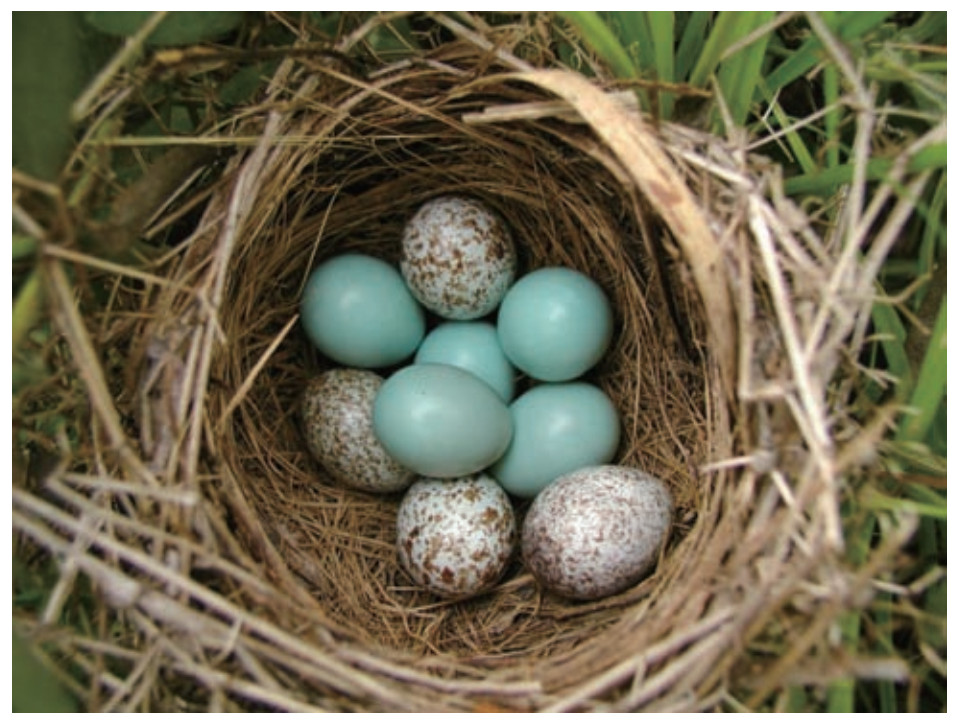
Individual female cowbirds sometimes specialize on a particular host species and in other cases use multiple hosts (Alderson et al., 1999; Strausberger and Ashley, 2005), and host usage by individual female cowbirds is an area in need of further research. Estimates of the numbers of eggs laid by individual females in the wild range from 13 to more than 40 (Scott and Ankney, 1983; Fleischer et al., 1987; Alderson et al., 1999; see also Holford and Roby, 1993), but there is some consensus that cowbirds lay eggs on about 70–80% of the days during their breeding season (Fleischer et al., 1987). Multiple parasitism is relatively common in cowbirds (Robinson, 1992; Rivers et al., 2010; Fig. 4) and can result from multiple females parasitizing a nest or indi-vidual females laying multiple eggs within a single nest (Alderson et al., 1999; McLaren et al., 2003; Rivers et al., 2012).
In comparison to other brood parasite-host systems, cowbirds and their hosts have interacted for a relatively short time; the Molothrus clade is only 2.8–3.8 million years old (Rothstein et al., 2002). Perhaps as a result, the Brown-headed Cowbird lacks some adaptations possessed by other brood parasites (Mermoz and Ornelas, 2004) including mimicry of host eggs (Rothstein and Robinson, 1998; but see Peer et al. 2002), or evidence of specialized nestling adaptations such as directly killing nestmates (Lichtenstein and Sealy, 1998; Peer et al., 2013). Among the adaptations possessed by cowbird are that females have a larger hippocampus to remember where host nests are located (Sherry et al., 2003); laying eggs rapidly and before sunrise to avoid detection by hosts (Scott, 1991; Sealy et al., 1995; see also Peer and Sealy, 1999b); thick eggshells presumably to withstand puncture-ejection by hosts (Picman, 1989); greater pore diameter in their eggshells for increased embryonic respiration and shorter incubation periods (Jaeckle et al., 2012; see also Briskie and Sealy, 1990); removal of host eggs by females in conjunction with parasitism to enhance incubation efficiency (Peer and Bollinger, 1997; 2000) and for nutrition (Sealy, 1992); egg puncture and killing nestlings to force hosts to renest providing additional chances for parasitism (Arcese et al., 1996; Elliott, 1999; Hoover and Robinson, 2007; Dubina and Peer, 2013); and possibly forcing hosts to accept parasitism through mafia enforcement tactics (Hoover and Robinson, 2007).
Likewise, host defenses against cowbird parasitism appear to be relatively unsophisticated. For example, many hosts aggressively defend their nests against cowbirds, but the success of this strategy in preventing parasitism is limited (Sealy et al., 1998). Only approximately 10% of hosts reject cowbird eggs (Peer and Sealy, 2004; Fig. 5) and there is a bimodal response in that most hosts either accept or reject 100% of the time (Rothstein, 1975; Peer and Sealy, 2004), although more intermediate rejecters have been recently discovered (Peer et al., 2000, 2002, 2006). Smaller hosts are more likely to desert parasitized nests likely due to bill-size constraints that prevent egg ejection or simply because nest desertion evolves more easily than egg ejection (Hosoi and Rothstein, 2000). One host, the Yellow Warbler (Dendroica petchia), is unique because it often buries cowbird eggs in a new nest lining (Sealy, 1995) and it also has a specific referential call for cowbirds (Gill and Sealy, 2004). The lack of adaptive response to parasitism in newly parasitized hosts and some others appears to be due to an evolutionary lag (Rothstein, 1975; Peer and Sealy, 2004). Hosts with small bills that have difficulty in removing the cowbird egg or those with eggs that resemble cowbird eggs and may mistake them for their own may be in an evolutionary equilibrium (e.g., Rohwer and Spaw, 1988), but there is no compelling evidence of equilibrium among cowbird hosts to date (Peer and Sealy, 2004).
The Brown-headed Cowbird, and to a lesser extent the Shiny Cowbird, is unique among brood parasites because there are control programs designed to aid endangered species by culling cowbirds. To some extent, these control measures have been implemented based on misconceptions concerning impacts cowbirds have at the level of host populations and on incorrectly assuming that cowbirds rather than anthropogenic habitat destruction are limiting host populations (Rothstein and Peer, 2005). Unfortunately, there is no indication that control measures will cease despite some host populations having surpassed mandated minimum population goals and the expenditure of scarce management funds that could be put to better use (Hammer, 2011, unpubl. report). The management debate is exacerbated by the negative attitudes directed towards cowbirds by both birdwatchers and scientists (Ortega, 1998; see Peer et al., 2013, pers. observ.) that is not as apparent in other brood parasites. For example, an article in a North American journal solicited cowbird recipes (Schram, 1994)! In contrast, there is concern in Europe over the decline of the Common Cuckoo (Douglas et al., 2010). Birdwatchers and even some ornithologists in North America would likely rejoice if such declines occurred in the cowbird. This unfortunate attitude and scapegoating of the cowbird are detrimental to the conservation of endangered songbird species because it diverts attention from more important factors such as the anthropogenic habitat degradation underlying the declines of these species.
Figures(5)


 DownLoad:
 Email Alerts
 RSS Feeds