The Hooded Crane (Grus monacha) is a waterbird wintering in the wetlands of the middle and lower reaches of the Yangtze River, China. The gradual habitat loss resulting from wetland degradation may have posed negative effects on the structure of our wintering populations. For its effective protection, it is important to conduct an intensive study on the genetic structure of this population. A total of 221 faecal samples, nine feather samples and four muscle samples of Hooded Cranes from four wintering populations, i.e., from Caizi Lake and Shengjin Lake in Anhui, Poyang Lake in Jiangxi and Chongming Dongtan in Shanghai, were collected for this study. Full-length 1103-1104 bp mtDNA D-loop sequences from 72 samples were amplified using PCR. Based on our amplified D-loop sequences and the sequences of two individual birds obtained from GenBank (AB017625 and AB023813), we analyzed the genetic structure of these four wintering Hooded Crane populations. Twenty six variable sites were found among 72 target sequences in the four wintering populations and 23 haplotypes were defined. Genetic diversity analyses showed that the haplotype diversity of Hooded Cranes was 0.823±0.042 with a nucleotide diversity of 0.00157±0.00021. The FST values of the four populations show that there is no significant genetic differentiation among the populations of Hooded Cranes wintering in the middle and lower reaches of the Yangtze River. Tajima's D and Fu's tests suggest that the Hooded Crane populations may have experienced population expansion in their evolutionary history.
Genetic diversity is the basis for evolutionary potential and environmental adaptability of species, hence recognizing the genetic background of a target species is extremely important (Frankham et al., 2002). The genetic structure of the population of a species depends on both historical events and current processes (Avise, 1994). A good understanding of the genetic structure of populations can support the design of an effective conservation program for a species (Zhang et al., 2010).
The Hooded Crane (Grus monacha) is a large migratory wading bird, designated as vulnerable in the IUCN Red List (IUCN, 2011), and as a First-class National Protected Wild Animal species in China. During the past two decades, due to habitat loss, hunting, pollution, pesticides and human activities, the population of the Hooded Crane has undergone a precipitous decline (BirdLife International, 2001).
The cranes winter in Japan, South Korea and China (BirdLife International, 2001). The lakes and coastal intertidal zones in the middle and lower reaches of the Yangtze River are major wintering areas for these birds.
Delany and Derek (2006) estimate that there are about 1000–1500 individuals of this species wintering in China. The main wintering sites are Shengjin Lake (about 300) (Xu et al., 2006) and Caizi Lake (276) (Zhang, 2006a) in Anhui, Poyang Lake (255) in Jiangxi (Ji and Zeng, 2006) and Chongming Dongtan in Shanghai (about 130) (Zhang, 2006b). However, more recently, due to human disturbances, lake wetlands have become seriously degraded and habitats for the wintering population are constantly losing (Wang and Yan, 2002). The status of the population has become of major concern. In order to improve conservation of wintering populations, it is necessary to have a more thorough knowledge about the status of both their habitat and genetic background.
In this study, using feces as sources of DNA samples, we analyzed the genetic diversity of Hooded Crane populations wintering in the major wetlands in the middle and lower reaches of the Yangtze River based on the mtDNA D-loop sequences. The objectives of this study were to understand the genetic diversity and structure of these populations and to accumulate basic data concerning the conservation genetics of the wintering populations.
Materials and method
Sample collection
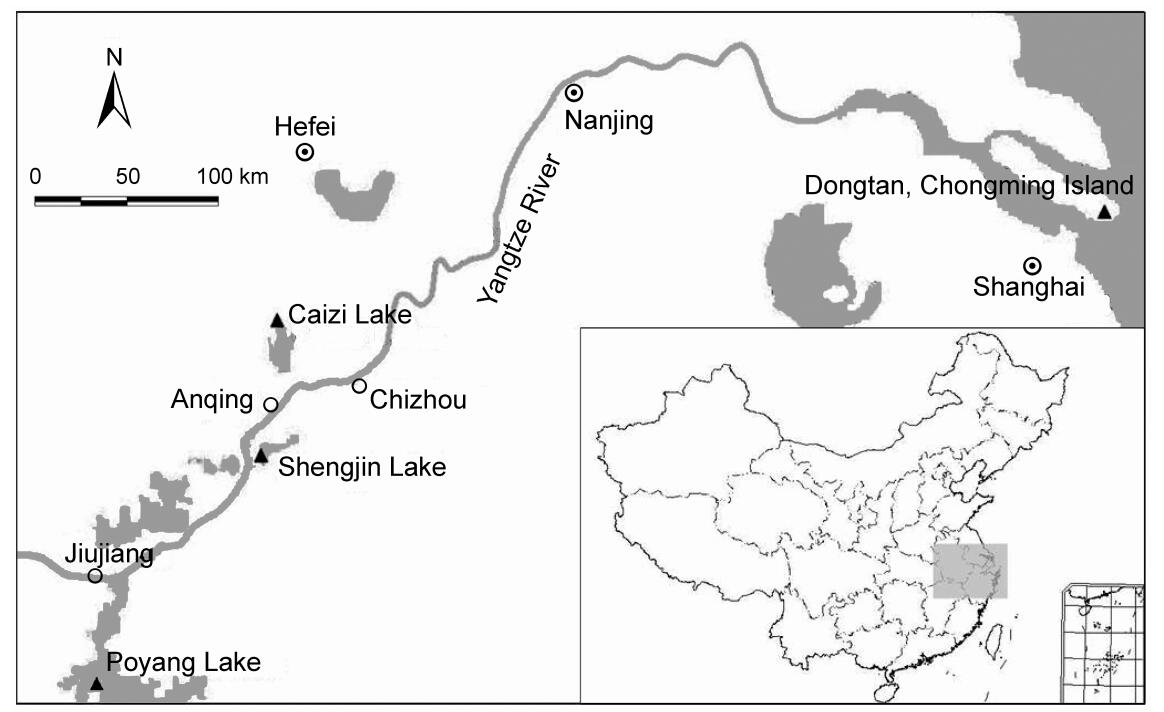
Samples were collected from four wintering Hooded Crane populations (Fig. 1). Before faecal samples were collected, the foraging areas and overnight roosts of the cranes were observed with binoculars or telescopes. The minimum distance among individual birds observed was about 1–2 m. Fresh faecal samples were collected immediately after the cranes flew away to their foraging ground or the next morning at the overnight roosts. In order to avoid that each sample came from the same bird, we collected samples at each sampling location only once, with a minimum distance between samples of at least 2 m. We used disposable PE gloves to collect samples, which were placed into 50 mL centrifuge tubes and then 2 to 3 times its volume of absolute ethyl ethanol was added to preserve the samples. A total of 221 faecal samples were collected, consisting of 84 samples from Shengjin Lake (SJ), 61 from Caizi Lake (CZ), 30 from Poyang Lake (PY) and 46 from Chongming Dongtan (DT).
Figure
1.
Study sampling sites of the Hooded Crane Triangles indicate the location of the four populations
In addition, nine down feather samples from wintering cranes in Shengjin Lake and four muscle samples from dead birds found in the Shengjin Lake National Nature Reserve during 2008–2011 were collected. The feather and muscle samples were placed at −20℃.
DNA extraction, PCR amplification and sequencing
DNA was extracted from faecal samples using the improved method of Guanidine Thiocyanate and Glass Milk (Reed et al., 1997; Dai and Zhou, 2011). After DNA was extracted, 70% ethanol was added to wash it 2–3 times. After air drying, 50 µL of ddH2O was added. DNA from each faecal sample was extracted repeatedly four times, after which the extracted DNA was pooled and purified (Zhao et al., 2005; Regnaut et al., 2006b). DNA extraction from feather and muscle samples was carried out using the conventional but improved Protease-Phenol/Chloroform method (Sambrook et al., 1989; Zan et al., 2008).
LC16004 (5′-GAG CCC TAG AAA ACA AAA TA-3′), LC16575 (5′-ACA AAA GAA ACC CCC AAA CTC A-3′) and HC01342 (5′-AAG AAT TCT GCG GAT ACT TGC ATG T-3′) were chosen as primers for the amplification of DNA D-loop sequences of mitochondria of Hooded Cranes (Hasegawa et al., 1999). The PCR mix (50 µL) comprised of 3−5 µL of an extract, 0.2 µM of each primer, 0.4 mg/mL of BSA and 1 × EasyTaq PCR SuperMix (Trans). Cycling parameters consisted of an initial denaturation at 94℃ for 3 min followed by 35 amplification cycles of 45 s at 94℃, 1 min at 58℃ and 1 min at 72℃ with a terminal cycle of 10 min at 72℃ (Hasegawa et al., 1999). The amplified products were detected with a gel imager after electrophoresis for 30 min at 120 V with 1.5% EB-agarose gel. Finally, a two-way sequencing was performed on the purified PCR products (Sangon Biotech (Shanghai) Co., Ltd.).
Data analysis
MtDNA D-loop sequences of two Hooded Cranes wintering in Japan were obtained from GenBank (AB017625 and AB023813). The SeqManII program from the DNASTAR software package (Burland, 2000) was used to match the coupled sequences of one sample and compared them with the sequences from GenBank in order to confirm the target sequences. A total of 72 mtDNA D-loop sequences were obtained for genetic analysis. The sequences were aligned using the Clustal W in MEGA4.0 software (Tamura et al., 2007); haplotypes were identified by DAMBE (Xia and Xie, 2001). We had submitted the data from these haplotypes to GenBank and received the accession numbers (JQ015266-JQ015288).
As the representatives of the Japanese wintering population (JA), the two sequences obtained from GenBank were analyzed. Haplotype (h) and nucleotide diversities (π) were calculated using Dnasp5.10 software (Rozas et al., 2003). Genetic differences between populations (FST) were obtained by analysis in Arlequin3.11 software (Excoffier et al., 2005), Tajima's D (Tajima, 1989) and Fu's FS (Fu, 1997) tests were performed by Dnasp5.10 (Rozas et al., 2003). The validity of the estimated demographic model was tested via Arlequin3.11 (Excoffier et al., 2005) from the distribution of a SSD test between the observed and an estimated mismatch distribution (Bootstrap test with 1000 replicates). We estimated the time since population expansion according to the relation t = τ/2μk, where τ is the relative measure of the time since population expansion, calculated from the data, μ the rate of mutation and k the length of the sequence (Rogers et al., 1992).
Phylogenetic analyses of different haplotypes were performed in MEGA4.0 (Tamura et al., 2007). Neighbor-joining (NJ) trees were constructed based on the Kimura 2-parameter Distance (Bootstrap test with 1000 replicates); simultaneously, we took G. grus homologous sequences as the outgroup (GenBank FJ769849). A haplotype network diagram was constructed using the Median-joining method by Network4.600 (www.fluxusengineering.com).
Results
Sequence characteristics and haplotype distribution
The full-length of 72 D-loop sequences of the four Hooded Crane wintering populations from the middle and lower reaches of the Yangtze River was restricted between 1103 and 1104 bp containing 26 variable sites (2.4%), consisting of eight parsimony-informative sites, 16 singleton sites, one deleted site and one inserted site. The base composition analysis of D-loop sequences of Hooded Cranes showed the following: the average contents of A, G, C and T bases were 30.48%, 14.77%, 25.55% and 29.20% respectively; the content of A + T (59.68%) was higher than that of G + C (40.32%).
A total of 23 haplotypes were defined (Table 1). Among these, H03 was the haplotype shared by all four populations wintering in China; H05 was shared by CZ, PY and DT, H06 by CZ, SJ and DT, H11 by CZ, SJ and PY, while H01, H02, H07 and H10 were shared by CZ and SJ. The remaining haplotypes were unique to each population, among which three haplotypes were from CZ, nine from SJ and three from DT.
Table
1.
Distribution of twenty-three haplotypes of the D-loop gene in four populations of the Hooded Crane
Haplotype diversities of the mitochondrial control region for the four wintering populations of the Hooded Crane in China ranged between 0.679–0.889 with the maximum occurring in the DT population (h = 0.889 ± 0.091) and the minimum in the PY population (h
= 0.679 ± 0.122). Although the haplotype diversities were relatively high, the nucleotide diversities were low (between 0.00071–0.00295) with the maximum occurring in the DT population (π = 0.00295 ± 0.00094) and the minimum in the PY population (π = 0.00071 ± 0.00018). The average haplotype diversity and nucleotide diversity for the four wintering populations was h
= 0.823 ± 0.042 and π = 0.00157 ± 0.00021 respectively (Table 2).
Table
2.
Sample size (n), haplotype diversity (h) and nucleotide diversity (π) in four populations of the Hooded Crane, with the results of Tajima's and Fu's neutrality tests.
Population differences (FST), based on the frequency of the haplotype distribution, showed that the genetic difference between the CZ and Japanese populations was the largest (0.60057) and that between the SJ and PY populations the lowest (−0.00261) (Table 3). On the whole, the values of FST among the four wintering populations in China were lower than those of the Japanese population.
Table
3.
Population differentiation (FST, below diagonal) among four populations of the Hooded Crane
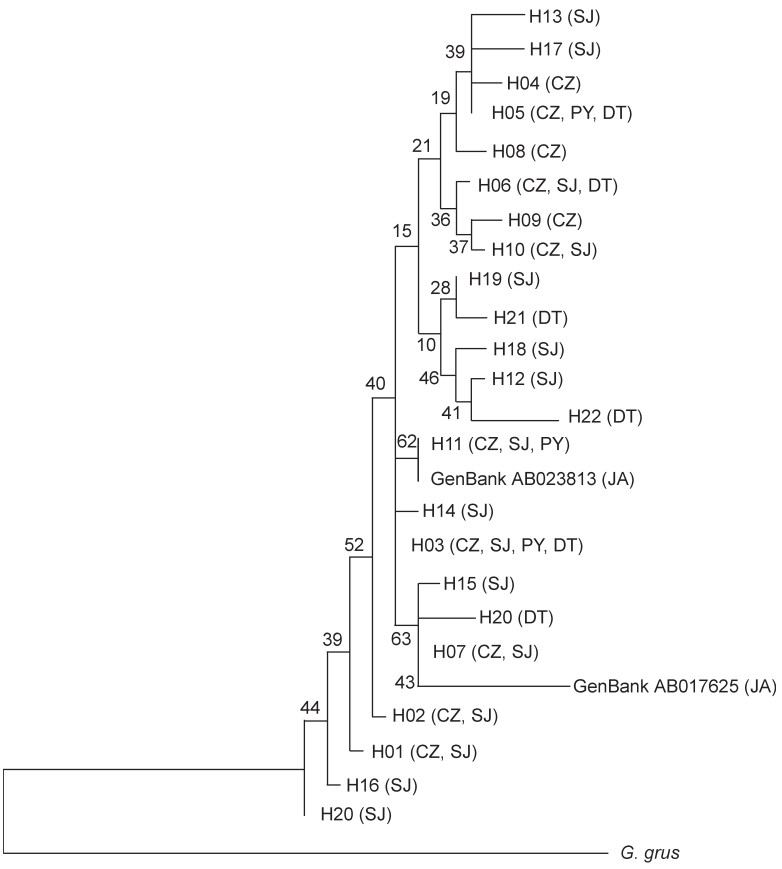
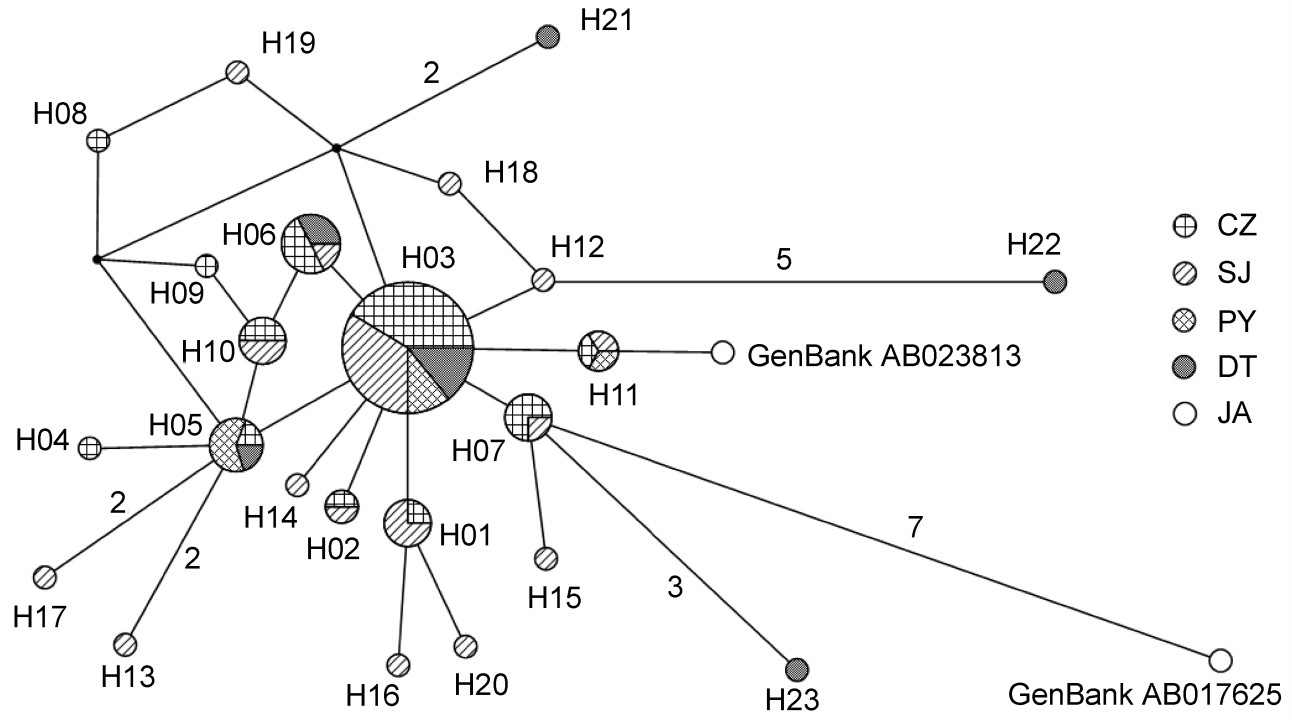
According to the NJ tree, its construction based on the Kimura 2-parameter Distance, the haplotypes of Hooded Cranes were mixed in the gene-tree without significant geographic differentiation (Fig. 2). The differentiation between haplotypes was small, with its result supported by network diagram analyses (Fig. 3). From the network construction of haplotypes, it can be observed that the haplotypes of the SJ population are more widely distributed; most of the mutations were one-step mutations, where the number of mutation steps between adjacent haplotypes H07 and H24 was the largest (7 steps).
Figure
2.
Phylogenetic tree of mtDNA D-loop haplotypes based on a Neighbor-joining method. Haplotype codes are the same as in Table 1; numbers at nodes indicate the bootstrap values from 1000 replications.
Figure
3.
Minimum spanning network of haplotypes based on a Median-joining method. The names of haplotypes are the same as in Table 1; the size of circles roughly represents the number of individual birds. Black spots represent interior nodes, which do not appear in the samples. The number on the lines represents mutational steps among different haplotypes; lines without a number imply a single mutation.
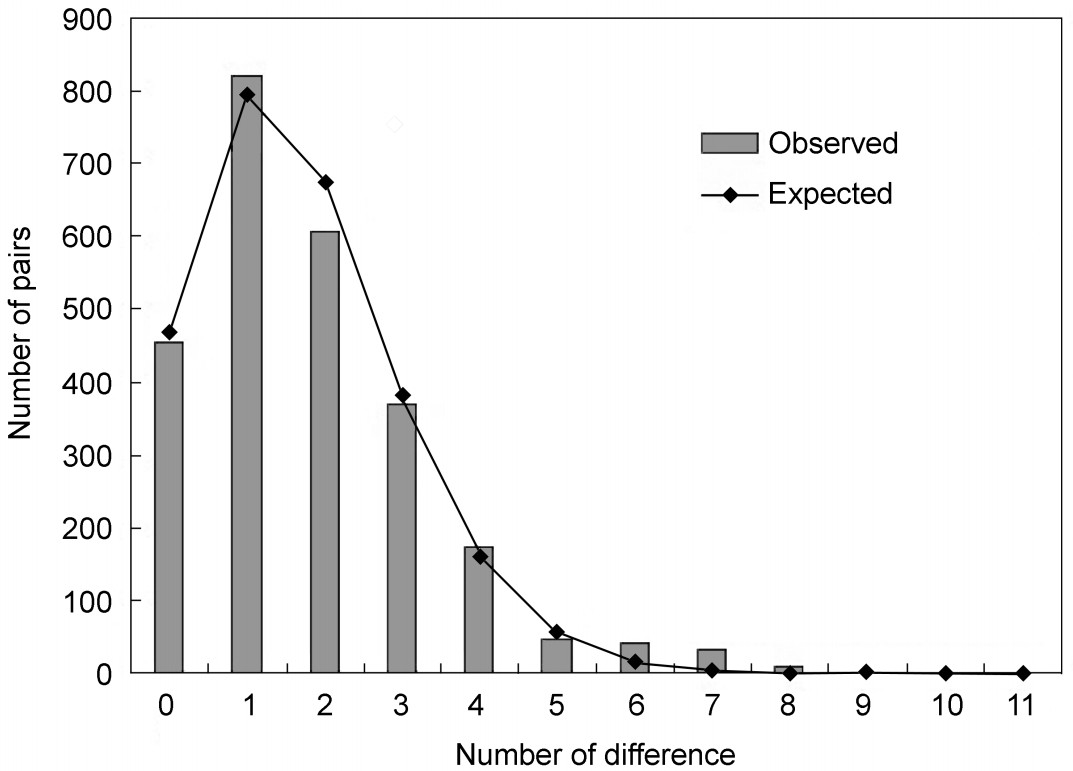
The mismatch distribution of the Chinese populations appeared to be a unimodal shape (Fig. 4). Tajima's D and Fu's FS were both significantly negative (D = −2.10951,
p < 0.05; FS = −19.351, p < 0.01) (Table 2), indicating that population expansion had occurred in the history of the Hooded Crane population. Demographic parameters estimated by mismatch analyses corresponded to a null model of population range expansion (τ > 0, θ1 > θ0) that could not be rejected (p-values of SSD and Harpending's Raggedness index were 0.604 and 0.530 respectively).
Figure
4.
Mismatch distribution of the four Chinese populations of the Hooded Crane. Bars in the histogram indicate observed frequencies, while the line indicates the expected distribution based on a model of sudden population expansion. The abscissa represents the number of differences and the ordinate represents number of pairs.
Nucleotide diversity (π) is an important indicator for measuring mtDNA genetic diversity of populations, because it takes into account the proportions of each mtDNA haplotype in populations (Nei, 1987). In our study, the nucleotide diversity (0.00157 ± 0.00021) was lower when compared to other cranes, such as G. japonensis (Hasegawa et al., 1999), G. leucogeranus (Ponomarev et al., 2004), G. canadensis (Rhymer et al., 2001) and G. americana (Glenn et al., 1999). It suggests that the genetic diversity of the Hooded Crane is relatively poor.
The results of the high haplotype diversity (0.823 ± 0.042) and low nucleotide diversity (0.00157 ± 0.00021) in the Hooded Crane populations suggest that it may be in a period of rapid increase in size starting from a small effective population. Furthermore, the mismatch distribution (Fig. 4) and neutrality tests (D= −2.10951,
p < 0.05; FS = −19.351, p < 0.01) show that the population experienced expansion. To our knowledge, no detailed molecular clock calibrates the Hooded Crane mtDNA D-loop sequence. Divergence rates for the Cyt b gene in cranes is 0.7%–1.7% per million years (Krajewski and King, 1996). The mutation rate of the D-loop gene is approximately 2.8–5 times faster than that of other gene segments (Avise et al., 1987), so we estimated that the time since the population started to expand was about 8900–38000 years ago (τ = 1.676). These events occurred during a relatively limited time period, enough to increase haplotype diversity, but insufficient to improve nucleotide diversity.
Genetic structure
In natural populations, genetic structures will change significantly by a decline in the size of a population as well as by habitat fragmentation. Furthermore, increased inbreeding and genetic drift will result in the loss of genetic heterogeneity and diversity (Li et al., 2000). In our study the FST values, obtained from multiple comparisons showing no significant genetic differences, were detected among the four wintering populations of the Hooded Crane in China (Tables 3). Their lack of phylogeographic structures (Fig. 2 and 3) indicate that close relations exist among these wintering populations. The reason may be that they originate from the same breeding ground, or that the strong flying ability of migratory birds is not subject to geographical isolation (Crochet, 2000). Some studies have proven that migratory birds have difficulty in forming population subdivisions, such as the Ciconia boyciana
(Zan et al., 2008), Locustella pryeri sinensis (Zhang et al., 2010), Branta bernicla hrota (Harrison et al., 2010),
Limosa limosa limosa (Trimbos et al., 2011) and several other migratory birds.
It must be noted that there are significant genetic differences between the Chinese and Japanese populations of the Hooded Crane (Table 3), suggesting that there may be some degree of genetic differentiation between them. However, due to the small number of birds in the Japanese population sample, it is necessary to increase the number of samples in order to increase our knowledge about the genetic differentiation of these cranes. Furthermore, due to this limited number of samples and the possibility of repeated faecal collection, the information obtained may be of limited value. It becomes therefore necessary to collect more samples and as well to use SSR for individual identification and analysis of genetic structures in any future study.
Implications for conservation
In this study, we have come to the realization that the genetic diversity of this species is poor. In recent years, human activities have given rise to habitat loss, pollution and pesticides, which has resulted in a decline in the size of our Hooded Crane population (IUCN, 2011). In general, the main reason for loss of genetic diversity in a species is a small or declining population. Inbreeding and loss of genetic diversity are inevitable in small populations of threatened species (Frankham et al., 2002). Over the short term, a poor genetic background would lower the fertility and survival rate of species; in the long run, loss of genetic diversity will diminish the capacity of populations to evolve in response to environmental change (Zan et al., 2008).
Hooded Cranes depend strongly on their habitat. Their habitat should be a key consideration for the development of conservation and management strategies, not only in wintering areas but also in breeding and migration areas. Expanding their habitat is useful for restoring population size, as well as improving the adequacy of individual birds to avoid inbreeding and genetic drift. Sufficient time should be allotted to accumulate effective nucleotide variation to improve the genetic diversity and evolutionary potential of this population.
Acknowledgements
Thanks to Wenbin Xu, Jian Zhang, Changsheng Yan and Haiyan Shu from the Anhui Shengjin Lake National N.R., to Chengdong Tang, Qiang Ma, Wei Wu and Weipin Chen from the Chongming East Beach National Bird N.R., to Yunyun Gao from the Jiangxi Poyang Lake National N.R. and to Zijun Luo and Lei Gong in our research group for their assistance in sample collection. This research was supported by the National Natural Science Foundation of China (Grant No. 31172117) and the Anhui Academic and Technical Leaders Fund.
Avise JC, Arnold J, Ball RM, Bermingham E, Lamb T, Niegel JE, Reeb CA, Saunders NC. 1987. Intraspecific phylogeography: the mitochondrial DNA bridge between population genetics and systematics. Ann Rev Ecol Syst, 18: 489–522.
Avise JC. 1994. Molecular Markers, Natural History and Evolution. Chapman and Hall, New York
BirdLife International, 2001. Threatened birds of Asia: the BirdLife International Red Data Book. BirdLife International, Cambridge, UK.
Broderick D, Idaghdour Y, Korrida A, Hellmich J. 2003. Gene flow in great bustard populations across the Strait of Gibraltar as elucidated from excremental PCR and mtDNA sequencing. Conserv Genet, 4: 793–800.
Dai YL, Zhou LZ. 2011. An improved method for DNA extraction from the feces of hooded crane Grus monacha. Chinese J Wildl, 32(4): 203–207. (in Chinese)
Delany S, Derek S. 2006. Waterfowl Population Estimates. 4th edition. Wetlands International, Global Series No. 12, Wageningen
Excoffier L, Laval G, Schneider S. 2005. Arlequin (version 3.0): An integrated software package for population genetics data analysis. Evol Bioinform Online, 1: 47–50.
Frankham R, Ballou J, Briscoe D. 2002. Introduction to Conservation Genetics. Cambridge University Press, Cambridge.
Fu YX. 1997. Statistical tests of neutrality of mutations against population growth, hitchhiking and background selection. Genetics, 147: 915–925.
Glenn TC, Stephan W, Braun MJ. 1999. Effects of a population bottleneck on whooping crane mitochondrial DNA variation. Conserv Biol, 13(5): 1097–1107.
Harrison XA. Tregenza T, Inger R. 2010. Cultural inheritance drives site fidelity and migratory connectivity in a long-distance migrant. Mol Ecol, 19: 5484–5496.
Hasegawa O, Takada S, Michihiro CY, Syuiti A. 1999. Variation of mitochondrial control region sequences in three crane species, the red-crowned crane Grus japonensis, the common crane G. grus and the hooded crane G. monacha. Zool Sci, 16: 685–692.
Honma H, Suyama Y, Nakai Y. 2011. Detection of parasitizing coccidia and determination of host crane species, sex and genotype by faecal DNA analysis. Mol Ecol Resour, 11(6): 1033–1044.
Idaghdour Y, Broderick D, Korrida A. 2003. Faeces as a source of DNA for molecular studies in a threatened population of great bustards. Conserv Genet, 4: 789–792.
Ishtiaq F, Dutta S, Yumnam B, Jhala YV. 2011. Low genetic diversity in the endangered great Indian bustard (Ardeotis nigriceps) across India and implications for conservation. Conserv Genet, 12: 857–863.
IUCN 2011. IUCN Red List of Threatened Species. Version 2011.1. . Accessed on 3 September 2011.
Jancob G, Debrunner R, Gugerli F, Schmid B, Schmid K. 2010. Field surveys of capercaillie (Tetrao urogallus) in the Swiss Alps underestimated local abundance of the species as revealed by genetic analyses of non-invasive samples. Conserv Genet, 11: 33–44.
Ji WT, Zeng NJ. 2006. Report on wintering waterfowls in Poyang Lake, 2005/2006. Chinese Crane News, 10(1): 8–9. (in Chinese)
Krajewski C, King DG. 1996. Molecular divergence and phylogeny: rates and patterns of Cytochrome b evolution in cranes. Mol Biol Evol, 13(1): 21–30.
Li M, Wei FW, Rao G, Fang SG, Feng ZJ. 2001. Application of noninvasive sampling in conservation genetics. Acta Zool Sin, 47(3): 338–342. (in Chinese)
Li M, Wei FW, Xie J, Fang SG, Zhang ZH, Feng ZJ. 2000. New branch of conservation biology: conservation genetics. Sichuan J Zool, 19(5): 16–19. (in Chinese)
Nei M. 1987. Molecular Evolutionary Genetics. Columbia University Press, New York
Ponomarev A, Tatarinova T, Bubyakina V, Smagulova F, Kashentseva T, Morozov I. 2004. Variation of mitochondrial DNA D-loop sequences in the endangered Siberian crane Grus leucogeranus Pallas. Conserv Genet, 5: 847–851.
Reed JZ, Tollit DJ, Thompson PM, Amos W. 1997. Molecular scatology: the use of molecular genetic analysis to assign species, sex and individual identity to seal faeces. Mol Ecol, 6: 225–234.
Regnaut S, Christe P, Chapuisat M, Fumagalli L. 2006a. Genotyping faeces reveals facultative kin association on capercaillie's leks. Conserv Genet, 7: 665–674.
Regnaut S, Françoise SL, Fumagalli L. 2006b. DNA degradation in avian faecal samples and feasibility of non-invasive genetic studies of threatened capercaillie populations. Conserv Genet, 7: 449–453.
Rhymer JM, Fain MG, Austin JE, Johnson DH, Krajewski C. 2001. Mitochondrial phylogeography, subspecific taxonomy, and conservation genetics of sandhill cranes (Grus canadensis; Aves: Gruidae). Conserv Genet, 2: 203–218.
Rogers AR, Harpending H. 1992. Population growth makes waves in the distribution of pairwise genetic differences. Mol Biol Evol, 9: 552–569.
Rozas J, Sánchez-DelBarrio JC, Messeguer X, Rozas R. 2003. DNASP, DNA polymorphism analyses by the coalescent and other methods. Bioinformatics, 19: 2496–2497.
Sambrook JEF, Fritsch EF, Maniatis T. 1989. Molecular Cloning: A Laboratory Manual. Cold Spring Harbor Laboratory Press, Cold Spring Harbor.
Tajima F. 1989. Statistical method for testing the neutral mutation hypothesis by DNA polymorphism. Genetics, 123: 585–595.
Tamura K, Dudley J, Nei M, Kumar S. 2007. MEGA4: Molecular Evolutionary Genetics Analysis Molecular evolutionary genetics analysis (MEGA) software version 4.0. Mol Biol Evol, 4: 1596–1599.
Trimbos KB, Musters CJM, Verkuil YI, Kentie R. 2011. No evident spatial genetic structuring in the rapidly declining black-tailed godwit Limosa limosa limosa in the Netherlands. Conserv Genet, 12(3): 629–636.
Wang QS, Yan CW. 2002. The cranes, rails and bustards of China. National Feng Huang Ku Bird Park Press, Taiwan. (in Chinese)
Wang RJ. 2001. Application of molecular scatology to animal ecology. Acta Zool Sin, 47(6): 699–703. (in Chinese)
Xia X, Xie Z. 2001. DAMBE: Data analysis in molecular biology and evolution. J Hered, 92: 371–373.
Xu WB, Cheng YQ, Long XC. 2006. The monitoring on wintering waterfowls in Anhui Shengjin Lake National N.R. Chinese Crane News, 10(1): 12–14. (in Chinese)
Zan ST, Zhou LZ, Jiang H, Zhang BW, Wu ZA, Hou YX. 2008. Genetic structure of the oriental white stork (Ciconia boyciana): implications for a breeding colony in a non-breeding area. Integr Zool, 3: 235–244.
Zhang H. 2006a. Survey on waterfowls in Anqing Riverine Wetland N.R., 2005/2006. Chinese Crane News, 10(1): 9–11. (in Chinese)
Zhang KJ. 2006b. Survey on waterfowls at the North Lake, Chongming Island. Chinese Crane News, 10(1): 31–35. (in Chinese)
Zhang WW, Zhang YM, Wang Q, Li F. 2010. Genetic diversity and population structure of Marsh Grassbird (Locustella pryeri sinensis) in China. J Forest Res, 21(3): 361–366.
Zhao JY, Li JH, Yang L, Yin HB. 2005. Research on DNA extraction from old faeces of Macaca thibetana. Acta Theriol Sin, 25(4): 410–413. (in Chinese)
Table
2.
Sample size (n), haplotype diversity (h) and nucleotide diversity (π) in four populations of the Hooded Crane, with the results of Tajima's and Fu's neutrality tests.

 DownLoad:


 Email Alerts
 RSS Feeds