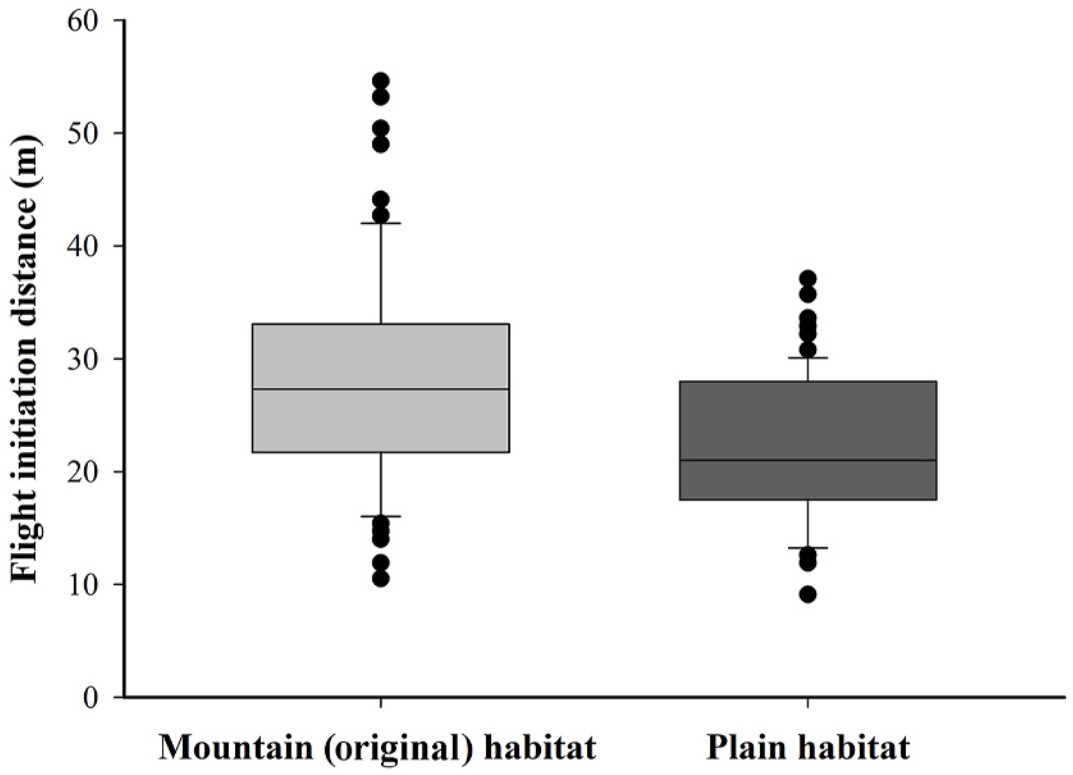
Animals must strike a balance between anti-predation behavior and other essential behaviors, such as foraging. Within the same species, strategies may vary on individuals' risk-taking preferences, and in this process the environment is a determinant, in addition to predator regime. The Crested Ibis (Nipponia nippon) exhibits such tendency. This is an endangered species, once inhabiting exclusively in China's Qinling Mountain. This used to be the sole remaining wild population. However, over recent decades, this population has expanded. A portion has relocated to breed in the lower plain area, which is characterized by elevated level of human activities and landscape complexity. We used flight initiation distance (FID) as an indicator of the ibises' risk-taking preference, particularly their response to human proximity. Additionally, we examined the environmental factors influencing their foraging site selection, including altitude, terrain openness, human activity intensity and human construction. Our findings revealed a significantly shorter FID among individuals relocating to plain habitats, indicating a higher tolerance of human proximity. The results showed that FID decreased with distance to the nearest human settlement. Another finding is that FID was independent of instant human activity intensity and environmental factors (altitude and terrain openness). These different may arise from various combinations of human activity, predation risk, and food abundance within the two habitats. These results provide insights into the insitu conservation of the threatened species within the context of global urbanization.
Communal roosting, commonly seen in birds, is the aggregation of more than two conspecifics spending the diurnal or nocturnal resting periods together (Bijleveld et al. 2010; Laughlin et al. 2014). However, the driving forces behind communal roosting and its adaptive value are still not fully understood. Several hypotheses that explain the benefits of communal roosting have been proposed, including reduced thermoregulation demand, lower predation risk, and greater foraging efficiency (Eiserer 1984; Beauchamp 1999).
An increase in foraging efficiency is often considered as the main benefit of communal roosting in birds. Roost sites can act as information centres, whereby unsuccessful foragers can learn about the locations of food sources by following successful foragers (Ward and Zahavi 1973; Chou 2015). Locations where birds form roosts are often thought to be influenced by the proximity of food resources. Alternatively, the patch-sitting hypothesis proposes that roosts tend to be close to supplemental feeding areas, reducing the commuting cost from distant foraging sites to roost sites (Caccamise and Morrison 1986, 1988).
The thermoregulation hypothesis proposes that the presence of nearby companion birds can reduce high energy costs during inactivity phases (McKechnie and Lovegrove 2002; McKechnie et al. 2006), and/or the physical structure of the roost can protect the roosting birds from detrimental weather conditions (Broom et al. 1976). A considerable body of studies found that the microhabitat temperature of roost sites was higher than that of non-roost sites (Clergeau and Quenot 2007; Erickson 2015), which emphasised that roost site selection in cold weather may be constrained by thermoregulatory considerations (Buttemer 1985).
There has been a myriad of research aimed to find out the environmental factors influencing communal roosting by comparing the characteristics between roosts and non-roosts (Clergeau and Simonnet 1996; Peh and Sodhi 2002; Yap et al. 2002; Erickson 2015; Jaggard et al. 2015). However, some of these studies offered contradictory findings. For instance, both positive and negative impacts of illumination on roosting have been recorded (Erickson 2015; Jaggard et al. 2015). These inconsistent findings indicate that variations among roosts may be significant, but have been insufficiently studied. Only a few studies have emphasised the seasonal variation of roosts (Barrows 1981; Buehler et al. 1991; Gorenzel and Salmon 1995). Despite the enhanced understanding of roost site selection, knowledge regarding seasonal switching remains limited.
Yellow-crested Cockatoo (Cacatua sulphurea) is a critically endangered species endemic to Indonesia and Timor-Leste (BirdLife International 2018). As a result of the international pet trade, Yellow-crested Cockatoo was introduced to Hong Kong, China. A released and/or escaped population (c. 100‒150 individuals) has inhabited the remnant green patches in highly urbanised areas (Leven and Corlett 2004; Mok et al. 2012). We observed that as many as 102 cockatoos formed communally roosting flocks throughout the year (Wang 2020). The birds would first come to a pre-roost gathering which is defined as an aggregation of individuals that occurs before departure to the nocturnal roosts (Moore and Switzer 1998). But while the pre-roost gathering was always in the same place, the locations of communal roosts changed seasonally. To some extent, this pattern supported the hypothesis that the function of pre-roost gathering is to provide individual birds with the knowledge about the changeable roost locations (Zahavi 1971; Sonerud et al. 2002). However, the causes of this seasonal variation of roost sites are not understood.
We hypothesised that the seasonal switching of roost sites was influenced by multiple environmental factors in an urban environment, and that roost sites would have different microhabitat characteristics. To test this, we assessed the microhabitat characteristics of roosts from three aspects: land use composition surrounding roost sites, microclimate temperature and human disturbance. We attempted to find out the crucial factors distinguishing different seasonal roosts and explore the possible causes of these associations. We hope that correlations between these environmental factors and roosts would contribute to the understanding of roost switching.
Methods
Study site and roost sites
The study was conducted in Hong Kong, which is located on the south coast of China (22° 09′‒22° 33′ N, 113° 50′‒114° 26′ E). It is a compact and highly populated city, with the majority of 7.48 million population residing on only 24.4% of 1110 km2 total land (Planning Department 2020). Hong Kong has a humid subtropical monsoon climate, tending towards temperate for nearly half the year. Due to monsoons and typhoons, 80% of the precipitation is concentrated between May and September (Hong Kong Observatory 2020). The mean daily minimum temperature varies monthly, ranging from 14.6 to 26.9 ℃. In contrast, the native habitats of Yellow-crested Cockatoo in Indonesia are almost entirely tropical. The mean daily minimum temperature remains fairly constant throughout the year, averaging 23.2 ℃. The minimum temperature variations between Hong Kong and Indonesia are relatively greater between December and March than other months, with Hong Kong being 5.6 ℃ to 8.6 ℃ colder during this season (Additional file 1: Table S1). This indicates a possible night-time cold stress of Yellow-crested Cockatoo in the winter of Hong Kong.
The studied roosting flock, which can be regularly observed and easily tracked, assembles on the northern coast of Hong Kong Island. This district is a prime financial and commercial centre of the city, characterised by dense and tall buildings. It also contains two large urban parks, i.e. Hong Kong Park (8.2 ha) and Hong Kong Zoological and Botanical Gardens (5.6 ha), which are the major feeding grounds for Yellow-crested Cockatoo, providing abundant and various plant food sources (Fig. 1).
The roosting population was counted once a week in clear evenings for two years (Year 2014/15 and 2015/16) from March 2014 to March 2016. As the evening progressed, birds in pairs or small flocks successively flew into the pre-roost gathering sites in Hong Kong Park from all directions. The observation lasted from late afternoon to early evening, beginning when the individuals flew to the pre-roost aggregation sites until no conspicuous flying and calling came from the flock at the final roost site (Davis 1955). We located the birds visually using binoculars (Nikon Monarch 5, 10 × 42), standing at a 30-m high observation tower in Hong Kong Park (Fig. 1). The observation tower afforded an unobstructed view to track the birds as they entered the pre-roost gathering sites and then settled into the roost sites, with a few exceptional locations where the birds could not be seen but their presence could later be identified by faecal droppings (Gorenzel and Salmon 1995). The number of cockatoos attending the pre-roost aggregation was counted every 5 min until the cockatoos flew into their roost site(s). The roosting flock size was counted at the roost site; otherwise, it was estimated from the final number obtained at the pre-roost site when not all individuals could be distinguished at the roost site. The pre-roosting aggregation would sometimes split up to occupy two to three roost sites, that the one greater in number was regarded as the major roost while the others were minor roosts.
In total, seven roost sites were identified to be used by Yellow-crested Cockatoo during the 105 observational days. Five sites were located on trees (BT, CT, GT, PT and RT), one on a building roof (CR), and the other on a cluster of lamp posts (LP). Given the occupied months and night minimum air temperature of occupied days of each roost (Additional file 2: Fig. S1), we classified the roost sites into three distinct groups, i.e. spring roosts (GT and PT), summer roosts (BT, CR and LP), and winter roosts (CT and RT). As roost CR was not accessible, we excluded it from all microhabitat-related analyses.
Data collection
To investigate whether land use around roosts affects roost site selection, we measured the proportion of land use types within a 50-m radius plot around each roost delineated by Google Earth Pro (Google Inc.). We modified the classification of land uses defined by Yap et al. (2002), whereby "tree-dominated area" refers to lands covered by tree canopies, "built-up area" represents developed areas with buildings, and "open space" consists of areas covered by roads, low-growing vegetation or other vacant lands.
To explore the level of human disturbance of each roost site, we quantified human disturbance using multiple anthropogenic components (Gorenzel and Salmon 1995; Peh and Sodhi 2002; Yap et al. 2002; Jaggard et al. 2015). Specifically, we collected data on (1) pedestrians: night-time occurrence of pedestrians passing by the roosts in 10-min durations; (2) traffic: night-time car volume on the nearest roads to the roosts in 10-min durations; (3) night-time noise level at the roost sites; (4) night-time light intensity at the roost sites; (5) mean roosting height above ground; and (6) distance to the nearest main road, building, streetlight and tree. We measured the mean number of pedestrians and number of vehicles of each roost by conducting a 10-min survey soon after the roosting flock settled down, once a month from July 2015 to February 2016. Similarly, we measured the noise levels and light intensity once a month, using an extendable sound meter and light meter, respectively. We held the instruments at the roosting height at four directions around each roost, soon after the roosting flock settled down. We recorded the light intensity three times per sampling evening and the average decibel for a total of 5-min per sampling evening. We measured the mean roosting height using a rangefinder (Nikon Forestry Pro). We estimated the distance to the nearest main road, building, streetlight, and tree on the Hong Kong GEOINFO MAP (www.map.gov.hk/gm/) since the measurements could not be accurately made on the ground. The mean values of the anthropogenic disturbance variables are given in Additional file 1: Table S1.
As described above, the night-time temperature in the winter of Hong Kong is much lower than that in the native habitats of Yellow-crested Cockatoo. We measured the microclimate of each roost site when the winter roosts were occupied, and recorded the microhabitat temperature at each roost site by positioning a thermometer on an extendable pole at the roosting height. The temperature was recorded for 5 min soon after the roosting flock settled down on each roost on 12 randomly selected days from late November 2015 to January 2016, from which the mean values (Tmicro) were calculated.
Data analysis
We compared the roosting flock size of each roost site using Kruskal-Wallis test followed by Wilcoxon rank sum tests. We conducted Pearson's chi-squared test to determine whether roost sites and land use types were independent of each other. We used Pearson residuals to measure the discrepancy between observed and expected values (Friendly 1994; Friendly and Meyer 2015). The formula is:
Cut-off points of Pearson residuals at ± 2 and ± 4 implied that the residuals were significant at α=0.05 and α=0.0001 levels respectively (Meyer et al. 2006). We performed a hierarchical clustering analysis using Ward's method to investigate how the roosts were grouped by human disturbance variables. Thereafter, we performed a partial least squares determinant analysis (PLS-DA) to maximise the variation between seasonal roost groups and identify the type of human disturbance important in roost site selection. PLS regression is designed explicitly for analytical situations where predictor variables are highly correlated and/or the sample size is smaller than the number of observations (Carrascal et al. 2009). The special case of PLS-DA is a supervised method where the response is a categorical variable (Pérez-Enciso and Tenenhaus 2003), like the seasonal roost pattern in the present study. This method extracts components (or latent variables) from predictor variables and indicates its importance in explaining the response variable. The results of the PLS-DA model include R2X and R2Y scores which indicate the explained variance and Q2Y score which indicates the predictive variance of model fit (Wu and Guo 2018). The performance of PLS-DA model was assessed via overall misclassification error rate and significance of R2Y and Q2Y by leave-one-out cross-validation and permutation testing (100 cycles) respectively (Thévenot et al. 2015; Rohart et al. 2017). The predictor variables were standardised before PLS-DA regression. We performed a one-way repeated measures ANOVA followed by paired t-tests to determine whether there was a significant difference of microclimate temperature between winter roosts and other roosts. We conducted the Mauchly's test of sphericity to test if the variances of each paired roost site were equal and assumption of sphericity was met. Prior to the analysis, Tmicro values were standardised to eliminate the variation among sampling times.
BT was the most frequently used roost (44.8% of total observation days), followed by CT (23.8%), PT (16.2%) and RT (15.2%); LP, CR, and GT were the least frequently used (Fig. 2a). Winter roosts CT and RT were usually occupied between November and March. Specifically, CT was mainly occupied in the first year, while RT was mostly used in the second year. Likewise, spring roost PT was primarily used in 2014/5 whereas GT was used more in 2015/6. PT was often used between March and June, but GT was only occupied between April and May. The occupancy of summer roost BT lasted for 8 months, from April to November. In contrast, summer roosts CR and LP were usually occupied between June and September, and on most occasions, they were used as the minor roosts for BT. At the time of seasonal roost switching, the roosts of the last season and next season were sometimes used interchangeably. This implied that the environmental factors affecting roost switching had been changing but were not stable, and cockatoos were sensitive to these changes by choosing the optimal roost site on a daily basis.
Figure
2.
Bar plots of roosting days (a) and violin plots of roosting flock size (b) of each roost site. Different letters in (b) denote significant differences of roosting flock size between roost sites (Kruskal-Wallis test followed by pairwise Wilcoxon rank sum-tests; p adjusted by Benjamini-Hochberg method)
In terms of roosting flock size, the differences among BT, CT, GT, PT and RT were not significant, with a mean flock size ranging from 63 to 74. However, the mean roosting flock size of CR and LP was 21 and 22, respectively, which were significantly smaller than those of other roosts (Kruskal-Wallis test, χ2=37.008, df=6, p < 0.001). This is because these sites were artificial perching structures with limited space. Violin plots showed the data distribution of flock size of each roost, where the wider sections of the violin plots represented a higher probability of that flock size and vice versa (Fig. 2b). With the exception of BT, the distribution of the data was similar within seasons, but different across seasons. For example, the flock size was around the median for spring roosts GT and PT, while the distribution of flock size of summer roosts CR and LP had two noticeable peaks. It indicated that variations in flock size were larger for roosts used in different seasons than those used in the same season.
Microhabitat characteristics of roost sites
Land use types were significantly associated with roost sites (Pearson's chi-squared test, χ2=130.82, df=10, p < 0.001). As indicated by the Pearson residuals, tree-dominated areas were strongly positively associated with spring roosts GT and PT (Fig. 3a), with a proportion of 50% and 63% respectively (Fig. 3b). In contrast, tree-dominated areas were significantly negatively related to summer roost BT (18%) and LP (14%), and winter roost CT (15%). The proportion of tree-dominated areas separated the roosts used during spring from the other roosts (Fig. 3b). This indicated that spring roosts were closer to green patches than other roosts. Overall, the amount of built-up area varied considerably; for example, the percentage of built-up area was extremely low surrounding spring roost PT (3%) but was much larger for summer roost BT (44%).
Figure
3.
A mosaic plot (a) with residual-based shading of land use types versus roost sites, and a ternary diagram (b) of the proportion of land use types within a 50-m circular plot of roost sites. In the mosaic plot, blue colour indicates the observed value is higher than the expected value, while red colour denotes the observed value is lower than the expected value
The seasonal roost categories were well distinguished by the cluster analysis using anthropogenic disturbance parameters (Fig. 4a). This suggests that human disturbance was associated with seasonal switching among roosts. Moreover, two components (Comp 1 and Comp 2) extracted from the PLS-DA regression were sufficient to achieve the best classification performance of roosts by cross-validation (Overall error rate=0.000) and permutation testing (p=0.04). They captured 73.6% of the human disturbance variables and explained 98.4% of the variance of seasonal roost types (Table 1). Performance of the prediction was good with a cumulative predict variance (Q2Y) of 89.1%. Comp 1 discriminated spring roosts (PT and GT) from other roosts (Fig. 4b), where the distance to the nearest building, streetlight and road were positively correlated with spring roosts while traffic, noise level, pedestrians and light intensity had negative loadings on spring roosts (Fig. 4c, d). Consistent with the analyses on land use types, spring roosts were much closer to other trees. These indicated that spring roosts were distant from all human activities. Comp 2 further discriminated winter and summer roosts (Fig. 4b). Both roost groups were close to building, light and road. However, winter roosts were positively associated with roosting height, pedestrians, and noise level, where they were usually near bus stops, zebra crossings, and a tourist service centre. Summer roosts were positively related to light intensity (Fig. 4c, e).
Figure
4.
Hierarchical dendrogram using Ward's clustering method (a), and PLS-DA regression score plot (b), correlation circle plot (c) and loading plots (d, e) of anthropogenic disturbance parameters on seasonal roost patterns. The score plot visualises the component scores, and prediction areas of each roost category. The correlation circle plot displays the Pearson correlation between the variables and latent components. The loading plots show the loading weights (contributions) of each variable on each component. The most important variables (according to coefficient values) are ordered from bottom to top. Colours indicate the seasonal roost pattern where the mean value of this variable is maximal. Roost Height: roosting height; Light: light intensity; Noise: noise level; DistRoad/DistTree/DistLight/DistBuild: distance to the nearest road/tree/light/building
Table
1.
Percentage of explained variance in the predictor variables (R2X) and the response variable (R2Y) per component and their cumulative values (R2X cum and R2Y cum) derived from PLS-DA regression
Component
R2X
R2X cum
R2Y
R2Y cum
Q2Y cum
Error rate
Comp 1
0.491
0.491
0.491
0.491
0.165
0.833
Comp 2
0.245
0.736
0.494
0.984
0.891
0.000
Q2Y cum is the cumulative predictive variance of fit by cross-validation. Error rate using maximum distance in Comp 2 includes the performance of the PLS-DA model in Comp 1
Roosts were categorised into two distinct groups by Tmicro, viz. the high and low Tmicro group, that exhibited a highly significant difference (one-way repeated measures ANOVA, sphericity assumed, F (5, 55)=37.6, p < 0.001; Fig. 5). The temperature difference between groups attained as much as 1.1 ℃, where the high Tmicro group included CT, RT and LP, and the low Tmicro group comprised of BT, GT and PT. Winter roosts were all categorised into the high Tmicro group, which were significantly warmer than the spring roosts and the major summer roost. It might be because winter roosts are close to the main road with heavy traffic and pedestrians (Additional file 1: Table S2), from which the external source of heat was produced.
Figure
5.
Boxplots of standardised Tmicro of each roost site. Different letters denote significant differences of Tmicro between roost sites (one-way repeated measures ANOVA followed by paired pairwise t-tests; p adjusted by Benjamini-Hochberg method)
Seasonal switching of roost sites was associated with multiple environmental factors, wherein some microhabitat characteristics showed consistency among roost sites used in the same season but significant differences among sites used in different seasons.
Spring roosts were distinguished from other roosts by the high proportion of canopy cover at and adjacent to the roost sites. Besides, spring roosts were farther away from the main roads, streetlights, and buildings. This indicates that spring roosts were closer to green patches than other roosts. In addition, these related green patches are urban parks which serve as the daily feeding grounds and diurnal activity centre for Yellow-crested Cockatoo (Wang et al. 2018). A handful of research had shed light on the importance of food resources in roost site selection and shown that roost sites are usually located in the most visited foraging areas (Jenni 1991; Yap et al. 2002; Saiyad et al. 2017). Caccamise and Morrison (1988) found an increase in the number of European Starling using major roosts coincided with seasonal changes in foraging-substrate selection and diet composition. However, the information centre hypothesis may not apply to this study as the locations of food sources (e.g. plants) did not change dramatically in the short-term.
Summer roosts were often located in less vegetated areas but surrounded by a larger proportion of built-up and open area. Besides, night light had a positive correlation on roosting in summer for Yellow-crested Cockatoo. Rainbow Lorikeet (Trichoglossus haematodus) and Carnaby's Black Cockatoo (Calyptorhynchus latirostris) had similar preference for roost sites in parking lots and sports grounds that received more artificial light at night (Berry 2008; Jaggard et al. 2015; Daoud-Opit and Jones 2016; Le Roux 2017). The roosts of House Crow (Corvus splendens) in mid-July to mid-October in metropolitan Singapore had better illumination, shorter distance to buildings, and less surrounding vegetation (Peh and Sodhi 2002), a result which was very similar to the urban setting of the summer roosts of Yellow-crested Cockatoo in this study. It is generally acknowledged that light is associated with predator avoidance because parrot species have relatively poor vision in low-light conditions (Birkhead 2012). New-borns of Yellow-crested Cockatoo were often observed in the roost sites. Indeed, roost switching in summer was probably related to the protection of juveniles because they were likely to be vulnerable to some commonly seen urban predators (e.g. wild cats, masked palm civets).
Winter roosts were characterised by higher microhabitat temperatures, which suggests a preference for relatively warmer roost sites in cold weather. Similar studies found that the minimum temperature was usually 0.5 ℃ to 1.4 ℃ greater at roosts compared to non-roosts for American Crow (Corvus brachyrhynchos) and European Starling (Sturnus vulgaris) in an urban environment (Gorenzel and Salmon 1995; Clergeau and Quenot 2007; Erikson 2015). The mean temperature of Hong Kong is 6 ℃ to 9 ℃ lower than that in Indonesia between November to April, which is an indication of their behavioural flexibility that Yellow-crested Cockatoo coped with low-temperature stress in a non-native urban environment. Switches between roosts over a short period also highlight that Yellow-crested Cockatoo is sensitive to abrupt temperature changes. During late November to early December 2015, the cockatoos started to roost on the winter roost RT when the ambient temperature dropped to 15.9 ℃, but they returned quickly to the summer roost BT as soon as the ambient temperature increased to 22.0 ℃. After a few days, they switched back to the winter roost again when cold weather prevailed. The warm roosts were usually associated with intensive human activities because the concrete substrate beneath and urban heat island effect is an external source of heat for the roosts (Clergeau and Quenot 2007; Le Roux 2017). Due to urban heat island effect, the temperature in commercial areas is usually greater than residential areas and urban parks (Lee et al. 2009), which is consistent with land uses composition for roost sites in this study. For example, Asian Rose-necked Parakeet (Alexandrinus manillensis) roosted in the warmest places in cities where traffic was highest (Braun et al. 2018). American Crow preferred roosting in commercial areas and along streets, where the interior canopy temperatures of the roost trees were higher (Gorenzel and Salmon 1995). Likewise, the winter roosts of Yellow-crested Cockatoo were characterised by high levels of noise and pedestrian flow under the roost trees, as well as a short distance to the main road with heavy traffic.
Our results confirmed that differences in microhabitat characteristics among seasonal roosts could be significant. Consequently, it was not surprising that some studies, focusing on variations between roosts and non-roosts, have obtained inconsistent results with ours. For example, Erickson (2015) found that the night-time light intensity was lower at roosts than that at non-roosts probably because they only investigated the winter roosts. Clergeau and Quenot (2007) found ambient temperature but not illumination significantly higher in the roost site, perhaps as they only studied the roosts from November to February. In contrast, our results indicated that illumination was possibly just not the major selective factor for birds during this period. Despite these inconsistencies with previous work, which may be the result of habitat differences at the species level, our study provides an alternative explanation for variation among roost sites between which birds can seasonally switch.
This study was limited by the small sample size. Cockatoos (c. 20-30 individuals) outside the study area were not surveyed due to their small flock size and unstable roosting behaviour observed. Another limitation was that the results based on correlation analyses were not robust to support any hypothesis related to the benefits and driving forces behind communal roosting. Sampling size could be increased by identifying other relatively stable roosting flocks in Hong Kong or studying urban populations in other countries such as Singapore (Neo 2012). Besides, future studies can be designed to explain the specific requirements for roost sites in different seasons.
Conclusions
Roost site switching is the result of the selection of different environmental factors in different seasons. Spring roosts were close to green patches, and distant from the main roads, streetlights and buildings. Summer roosts usually received more artificial light in less vegetated areas. Winter roosts had higher microhabitat temperatures, usually being isolated tall trees located in the most crowded and noisiest urban areas. The study provides evidence that the variations among roost sites were associated with differences in microhabitat characteristics and suggests that special attention should be paid to the seasonal variation among roost sites in future studies.
Additional file 1: Table S1. The difference of mean daily minimum temperature (Tmin) between Hong Kong (Tmin, HK) and five locations of Indonesia (− Tmin), respectively. Table S2. Mean values and standard deviations (if any) of anthropogenic disturbance variables of roost sites of Yellow-crested Cockatoo in urban areas of Hong Kong.
Additional file 2: Figure S1. Boxplots of the Tambient (night minimum air temperature of occupied days) of each roost site during the study period. Different letters denote significant differences between roost sites (Kruskal–Wallis test followed by pairwise Wilcoxon rank sum tests; p adjusted by Benjamini–Hochberg method)
Acknowledgements
We thank Mr. Ben Yeung and Mr. Banson Leung for their technical assistance.
Authors' contributions
LMC and SW conceived the idea. SW collected and analysed the data, and leaded the writing. LMC revised and polished the manuscript. Both authors read and approved the final manuscript.
Funding
This study was supported by the Hong Kong Environment and Conservation Fund (ECF Project 02/2014) and the United College Endowment Fund of The Chinese University of Hong Kong.
Availability of data and materials
The datasets used and/or analysed during the current study are available from the corresponding author on reasonable request.
Ethics approval and consent to participate
Not applicable.
Consent for publication
Not applicable.
Competing interests
The authors declare that they have no competing interests.
Bateman, P.W., Fleming, P.A., 2014. Switching to plan B: changes in the escape tactics of two grasshopper species (Acrididae: Orthoptera) in response to repeated predatory approaches. Behav. Ecol. Sociobiol. 68, 457–465.
Bates, D., Maechler, M., Bolker, B., Walker, S., Christensen, R.H.B., Singmann, H., 2013. lme4: Linear Mixed-Effects Models Using Eigen and S4 (Version 1.0-5). R package. .
Bautista, L.M., García, J.T., Calmaestra, R.G., Palacín, C., Martín, C.A., Morales, M.B., et al., 2004. Effect of weekend road traffic on the use of space by raptors. Conserv. Biol. 18, 726–732.
Bell, A.M., Hankison, S.J., Laskowski, K.L., 2009. The repeatability of behaviour: a meta-analysis. Anim. Behav. 77, 771–783.
Blumstein, D.T., 2003. Flight-initiation distance in birds is dependent on intruder starting distance. J. Wildl. Manag. 67, 852–857.
Blumstein, D.T., 2006. Developing an evolutionary ecology of fear: how life history and natural history traits affect disturbance tolerance in birds. Anim. Behav. 71, 389–399.
Blumstein, D.T., 2010. Flush early and avoid the rush: a general rule of antipredator behavior? Behav. Ecol. 21, 440–442.
Carere, C., van Oers, K., 2004. Shy and bold great tits (Parus major): body temperature and breath rate in response to handling stress. Physiol. Behav. 82, 905–912.
Carrete, M., Martínez-Padilla, J., Rodríguez-Martínez, S., Rebolo-Ifrán, N., Palma, A., Tella, J.L., 2016. Heritability of fear of humans in urban and rural populations of a bird species. Sci. Rep. 6, 31060.
Carrete, M., Tella, J.L., 2010. Individual consistency in flight initiation distances in burrowing owls: a new hypothesis on disturbance-induced habitat selection. Biol. Lett. 6, 167–170.
Carrete, M., Tella, J.L., 2011. Inter-individual variability in fear of humans and relative brain size of the species are related to contemporary urban invasion in birds. PLoS One 6, e18859.
Cooper, W.E., Blumstein, D.T., 2014. Novel effects of monitoring predators on costs of fleeing and not fleeing explain flushing early in economic escape theory. Behav. Ecol. 25, 44–52.
Cooper Jr., W.E., 2008. Strong artifactual effect of starting distance on flight initiation distance in the actively foraging Lizard Aspidoscelis exsanguis. Herpetologica 64, 200–206.
Cresswell, W., 2008. Non-lethal effects of predation in birds. Ibis 150, 3–17.
Ding, C., 2004. Research on the Crested Ibis. Shanghai Scientific and Technological Educational Publishing House, Shanghai.
Ding, C., 2010. Crested ibis. Chinese Birds 1, 156–162.
Ding, C., Liu, D., Yu, X., Chu, G., 2001. The birds in the distribution area of the Crested Ibis (Nipponia nippon). Chin. J. Zool. 37, 48–55.
Donald, P.F., Green, R.E., Heath, M.F., 2001. Agricultural intensification and the collapse of Europe’s farmland bird populations. Proc. R. Soc. A B 268, 25–29.
Dyer Dumont, F., Pasquaretta, C., Réale, D., Bogliani, G., Hardenberg, A., 2012. Flight initiation distance and starting distance: biological effect or mathematical artefact? Ethology 118, 1051–1062.
Engelhardt, S.C., Weladji, R.B., 2011. Effects of levels of human exposure on flight initiation distance and distance to refuge in foraging eastern gray squirrels (Sciurus carolinensis). Can. J. Zool. 89, 823–830.
Evans, J., Boudreau, K., Hyman, J., 2010. Behavioural syndromes in urban and rural populations of song sparrows. Ethology 116, 588–595.
Frid, A., Dill, L.M., 2002. Human-caused disturbance stimuli as a form of predation risk. Conserv. Ecol. 6, 11.
Gil, D., Brumm, H., 2014. Avian Urban Ecology: Behavioural and Physiological Adaptations. Oxford University Press, Oxford.
Hu, C., Song, X., Ding, C., Ye, Y., Qing, B., Wang, C., 2016. The size of winter-flooded paddy fields no longer limits the foraging habitat use of the endangered Crested Ibis (Nipponia nippon) in winter. Zool. Sci. 33, 345–351.
Huang, Y., Ye, Y., Zhang, Y., Barras, A.G., Wang, C., Qing, B., et al., 2022. Tall trees drive the nest-site selection of wild Crested Ibis Nipponia nippon. Bird. Conserv. Int. 32, 486–497.
Ibáñez-Álamo, J.D., Soler, M., 2010. Investigator activities reduce nest predation in blackbirds Turdus merula. J. Avian Biol. 41, 208–212.
IUCN, 2023. The IUCN Red List of Threatened Species. Version 2022-2. .
Jiang, Y., Møller, A.P., 2017. Escape from predators and genetic variance in birds. J. Evol. Biol. 30, 2059–2067.
Li, X., Ma, Z., Ding, C., Zhai, T., Li, D., 2002. Relationship between the distribution of crested ibis and local farmers. Acta Zool. Sin. 48, 725–732.
Liu, Y., 1981. Rediscovery of the crested ibis in qin mountain. Acta Zool. Sin. 27, 273.
Luther, D., Baptista, L., 2010. Urban noise and the cultural evolution of bird songs. Proc. R. Soc. B 277, 469–473.
Martin, J., Réale, D., 2008. Animal temperament and human disturbance: implications for the response of wildlife to tourism. Behav. Process. 77, 66–72.
Møller, A.P., 2008. Flight distance of urban birds, predation, and selection for urban life. Behav. Ecol. Sociobiol. 63, 63–75.
Møller, A.P., 2012. Urban areas as refuges from predators and flight distance of prey. Behav. Ecol. 23, 1030–1035.
Møller, A.P., 2013. Behavioral and ecological predictors of urbanization. In: Gil, D., Brumm, H. (Eds.), Avian Urban Ecology. Oxford University Press, Oxford, pp. 54–68.
Møller, A.P., 2014. Life history, predation and flight initiation distance in a migratory bird. J. Evol. Biol. 27, 1105–1113.
Nakagawa, S., Schielzeth, H., 2010. Repeatability for Gaussian and non-Gaussian data: a practical guide for biologists. Biol. Rev. 85, 935–956.
R Core Team, 2021. R: A Language and Environment for Statistical Computing. R Foundation for Statistical Computing, Vienna, Austria. .
Schell, C.J., 2018. Urban evolutionary ecology and the potential benefits of implementing genomics. J. Hered. 109, 138–151.
Seltmann, M.W., Öst, M., Jaatinen, K., Atkinson, S., Mashburn, K., Hollmén, T., 2012. Stress responsiveness, age and body condition interactively affect flight initiation distance in breeding female eiders. Anim. Behav. 84, 889–896.
Shochat, E., Warren, P.S., Faeth, S.H., McIntyre, N.E., Hope, D., 2006. From patterns to emerging processes in mechanistic urban ecology. Trends Ecol. Evol. 21, 186–191.
Sih, A., Ferrari, M.C., Harris, D.J., 2011. Evolution and behavioural responses to human-induced rapid environmental change. Evol. Appl. 4, 367–387.
Song, Z., Zou, Y., Hu, C., Ye, Y., Wang, C., Qing, B., et al., 2018. Silver spoon effects of hatching order in an asynchronous hatching bird. Behav. Ecol. 30, 509–517.
Tablado, Z., Jenni, L., 2015. Determinants of uncertainty in wildlife responses to human disturbance. Biol. Rev. 92, 216–233.
Tarjuelo, R., Barja, I., Morales, M.B., Traba, J., Benítez-López, A., Casas, F., et al., 2015. Effects of human activity on physiological and behavioral responses of an endangered steppe bird. Behav. Ecol. 26, 828–838.
Tatner, P., Bryant, D.M., 1986. Flight cost of a small passerine measured using doubly labeled water: implications for energetics studies. Auk 103, 169–180.
Tomialojc, L., 1982. Synurbanization of Birds and Prey–Predators Relations. Animals in Urban Environments. Ossolineum, Wroclaw, Poland, pp. 131–137.
Valcarcel, A., Fernández-Juricic, E., 2009. Antipredator strategies of house finches: are urban habitats safe spots from predators even when humans are around? Behav. Ecol. Sociobiol. 63, 673–685.
van Dongen, W.F.D., Robinson, R.W., Weston, M.A., Mulder, R.A., Guay, P.-J., 2015. Variation at the DRD4 locus is associated with wariness and local site selection in urban black swans. BMC Evol. Biol. 15, 253.
Webb, N.V., Blumstein, D.T., 2005. Variation in human disturbance differentially affects predation risk assessment in western gulls. Condor 107, 178–181.
Weston, M., McLeod, E.M., Blumstein, D., Guay, P.-J., 2012. A review of flight-initiation distances and their application to managing disturbance to Australian birds. Emu 112, 269–286.
Wolf, M., van Doorn, G.S., Leimar, O., Weissing, F.J., 2007. Life-history trade-offs favour the evolution of animal personalities. Nature 447, 581–584.
Worrell, T., Admiraal, R., Bateman, P., Fleming, P., 2016. Are tourism and conservation compatible for ‘island tame’species? Anim. Conserv. 20, 155–163.
Xu, X., Ye, Y., Briggs, E., Wang, C., Qing, B., Song, Z., et al., 2023. Why do parents produce small broods of offspring that have lower body mass, survival, and lifetime reproductive success? A case study in a long-lived bird. Behav. Ecol. Sociobiol. 77, 30.
Ye, Y., Santoro, S., Song, Z., Hu, C., Zhang, Z., Qing, B., et al., 2022. Dispersal patterns of the endangered Crested Ibis suggest high breeding densities drive natal dispersal. Ornithol. Appl. 125, duac042.
Yeh, P.J., Hauber, M.E., Price, T.D., 2007. Alternative nesting behaviours following colonisation of a novel environment by a passerine bird. Oikos 116, 1473–1480.
Zanette, L.Y., White, A.F., Allen, M.C., Clinchy, M., 2011. Perceived predation risk reduces the number of offspring songbirds produce per year. Science 334, 1398–1401.
Table
1.
Percentage of explained variance in the predictor variables (R2X) and the response variable (R2Y) per component and their cumulative values (R2X cum and R2Y cum) derived from PLS-DA regression
Component
R2X
R2X cum
R2Y
R2Y cum
Q2Y cum
Error rate
Comp 1
0.491
0.491
0.491
0.491
0.165
0.833
Comp 2
0.245
0.736
0.494
0.984
0.891
0.000
Q2Y cum is the cumulative predictive variance of fit by cross-validation. Error rate using maximum distance in Comp 2 includes the performance of the PLS-DA model in Comp 1


 DownLoad:


 Email Alerts
 RSS Feeds