The brain is among the most energetically costly organs in vertebrates, and thus trade-offs have been hypothesized to exert constraints on brain size evolution. The energy trade-off hypothesis (ETH) predicts that reducing the energy consumption of reproduction or other costly tissues should compensate for the cost of a large brain. Egg production in birds requires a large proportion of the total energy budget, and a clutch mass in some bird species can outweigh the body mass of the female. To date, this hypothesis has mainly been tested in mammals and ectothermic animals such as anurans and fishes. We collated data on adult brain size, body mass and egg-production traits such as clutch size, egg mass and annual broods from published studies, and conducted a phylogenetic comparative test of the interplay between egg-production investment and brain size evolution across bird species. After controlling for phylogenetic relationships and body size, we find a negative correlation between brain size and clutch size across 1395 species, which favored ETH. However, when egg mass was integrated in models, positive associations were detected between brain size and mass of eggs (via egg mass, clutch mass and annual total egg mass). Our results suggest that brain size trades off against egg-production only via certain aspects (e.g., clutch size). By contrast, a positive relationship between brain size and total egg reproduction (e.g., clutch mass and annual total egg mass) implied increased total energy budget outweighing energy allocation across bird species. Our study shows that there is no general energy trade-off between brain size and egg-reproduction investment, and suggests that brain size evolution follows mixed strategies across bird species.
Brain size in higher vertebrates differs substantially in both absolute and relative terms after controlling for allometry (Allman, 2000). Understanding the driving forces behind the evolution of brain size is a subject of longstanding interest to evolutionary biologists (Lemaître et al., 2009; Sayol et al., 2016, 2018; Chen et al., 2021; Liao et al., 2022). It has been known that there are costs and benefits to evolving larger brains, but selection is expected to favor the brain size that gives a net benefit (Isler and van Schaik, 2009). Large brains are often associated with cognitive benefits which bring higher behavioral flexibility, better problem-solving ability and even longer longevity (Kotrschal et al., 2014; Benson-Amram et al., 2016; Jiménez-Ortega et al., 2020; Liu et al., 2023). However, large brains are metabolically expensive, as brain tissue requires substantially more energy per unit weight than many other tissues (so-called expensive brain hypothesis; Mink et al., 1981; Isler and van Schaik, 2009). The brain is so metabolically active that its energetic needs cannot be temporarily reduced when compared with many other tissues (Karasov et al., 2004). The high amount of energy needed to maintain brain tissue should impose serious constraints on the evolution of brain size (Mink et al., 1981; Striedter, 2005). Therefore, metabolic costs of large brains have to be met by either increasing the total energy budget or by reducing energy allocation to other body maintenance functions (Isler and van Schaik, 2009; Minias and Podlaszczuk, 2017). Compensation for large brains may proceed via reductions in the costs of reproduction or other costly tissues.
Enlarged relative brain size should evolve through a balance between costs that constrain its evolution, and the associated benefits that promote it (Niven and Laughlin, 2008; Isler and van Schaik, 2009; Sol, 2009). Based on the expensive brain hypothesis, several extended hypotheses have been proposed to investigate the cost side of brain size evolution (Martin, 1981; Aiello and Wheeler, 1995; Benson-Amram et al., 2016). One representative hypothesis is the energy trade-off hypothesis (ETH) which predicts energy costs trade-off between the brain and reproduction, locomotion or development (Aiello and Wheeler, 1995; Isler and van Schaik, 2006). Among the costly tissues or functions, reproduction requires extremely high energy costs in vertebrates (Roff, 2002; Li et al., 2022). In some avian species, for example, females produce a clutch of eggs outweighing their body mass (e.g., Regulus calendula and Aegithalos caudatus; del Hoyo et al., 1992–2011). The energy trade-off hypothesis predicts that positive selection for fecundity may constrain brain size evolution and vice versa, especially in harsh environments (Isler and van Schaik, 2006; Liao et al., 2016).
A number of comparative studies have tested the predictions of tradeoffs between brain size and reproductive investment since this hypothesis was proposed. However, studies have primarily focused on energetic tradeoffs between brains and reproduction in mammals or ectothermic vertebrates such as anurans and fish (e.g., Lemaître et al., 2009; Kotrschal et al., 2014; Tsuboi et al., 2015; Liao et al., 2016), while studies testing this trade-off in birds are still sparse. Jiménez-Ortega et al. (2020) implied a positive relationship between brain size and egg mass in 339 bird species through path analyses. Another comparative study suggested that relative brain size is negatively associated with fecundity (clutch size times number of annual broods) but positively associated with egg size in 497 birds (Isler and van Schaik, 2006). These studies found mixed support for ETH and thus the relationship between brain size and egg production investment remains obscure. Moreover, investigating only one or two aspects of egg production likely does not represent the whole egg production investment per year. Integrating all aspects of egg production (clutch size, egg size and number of annual broods) within analyses could be more helpful to understand trade-offs between brain size and reproduction. However, such studies are still rare.
Avian species show remarkable variation both in brain size (Iwaniuk and Nelson, 2003; Sayol et al., 2016) and reproductive output (e.g., clutch size; Jetz et al., 2008). Bird species can produce a clutch of eggs weighing from < 3% (e.g., Aptenodytes forsteri and Vultur gryphus) to > 100% (e.g., A. hypoleucos and R. calendula) of their body mass (del Hoyo et al., 1992–2011; Jiménez-Ortega et al., 2020). Huge reproductive investment should constrain other energy-costly organs such as brains. Therefore, birds provide an appealing opportunity to test the ETH. Their diverse levels of reproductive investment in egg production (del Hoyo et al., 1992–2011) allow us to investigate whether energetic requirements of encephalization may lead to covariation between brain size and reproductive investment. Moreover, birds have two development states of hatchlings, ranging from precocial (no or little provisioning of the young) to altricial (prolonged provisioning), hereafter referred as development mode (Roff, 2002). Previous study suggested that large variations exist in life history traits between two development mode (Roff, 2002; Jetz et al., 2008), but whether such variations lead to different egg-production investment strategy remain unclear.
Here, we collected published data to investigate the relationship between brain size and integrated fecundity at different levels (e.g., clutch size, clutch mass, annual fecundity and annual total egg mass; detailed definitions of these terms see methods and Table 1) across avian species. The relationship between brain size and integrated fecundity (Table 1) across avian species, to our knowledge, has not been fully tested in previous studies. Several studies detected that larger-brained species produce smaller clutch/litter sizes but larger neonates in mammals, fishes and anurans (Pitnick et al., 2006; Tsuboi et al., 2015; Liao et al., 2016), but whether annual fecundity or annual total egg mass is associated with brain size are still unknown in birds. Larger eggs are probably developmentally necessary for larger-brained species, to support encephalization processes (Liao et al., 2016), but larger eggs in large-brained species did not necessarily suggest increased reproductive investment. That is, larger eggs could be a byproduct of decreased reproductive output via decreased clutch size, annual fecundity or clutch mass. However, whether that is the case is currently unknown. According to the ETH, the costs of large brain size could be met through reduction in energy allocation to other costly functions such as reproduction (Isler and van Schaik, 2009). Therefore, we predict that larger brains should accompany less/lighter egg-production investment in birds due to the trade-offs between brains and reproduction.
Table
1.
Definition of terms on egg-production traits and their phylogenetic signals (λ).
Terms
Definition
No. of species
λ
Pa
Clutch size
Averaged number of eggs in a clutch of a species
1395
0.926
< 0.001
Egg mass
Averaged weight of eggs of a species
940
0.983
< 0.001
Annual broods
Averaged number of broods a species can produce in a year
455
0.828
< 0.001
Clutch weight
Averaged weight of a clutch of eggs
940
0.960
< 0.001
Annual fecundity
Clutch size times annual broods
454
0.926
< 0.001
Annual total egg mass
The product of clutch size, annual broods and egg mass
435
0.948
< 0.001
aP-values from likelihood-ratio tests against models with phylogenetic signal λ = 0.
We collated published data on adult brain size (mm3), body mass (g), clutch size (number of eggs in a clutch), egg mass (g), number of annual broods and development time (incubation period adding nestling period, days) in this study. Data on brain and body size were taken from two intensive comparative studies which reported such data in 1931 avian species; published data on brain size of bird species were measured on skulls from museum collections (details see Sayol et al., 2016, 2018). Brain size and body mass were calculated as means if values of males and females were presented separately. These studies also reported data on development time (the sum of incubation and fledging periods) for some avian species. We augmented the dataset by adding new information on egg-production traits (clutch size, egg mass and number of annual broods) and development time, which were collected from Isler and van Schaik (2006); Lislevand et al. (2007); Jetz et al. (2008), AnAge database (Tacutu et al., 2013) and Jiménez-Ortega et al. (2020). Data from different sources for the same variable were combined by calculating an averaged value.
For the same species, we compiled data on species-typical values (e.g., clutch size and development time) from a range of literature sources (e.g., Handbook of the Birds of the World Series, Sayol et al., 2018; see supporting materials). When these traits were reported in different populations of the same species, we used their mean values for later analyses. We also compiled those data from newly-published studies through Web of Knowledge and Google Scholar (using the keywords like 'brain size' or 'clutch size' in combination with 'bird'). Only species with brain size, body mass and at least one egg trait (clutch size, egg mass and/or annual broods) available were included in the dataset. Finally, we collected such data from 1395 species (see Appendix Table S1).
For species where more than one population (or geographic site) reported clutch sizes and other attributes, it is necessary to understand the extent to which an average value represents a species well. Our dataset is based on species-typical attributes that are integrated or averaged across populations or their geographic range. Jetz et al. (2008) obtained clutch size of more than half of land bird species over the world and found that intraspecific variation is much lower than interspecific variation in clutch size. Trends in clutch size with other attributes (e.g., body mass) across species should also be robust to potential biases from intraspecific variation, and thus a number of studies used the species-typical values on body mass to conduct interspecific comparative analyses (e.g., Sayol et al., 2016; 2018; Jiménez-Ortega et al., 2020). Therefore, the averaged value across populations to a large extent can represent a species, especially when sample sizes are large, as in this study. Values of attributes are typically averaged across populations, geographical locations and literature sources, and thus represent typical values for the species.
2.2
Statistical analyses
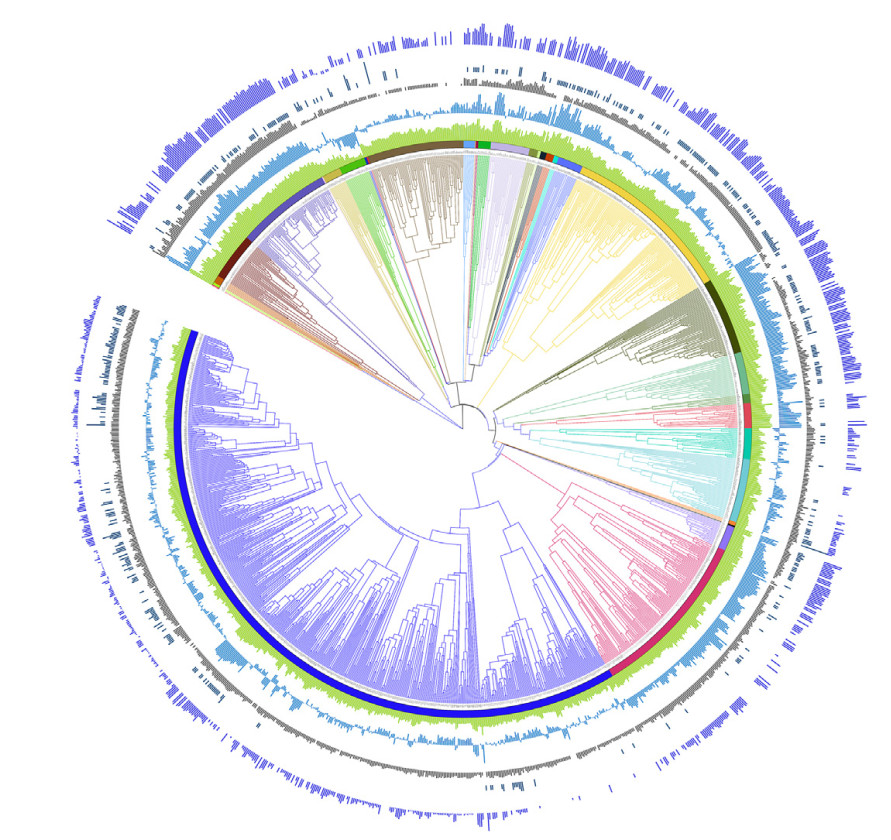
For the species in this study, classification and taxonomy followed Jetz et al. (2012). Extinct species and brood parasites were not included in this compilation. We defined three reproductive traits: fecundity as the product of clutch size and annual broods; clutch mass as the product of clutch size and egg mass; annual total egg mass as the product of clutch size, annual broods and egg mass (details see Table 1). We downloaded 1000 fully resolved trees from the Bird Tree project (Jetz et al., 2012) using the Hackett backbone for all our species (Hackett et al., 2008). With the 1000 trees, we built the maximum clade credibility tree (MCCT; Fig. 1) using the R package phangorn (Schliep, 2011).
Figure
1.
Phylogenetic distribution of body mass, brain size, clutch size, annual broods and averaged egg mass (n = 1395 bird species). Size of bars from inner to outer circles represent data on body mass, brain size, clutch size, annual broods and averaged egg mass, respectively; all data are log-transformed except for annual broods, wherein blank indicate missing values; different colored strips and branches indicate different orders of birds; phylogeny follows the bird tree project.
Data from multiple species are often non-independent for statistical analysis since data of closely related species tend to be similar because of their shared phylogenetic history (Felsenstein, 1985; Harvey and Pagel, 1991, Fig. 1). Phylogenetic signal (λ) should therefore be tested for each trait before analyses are conducted. The parameter λ was estimated using the maximum-likelihood method for each trait (λ varies from zero to one, where zero indicates no phylogenetic signal but one indicates strong phylogenetic signal) using the function phylosig in package phytools (Revell, 2012). We found strong phylogenetic signals for all traits examined in our study (λ = 0.992 for brain mass, λ = 0.986 for body mass, λ of other traits see Table 1). The λ of all these traits show strong phylogenetic signals and differed significantly from 0 with P-values < 0.001, indicating that our models require phylogenetic corrections.
Therefore, we applied the phylogenetic generalized least squares (PGLS) approach to control for non-independence of data. A series of models were constructed to investigate potential effects of different aspects of reproductive investment on brain size evolution. Variables were log transformed prior to being entered in models. Given that avian development mode influences various avian life histories (Roff, 2002), we firstly investigated whether each trait (brain size and basic egg-reproduction traits) differed according to development mode (precocial versus altricial), using PGLS models with each trait as a response variable, development mode as a predictor and controlling for the allometric effect of body mass (if necessary), separately. Then, in order to test for relationships between brain size and egg-production traits (including and integrating three aspects: clutch size, annual broods and egg mass; Table 1), we used brain size as the response variable, reproductive output traits as independent variables, and body mass as a covariate in five PGLS models as follows. We first tested whether brain size is associated with clutch size with the largest sample size (n = 1395 species). Secondly, we tested whether brain size is correlated with clutch mass (n = 537 species). Thirdly, we tested whether brain size is predicted by annual fecundity (n = 454 species). Fourthly, we tested whether brain size is associated with annual total egg mass (n = 435 species). In the last, as a complement to confirm the models' consistency, we conducted a further PGLS model to test the relationships among brain size and three egg traits (clutch size, egg mass and annual broods), with body mass as a covariate. These five progressive models allow us to test energy trade-offs between brain size and egg production from difference perspectives. Given large variation in developmental mode from precocial to altricial birds (Roff, 2002; Iwaniuk and Nelson, 2003), we additionally conducted the same models as mentioned above for each developmental mode separately to investigate whether the patterns are consistent between groups.
For all the PGLS models mentioned above, we applied a maximum likelihood estimation of Pagel's λ for phylogenetic dependence. PGLS models were constructed using function pgls in the caper package (Orme et al., 2013) in R software. We applied all the PGLS analyses through the MCCT tree. For each test, we reported the mean estimates and two-tailed significance values for each explanatory variable. All statistical analyses were performed with R software ver. 4.0 (R Core Team, 2021). Values were presented with mean ± SE and two-tailed significance set as 0.05 in this paper.
3.
Results
The complete dataset consisted of brain size, body mass and clutch size for 1395 avian species from 160 families of 34 orders (1063 altricial species and 332 precocial species; Appendix Table S1). Clutch size averaged 3.46 ± 2.01 eggs (range: 1–19.7, n = 1395 species), with 65.6% of species laying a clutch of 2–4 eggs. Development mode (precocial vs. altricial) was significantly associated with brain size (controlling for body mass: t = −25.594, P < 0.001; not controlling for body mass: t = 8.075, P < 0.001), clutch size (t = 12.897, P < 0.001), egg mass (controlling for body mass: t = 14.573, P < 0.001; not controlling for body mass: t = 19.123, P < 0.001) and annual broods (t = −5.815, P < 0.001), after controlling for phylogenetic relationships. Our results revealed that large variation in all the traits was explained by developmental mode.
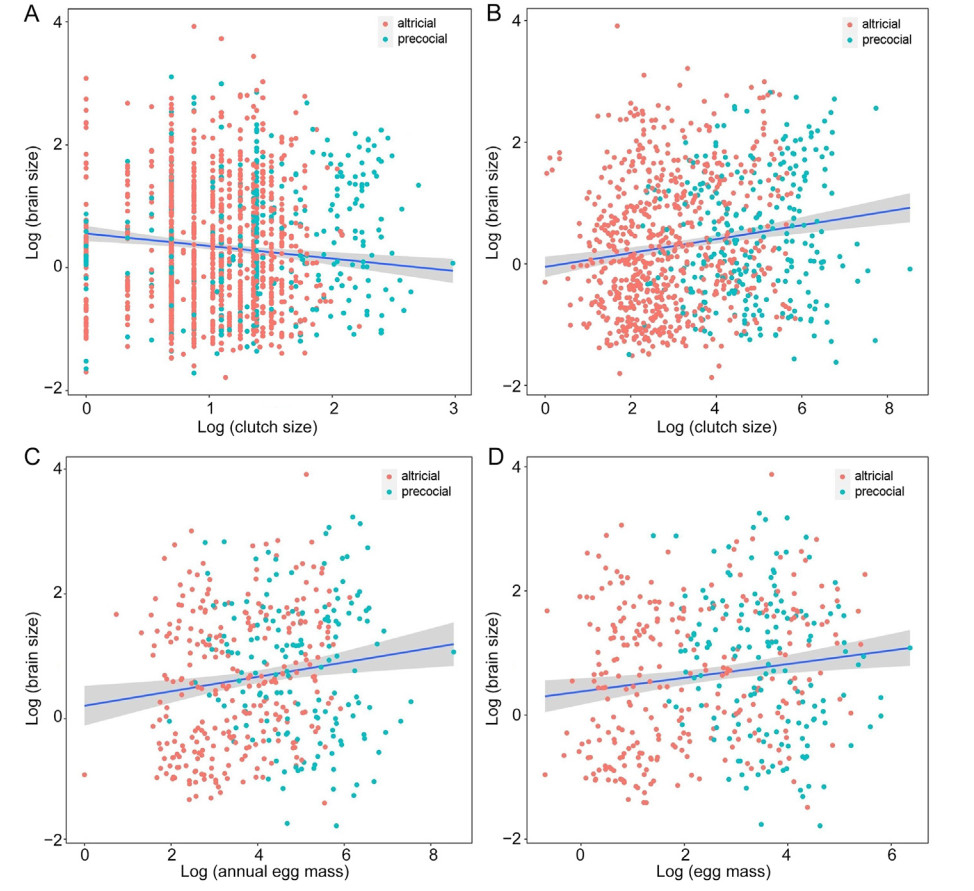
All PGLS models examining the relationship between brain size and egg production revealed that λ values differed significantly from 0, and the covariate of body mass was significant in each model (Table 2). From the perspective of clutch size, strong and significant negative relationships were found between brain size and clutch size, both across all species in the dataset, and within each of development modes tested separately, when controlling for the significant effect of body mass (Table 2; Fig. 2). At annual fecundity level, our results revealed a non-significant negative relationship between brain size and annual fecundity across all the species and within altricial species after controlling for the significant effect of body mass (Table 2; Fig. 2). In addition, the negative relationship was significant in precocial species (n = 256, t = −2.3, P = 0.02; Table 2). When egg mass was integrated into models for two other level (clutch mass and annual total egg mass), we found a positive and significant link between brain mass and clutch mass across all the species (n = 940, t = 4.201, P < 0.001) and within altricial birds (n = 648, t = 6.031, P < 0.001), but not in precocial species (n = 256, t = 1.084, P = 0.279) wherein the relationship was not significant though it was positive (Table 2). Similarly, for annual total egg mass, concordant patterns were detected both across all the species and within each development mode.
Table
2.
Results of PGLS models to detect whether brain size was predicted by traits of egg production across bird species.
Figure
2.
Regressions between brain size and clutch size (A), between brain size and clutch mass (B), between brain size and annual total egg mass (C) and between brain size and egg mass (D). Relationship between brain size and annual fecundity was not included due to its non-significant effect across total species; variables were log-transformed and slopes with 95% confidence interval were fitted by PGLS models.
As a complement to PGLS models above, we conducted a further PGLS model with a subset of data including all three basic aspects of reproductive traits (clutch size, annual broods and egg mass) as predictors, brain size as a response and body mass as a covariate. We found that egg mass was the only significant term while other two traits were not significant across all the species or within each group (Table 2). Egg mass was positively and significantly correlated with brain size while the effects of annual broods and clutch size were not significant, though their effects are negative and positive, respectively. In addition, brain size was significantly linked with development time (slope = 0.457, t = 18.56, P < 0.001) across all the species, when controlling for effect of body mass (slope = 0.491, t = 70.27, P < 0.001), and qualitatively equivalent results were yielded within each development mode.
4.
Discussion
In this study, we examined the relationship between brain size and egg production investment from different perspectives across 1395 avian species using phylogenetic comparative analyses after controlling the significant effect of body mass. Our results demonstrated a significantly negative relationship between brain size and reproductive investment, measured as clutch size, across bird species. However, such a relationship became non-significant when examining annual fecundity (clutch size times annual broods). Furthermore, the evolution of a larger brain is accompanied by an increase in egg production investment in terms of egg size, clutch mass and mass of annual total eggs produced. Overall, our results failed to support our prediction that energy trade-offs existed between the brain and egg production, except a negative relationship between brain size and clutch size which seems to favor the energy trade-off hypothesis. Therefore, our results revealed that brain size trades off against egg reproduction via certain traits (e.g., clutch size) but not all the traits, and thus provide mixed support for the ETH.
Generally, the results of total species are qualitative equivalent to that of altricial and precocial birds (e.g., clutch size, body mass and egg mass). However, in terms of annual fecundity, clutch mass and annual egg mass, the results of total species are only similar to that of altricial birds but not precocial birds. This is probably potential artefacts of small samples of precocial species (Table 2) that failed to detect significant effects or consistent patterns. Under these conditions, the results from models with total species tend to be more reliable because of much larger samples. A similar reasoning may be applied to explain why clutch size is significant when using 1395 species (1st model of Table 2), but not significant when using 435 species (2nd model of Table 2). Therefore, our conclusions tend to be drawn from results across all the species because larger samples theoretically lead to better results.
In this study, an inverse relationship between brain size and clutch size was observed. This relationship has been tested on fish and mammals in previous studies which also suggested that reduced clutch or litter sizes arise with larger brain sizes (Barrickman et al., 2008; Barton and Capellini, 2011; Kotrschal et al., 2014). For example, guppies artificially selected for larger brains produced fewer offspring (Kotrschal et al., 2014). In polytokous mammals, an increase in brain size leads to reduced litter size (Isler and van Schaik, 2009). In birds, however, investigations on the relationship between brain size and clutch size are rather absent, though a negative relationship is implied in some studies (Iwaniuk and Nelson, 2003; Jiménez-Ortega et al., 2020; Smeele et al., 2022), but not directly investigated. A study conducted by Isler and van Schaik (2006) found that brain size was not related to annual fecundity across 497 bird species, but also showed that this relationship is negative in precocial birds. This is similar to our results with respect to annual fecundity. Our results suggest a trade-off exists between brain size and reproductive investment via clutch size, which supports the ETH only at the clutch size level across bird species.
Our results demonstrated a positive relationship between brain size and egg mass across bird species. This is probably due to the widely described trade-off between egg mass and clutch size (or egg number) across or within species (Blackburn, 1991; Figuerola and Green, 2005; Jiménez-Ortega et al., 2020). Under this trade-off, a negative relationship between brain size and clutch size tends to contribute to a positive relationship between brain size and egg size as expected. Besides, a number of studies on both homeothermic and ectothermic vertebrates have shown that the energetic requirements of encephalization can be met through a change in energy allocation to egg/neonate size (Isler and van Schaik, 2009, 2014; Liao et al., 2016). For instance, species with larger brains produce larger neonates in mammals (Isler and van Schaik, 2009), and produce larger egg size in cichlids (Tsuboi et al., 2015), in anurans (Liao et al., 2016) and in birds (Jiménez-Ortega et al., 2020). Our findings of a positive association between egg mass and brain size in birds are congruent. Larger eggs contain more yolk and other energy reserves; those reserves can increase growth rate, starvation resistance, and overall survival (Roff, 2002; Li and Lu, 2012). It is becoming evident that large eggs are commonly found in species with relatively larger brains. Brain size evolution was consistently linked to egg size across different development modes (Table 2). Increasing egg mass therefore could be a general requirement of encephalization in vertebrates. Besides, a positive association between brain size and development time in our results suggest large-brained offspring develop more slowly and increased energy inputs are therefore needed for large brains to accommodate prolonged development time (Jiménez-Ortega et al., 2020).
Furthermore, our study revealed that the evolution of a larger brain is also accompanied by an increase in both clutch mass and annual total egg mass (Table 2). This contrasted with our prediction that energy trade-offs should exist between brain and egg production, and failed to support the ETH. The metabolic costs of large brains have to be met either by reducing energy allocation to other maintenance functions or by increasing the total energy budget (Isler and van Schaik, 2009; Minias and Podlaszczuk, 2017). Previous studies have shown that large brains are associated with higher maternal energy investment such as larger neonates and prolonged parental care in fish and mammals (Martin, 1996; Deaner et al., 2003; Barrickman et al., 2008; Isler and van Schaik, 2009; Barton and Capellini, 2011; Kotrschal et al., 2014; Gonzalez-Voyer et al., 2016). In birds, a comparative study also suggested large-brained species produced heavier clutches (Isler and van Schaik, 2006). Although the egg mass versus clutch size trade-off widely occurs (Blackburn, 1991; Figuerola and Green, 2005), the increase in egg mass outweighs the decrease in clutch size (or egg numbers). This could be the reason why brain size is negative correlated with clutch size but positively with clutch mass and annual total egg mass.
Two recent studies also investigated brain size and egg-production investment across bird species at several similar aspects (Griesser et al., 2023; Pan et al., 2023). Griesser et al. (2023) suggested larger brains are associated with smaller clutch size but heavier clutch mass alongside with longer parental provisioning period, which is consistent with our results. However, Pan et al. (2023) found that female birds with larger relative brain size show a significant reduction in clutch mass with notably smaller eggs. This is contrasting with our results and the current opinion of other studies which suggest that vertebrates with large brain typically produce larger eggs/neonates and heavier clutches, including birds and mammals (e.g., Deaner et al., 2003; Isler and van Schaik, 2006; Barrickman et al., 2008; Barton and Capellini, 2011; Jiménez-Ortega et al., 2020; Griesser et al., 2023). This is probably due to that authors used residuals/slopes of an allometric relationship between brain size and body size to represent relative brain size (Pan et al., 2023). The methods have been criticized as it can bias parameter estimates (Freckleton, 2002; Jiménez-Ortega et al., 2020; Smeele, 2022), especially when independent variables (e.g., clutch mass in Pan et al., 2023; probably using relative clutch mass is better) is strongly associated with body size. To our knowledge, clutch size may in part represent energy investment into egg production. Relative to clutch size or egg mass, clutch mass and annual total egg mass could be better proxies of total energy investment into egg production per year. Overall, it seems surprising that a positive association was found between brain size and egg production via both clutch mass and annual total egg mass across bird species. Our results suggest that larger-brained birds may afford a generally increased reproductive investment because of their presumed better ability to exploit more nutritious food resources through better cognitive abilities conferred by their larger brains. Two other non-mutually exclusive reasons may explain why negative associations are absent between brain mass and egg production with respect to clutch mass and total egg mass. First, allocation strategies may differ among functional organs. For instance, a comparative study found a trade-off between brain size and pectoral muscle mass rather than mass of other organs in birds (Isler and van Schaik, 2006). The authors argued that the proportionally high cost in flight ability (pectoral muscle mass) underlies this energetic trade-off in birds. Second, species of different clades may show larger variation in total energy budget than in energy allocation. If variation in the overall energy budget is larger than variation in energy allocation to egg production, two traits constrained by an energetic trade-off will not show a negative association (Houle, 1991; Agrawal et al., 2010). The energetic costs of one expensive organ may not necessarily directly affect another expensive organ but rather may distribute its effects on the investment in several other organs (Lemaître et al., 2009). All these reasons could explain a missing energetic trade-off between brains size and egg production investment.
It has been known that large difference exist in life history traits and relative brain size (Roff, 2002; Iwaniuk and Nelson, 2003; Griesser et al., 2023) between development mode. Though similar patterns were reached in some aspects (e.g., clutch size, body mass and egg mass) for two development mode, several inconsistent results were also found in other aspects, such as annual fecundity, clutch mass and annual total egg mass between development mode. This difference could be attributed to small samples of precocial species on egg-production traits: annual total egg mass (n = 156 species), clutch mass (n = 256 species) and annual fecundity (n = 164 species; Table 2). Despite of this, the results could also be confounded by complex syndrome via sociality, migration status, diet, latitude/altitude and insularity (Jiménez-Ortega et al., 2020; Sayol et al., 2018; Smeele et al., 2022; Griesser et al., 2023), which needs further investigations.
5.
Conclusion
In this study, we integrated three egg-production traits and conducted phylogenetic comparative tests of the interplay between egg-production investment and brain size evolution across bird species. After controlling for phylogenetic relationships and body size, our results revealed that no general patterns existed on energy trade-off between brain size and egg-reproduction investment, and suggest that brain size evolution follows mixed strategies across bird species. Brain and clutch size data were compiled and analyzed for 1395 species, accounting for about 13% of the total avian species of the world. However, when annual broods and egg mass were included in dataset, samples decreased to 471 species (only ca. 5% of the total avian species of the world). Though new studies reporting avian egg size are steadily published each year, brain size of avian species are rarely measured and reported. Some clades in birds still have unknown brain or egg size (e.g., pelagic species and extremely high-altitudes species; Zhao et al., 2023). Future studies should explore the relationship between brain size and egg-production traits at an intraspecific level (e.g., female-specific brain size or integrated brain size of both sexes) or at a broader interspecific level (with more precocial species) in comparative analyses.
Authors' contribution
SL conceived the idea. SL, XL and GL extracted the data. SL and XD made the comparative analyses. SL, GL and XD wrote the paper. All authors read and approved the final manuscript.
Ethics statement
Not applicable. All the data were collated from published studies.
The authors declare that they have no known competing financial interests or personal relationships that could have appeared to influence the work reported in this paper.
Acknowledgements
We thank Hao Gao, Dongfang Fang and Zhenhao Liu for their assistances in data compilation, and Dr. Karin Isler for the supplementary data in her paper. We also appreciate the improvements in English usage made by Dr. Becky Cramer.
Agrawal, A.A., Conner, J.K., Rasmann, S., 2010. Tradeoffs and negative correlations in evolutionary ecology. In: Bell, M.A., Futuyma, D.J., Eanes, W.F., Levinton, J.S. (Eds.), Evolution Since Darwin: the First 150 Years. Sinauer, Sunderland MA, pp. 243–268.
Aiello, L.C., Wheeler, P., 1995. The expensive-tissue hypothesis: the brain and the digestive system in human and primate evolution. Curr. Anthropol. 36, 199–221.
Allman, J., 2000. Evolving Brains. Scientific American Library, New York.
Barrickman, N.L., Bastian, M.L., Isler, K., van Schaik, C.P., 2008. Life history costs and benefits of encephalization: a comparative test using data from long-term studies of primates in the wild. J. Hum. Evol. 54, 568–590.
Barton, R.A., Capellini, I., 2011. Maternal investment, life histories, and the costs of brain growth in mammals. Proc. Natl. Acad. Sci. U.S.A. 108, 6169–6174.
Blackburn, T.M., 1991. An interspecific relationship between egg size and clutch size in birds. Auk 108, 973–977.
Chen, M., Li, G., Liu, J., Li, S., 2021. Large brain size is associated with low extra-pair paternity across bird species. Ecol. Evol. 11, 13601–13608.
Deaner, R.O., Barton, R.A., van Schaik, C.P., 2003. Primate brains and life histories: renewing the connection. In: Kappeler, P.M., Pereira, M.E. (Eds.), Primate Life Histories and Socioecology. The University of Chicago Press, Chicago, pp. 233–265.
del Hoyo, J., Elliott, A., Sargatal, J., 1992–2011. Handbook of the Birds of the World, vols. 1–16. Lynx Edicions, Barcelona Spain.
Felsenstein, J., 1985. Phylogenies and the comparative method. Am. Nat. 125, 1–15.
Figuerola, J., Green, A.J., 2005. A comparative study of egg mass and clutch size in the Anseriformes. J. Ornithol. 147, 57–68.
Freckleton, R.P., 2002. On the misuse of residuals in ecology: regression of residuals vs. multiple regression. J. Anim. Ecol. 71, 542–545.
Garamszegi, L.Z., Eens, M., Erritzøe, J., Møller, A.P., 2005. Sperm competition and sexually size dimorphic brains in birds. Proc. R. Soc. A B 272, 159–166.
Gonzalez-Voyer, A., González-Suárez, M., Vilà, C., Revilla, E., 2016. Larger brain size indirectly increases vulnerability to extinction in mammals. Evolution 70, 1364–1375.
Griesser, M., Drobniak, S.M., Graber, S.M., van Schaik, C.P., 2023. Parental provisioning drives brain size in birds. Proc. Natl. Acad. Sci. U.S.A. 120, e2121467120.
Hackett, S.J., Kimball, R.T., Reddy, S., Bowie, R.C.K., Braun, E.L., 2008. A phylogenomic study of birds reveals their evolutionary history. Science 320, 1763–1768.
Harvey, P.H., Pagel, M.D., 1991. The Comparative Method in Evolutionary Biology. Oxford University Press, Oxford.
Houle, D., 1991. Genetic covariance of fitness correlates: what genetic correlations are made of and why it matters. Evolution 45, 630–648.
Isler, K., van Schaik, C., 2006. Costs of encephalization: the energy trade-off hypothesis tested on birds. J. Hum. Evol. 51, 228–243.
Isler, K., van Schaik, C., 2014. How human evolved larger brains: comparative evidence. Evol. Anthropol. 23, 65–75.
Isler, K., van Schaik, C., 2009. The expensive brain: a framework for explaining evolutionary changes in brain size. J. Hum. Evol. 57, 392–400.
Iwaniuk, A.N., Nelson, J.E., 2003. Developmental differences are correlated with relative brain size in birds: a comparative analysis. Can. J. Zool. 81, 1913–1928.
Jetz, W., Sekercioglu, C.H., Bö hning-Gaese, K., 2008. The worldwide variation in avian clutch size across species and space. PLoS Biol. 6, e303.
Jetz, W., Thomas, G.H., Joy, J.B., Hartmann, K., Mooers, A.O., 2012. The global diversity of birds in space and time. Nature 491, 444–448.
Jiménez-Ortega, D., Kolm, N., Immler, S., Maklakov, A.A., GonzalezVoyer, A., 2020. Long life evolves in large brained bird lineages. Evolution 74, 2617–2628.
Karasov, W.H., Pinshow, B., Starck, J.M., Afik, D., 2004. Anatomical and histological changes in alimentary tract of migrating blackcaps (Sylvia atricapilla): a comparison among fed, fasted, food-restricted, and refed birds. Physiol. Biochem. Zool. 77, 48–54.
Kotrschal, A., Corral-Lopez, A., Amcoff, M., Kolm, N., 2014. A larger brain confers a benefit in a spatial mate search learning task in male guppies. Behav. Ecol. 26, 527–532.
Lemaître, J.F., Ramm, S.A., Barton, R.A., Stockley, P., 2009. Sperm competition and brain size evolution in mammals. J. Evol. Biol. 22, 2215–2221.
Li, S., Gao, H., Liu, J., Li, C., Li, G., Li, D., 2022. Life history variation between two Eurasian tree sparrow Passer montanus populations at different altitudes. Anim. Biol. Leiden 72, 1–10.
Li, S., Lu, X., 2012. Breeding biology of Rock Sparrows Petronia petronia in the Tibetan plateau, with special reference to life history variation across altitudes. Acta Ornithol. 47, 19–25.
Liao, W.B., Jiang, Y., Li, D.Y., Jin, L., Zhong, M.J., Qi, Y., et al., 2022. Cognition contra camouflage: how the brain mediates predator-driven crypsis evolution. Sci. Adv. 8, eabq1878.
Liao, W.B., Lou, S.L., Zeng, Y., Kotrschal, A., 2016. Large brains, small guts: the expensive tissue hypothesis supported in anurans. Am. Nat. 188, 693–700.
Lislevand, T., Figuerola, J., Székely, T., 2007. Avian body sizes in relation to fecundity, mating system, display behavior, and resource sharing. Ecology 88, 1605.
Martin, R., 1981. Relative brain size and basal metabolic rate in terrestrial vertebrates. Nature 293, 57–60.
Martin, R.D., 1996. Scaling of the mammalian brain: the maternal energy hypothesis. News Physiol. Sci. 11, 149–156.
Minias, P., Podlaszczuk, P., 2017. Longevity is associated with relative brain size in birds. Ecol. Evol. 7, 3558–3566.
Mink, J.W., Blumenschine, R.J., Adams, D.B., 1981. Ratio of central nervous system to body metabolism in vertebrates: its constancy and functional basis. Am. J. Physiol. 241, 203–212.
Niven, J.E., Laughlin, S.B., 2008. Energy limitation as a selective pressure on the evolution of sensory systems. J. Exp. Biol. 211, 1792–1804.
Orme, D., Freckleton, R.P., Thomas, G.H., Petzoldt, T., Fritz, S., Isaac, N., et al., 2013. Caper: comparative analyses of phylogenetics and evolution in R. .
Pan, S.K., Wang, D.P., Zhang, X.H., Zhan, X.J., 2023. Smarter birds, smaller eggs, and less parental care time. Zool. Res. 44, 98–100.
Pitnick, S., Jones, K.E., Wilkinson, G.S., 2006. Mating systems and brain size in bats. Proc. R. Soc. A B 273, 719–724.
R Core Team, 2021. A Language and Environment for Statistical Computing. R Foundation for Statistical Computing. .
Revell, L.J., 2012. Phytools: an R package for phylogenetic comparative biology (and other things). Methods Ecol. Evol. 3, 217–223.
Roff, D.A., 2002. Life History Evolution. Sinauer, Sunderland MA.
Sayol, F., Downing, P.A., Iwaniuk, A.N., Maspons, J., Sol, D., 2018. Predictable evolution towards larger brains in birds colonizing oceanic islands. Nat. Commun. 9, 2820.
Sayol, F., Maspons, J., Lapiedra, O., Iwaniuk, A.N., Székely, T., Sol, D., 2016. Environmental variation and the evolution of large brains in birds. Nat. Commun. 7, 13971.
Schliep, K.P., 2011. phangorn: phylogenetic analysis in R. Bioinformatics 27, 592–593.
Smeele, S.Q., Conde, D.A., Baudisch, A., Bruslund, S., Iwaniuk, A., Staerk, J., et al., 2022. Coevolution of relative brain size and life expectancy in parrots. Proc. R. Soc. A B 289, 20212397.
Smeele, S.Q., 2022. Using relative brain size as predictor variable: Serious pitfalls and solutions. Ecol. Evol. 12, e9273.
Sol, D., 2009. Revisiting the cognitive buffer hypothesis for the evolution of large brains. Biol. Lett. 5, 130–133.
Striedter, G.F., 2005. Principles of Brain Evolution. Sinauer, Sunderland, MA.
Tacutu, R., Craig, T., Budovsky, A., Wuttke, D., Lehmann, G., Taranukha, D., et al., 2013. Human ageing genomic resources: integrated databases and tools for the biology and genetics of ageing. Nucleic Acids Res. 41, 1027–1033.
Timmermans, S., Lefebvre, L., Boire, D., Basu, P., 2000. Relative size of the hyperstriatum ventrale is the best predictor of feeding innovation rate in birds. Brain Behav. Evol. 56, 196–203.
Tsuboi, M., Husby, A., Kotrschal, A., Hayward, A., Buechel, S.D., Zidar, J., et al., 2005. Comparative support for the expensive tissue hypothesis: big brains are correlated with smaller gut and greater parental investment in Lake Tanganyika cichlids. Evolution 69, 190–200.
Zhao, X., Che, X., Ning, T., Zou, F., 2023. Distribution of birds in the high-altitude area of Mount Everest. Integr. Zool. 18, 199–204.

 DownLoad:


 Email Alerts
 RSS Feeds