Key Laboratory of Bio-Resources and Eco-Environment, Ministry of Education, College of Life Sciences, Sichuan University, Chengdu, 610065, China
Funds: This study was financially supported by the National Natural Science Foundation of China (No. 32270454) and the Second Tibetan Plateau Scientific Expedition and Research Program (No. 2019QZKK0501). The funding sources had no influence on the study
Many bird species in montane regions exhibit altitudinal migration behavior; however, altitudinal migration of birds is still understudied, especially in Asia. Mt. Gongga (7556 m) is the highest peak of the Hengduan Mountains in Southwest China. The steep elevation gradient and the high bird diversity make the eastern slope of Mt. Gongga (Hailuo Valley) an ideal place for studying the altitudinal migration behavior patterns of birds. We synchronously recorded the local bird diversity, temperature and humidity at two sites (1800 and 3000 m a.s.l.) during three migration seasons from September 2020 to June 2021 to identify birds exhibiting altitudinal migration behavior. During our surveys, we recorded 146 bird species in total and 20 passerine bird species were altitudinal migrants according to our altitudinal migration formula. Among those 20 altitudinal migrant species, eight bird species displayed a typical altitudinal migration pattern (upward migration during the breeding season and downward migration during the non-breeding season). Moreover, temperature was correlated with the daily number of individuals (DNI) at each study site. Therefore, increasing temperatures possibly caused upward migration of birds (DNI decreased at 1800 m and increased at 3000 m) and vice versa. To further elaborate, the Rufous-gorgeted Flycatcher (Ficedula strophiata), the species with the most prominent altitudinal migration behavior, initiated upward migration at a temperature of 11–12 ℃ at 1800 m and initiated downward migration at a temperature of 12–13 ℃ at 3000 m. Besides, humidity was positively correlated with the DNI. Therefore, increasing humidity (equals to increasing rainfall or snow) possibly caused downward migration of birds (DNI increased) and vice versa. Furthermore, bird species exhibiting a typical altitudinal migration behavior pattern are feeding on insects. Thus, the spatial and temporal changes of the invertebrate biomass might be an important ecological driver for the altitudinal migration of invertivorous (birds eating invertebrates) birds. This study provides fundamental data for the altitudinal migration of birds in the Hengduan Mountains and shows how altitudinal migration is seasonally dynamic across an elevational gradient in a subtropical mountain region.
Birds migrate in two ways, one is horizontal migration between latitude gradients, and the other is vertical migration (altitudinal migration) between elevation gradients (Dingle and Drake, 2007; Rappole, 2013). Altitudinal migrants migrate to high elevations during the breeding season to breed and then migrate to low elevations during the non-breeding season to overwinter due to changing environmental factors (Chaves-Campos, 2004; Borras et al., 2010; Hsiung et al., 2018; Tsai et al., 2021). Environmental factors, such as meteorological factors and food availability, change rapidly along an elevational gradient, much faster than along the latitude gradient (Körner, 2007; Jones et al., 2014; Pratt et al., 2017), which causes different migration patterns of birds compared to latitudinal migration (Rappole, 2013). Recent studies have shown that temperature and humidity have considerable explanatory power for the altitudinal migration of birds. Climate factors limit a species’ elevational distribution due to each species’ physiological tolerances (McCain, 2009; Wu et al., 2013; He et al., 2019). However, birds may not always conduct altitudinal migration. They might migrate latitudinally instead when temperatures are especially low (Henry, 2011; Resano-Mayor et al., 2020). Furthermore, altitudinal migration may also depend on the sex and age of the bird (Polakowski et al., 2008; Lehikoinen et al., 2011). Moreover, as altitudinal migration among invertivorous bird species is most common (except for the Neotropics) (Barçante et al., 2017), spatial and temporal changes of the invertebrate biomass might also be an important ecological driver for explaining the altitudinal migration of birds (Gutiérrez and Wilson, 2014; Supriya et al., 2019; Araújo et al., 2022).
To further study this phenomenon, we studied the altitudinal migration behavior patterns and factors which influence the altitudinal migration of birds in the Hengduan Mountains in southwest China. So far, our research is one of the first studies studying the altitudinal migration behavior patterns of birds in the Hengduan Mountains. This mountain range is one of the world’s 36 biodiversity hotspots (Habel et al., 2019) with high bird species diversity and endemism (Wu et al., 2013; 2017a). Altitudinal migration in the Hengduan Mountains is very common among birds because of the large elevation gradient (more than 6000 m) (Zhong, 1999; Cheng and Luo, 2004). Therefore, this mountain range is very suitable for studying altitudinal migration.
In this paper, we analyzed our bird data which were collected on the eastern slope of Mt. Gongga (Hailuo Valley) in the Hengduan Mountains, China to explore: (1) the bird diversity and the community composition change in this area; (2) which bird species exhibit altitudinal migration behavior; (3) the relationship between altitudinal migration behavior with temperature, humidity and the feeding habits of birds.
2.
Methods
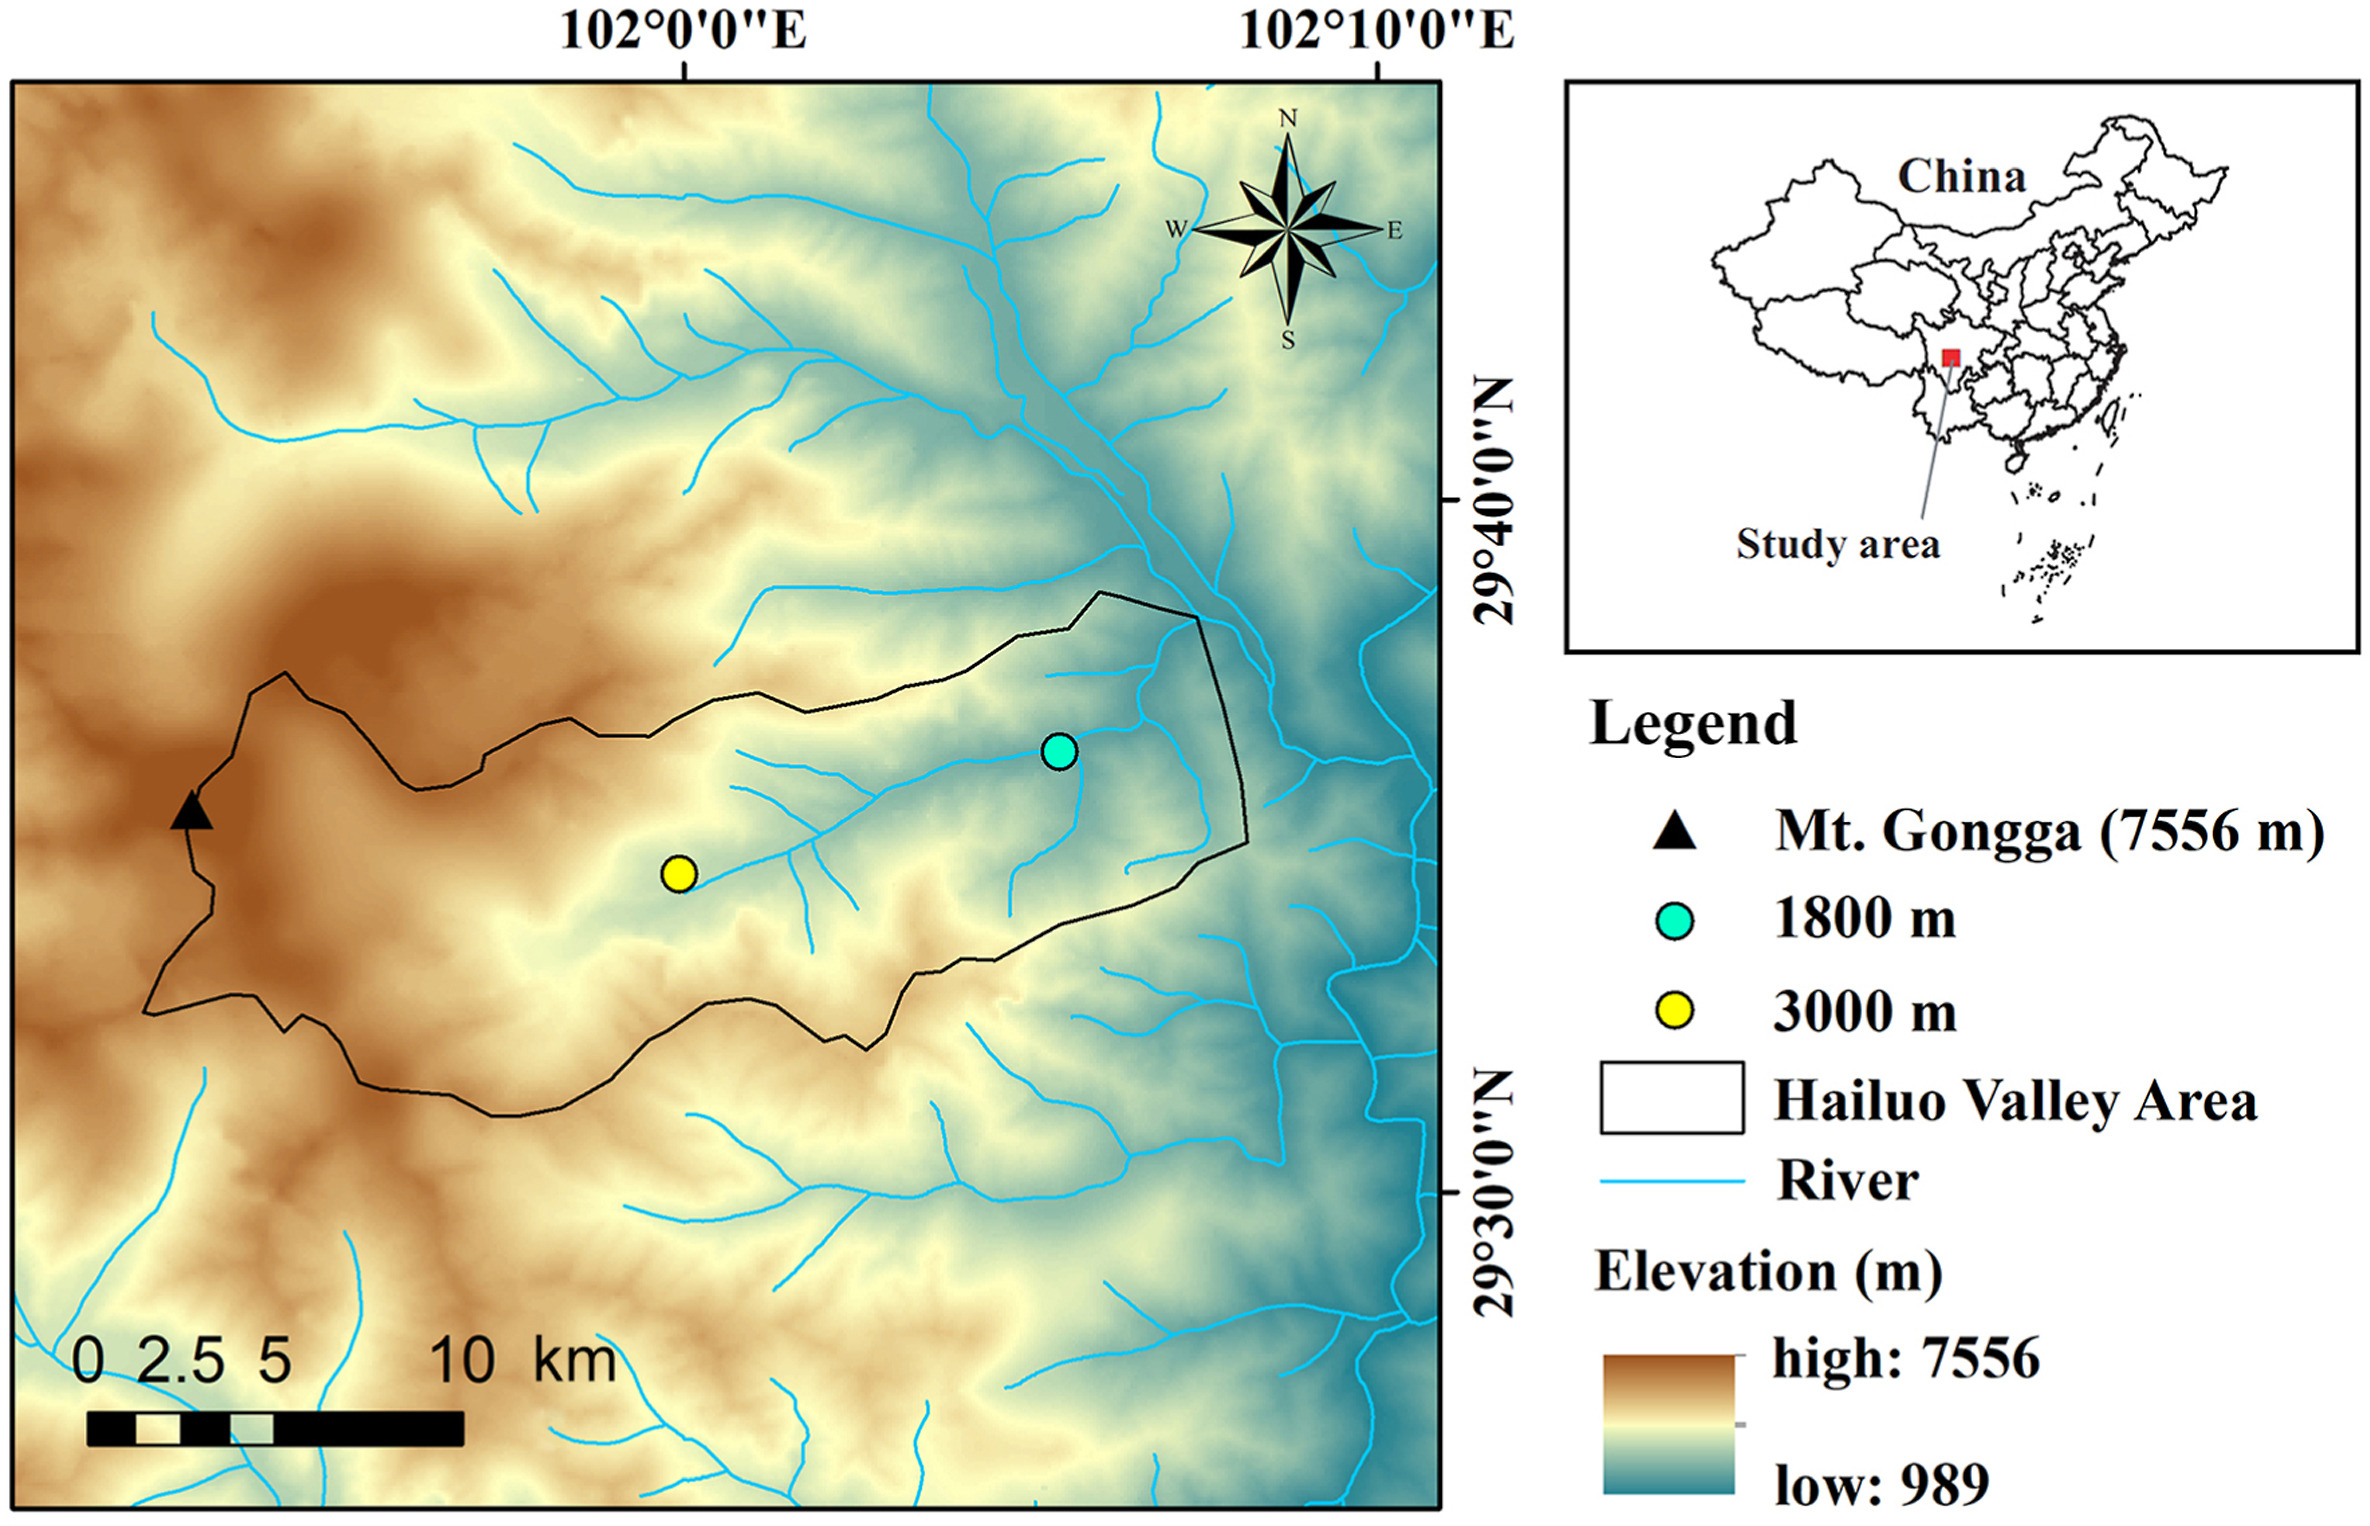
Mt. Gongga (7556 m) is located in the transition zone between the Sichuan Basin and the Qinghai-Tibet Plateau (29°20ʹ–30°39ʹ N, 101°30ʹ–102°12ʹ E; Fig. 1). It is the highest peak of the Hengduan Mountains.
Figure
1.
Map of the study area showing the location of the Hailuo Valley and the two study sites at 1800 and 3000 m.
We conducted research in Hailuo Valley at two study sites (1800 m and 3000 m a.s.l.) at the same time with two research groups (Fig. 1). Two researchers per study site (four researchers in total) conducted the experiments at the same time. The survey area was about 14 ha in size for each of the study sites. We selected these two elevations because the bird diversity in Hailuo Valley between 1800 and 3000 m is highest, with peak bird diversity at 2200 m (He et al., 2019, 2022). Bird species in this system migrate between 300 and over 4000 m in elevation, but this varies greatly from species to species (Appendix Table S1). Based on our long-term studies in Hailuo Valley, resident birds are rather isolated there and tend to remain in this valley. Birds would only migrate vertically in Hailuo Valley, because this valley is surrounded by high mountains. The mountains are at least 1500 m higher than the valley bottom (Fig. 1). Therefore, horizontal migration, especially for small-sized birds is unlikely. We furthermore assumed that summer visitors would migrate to other regions to overwinter.
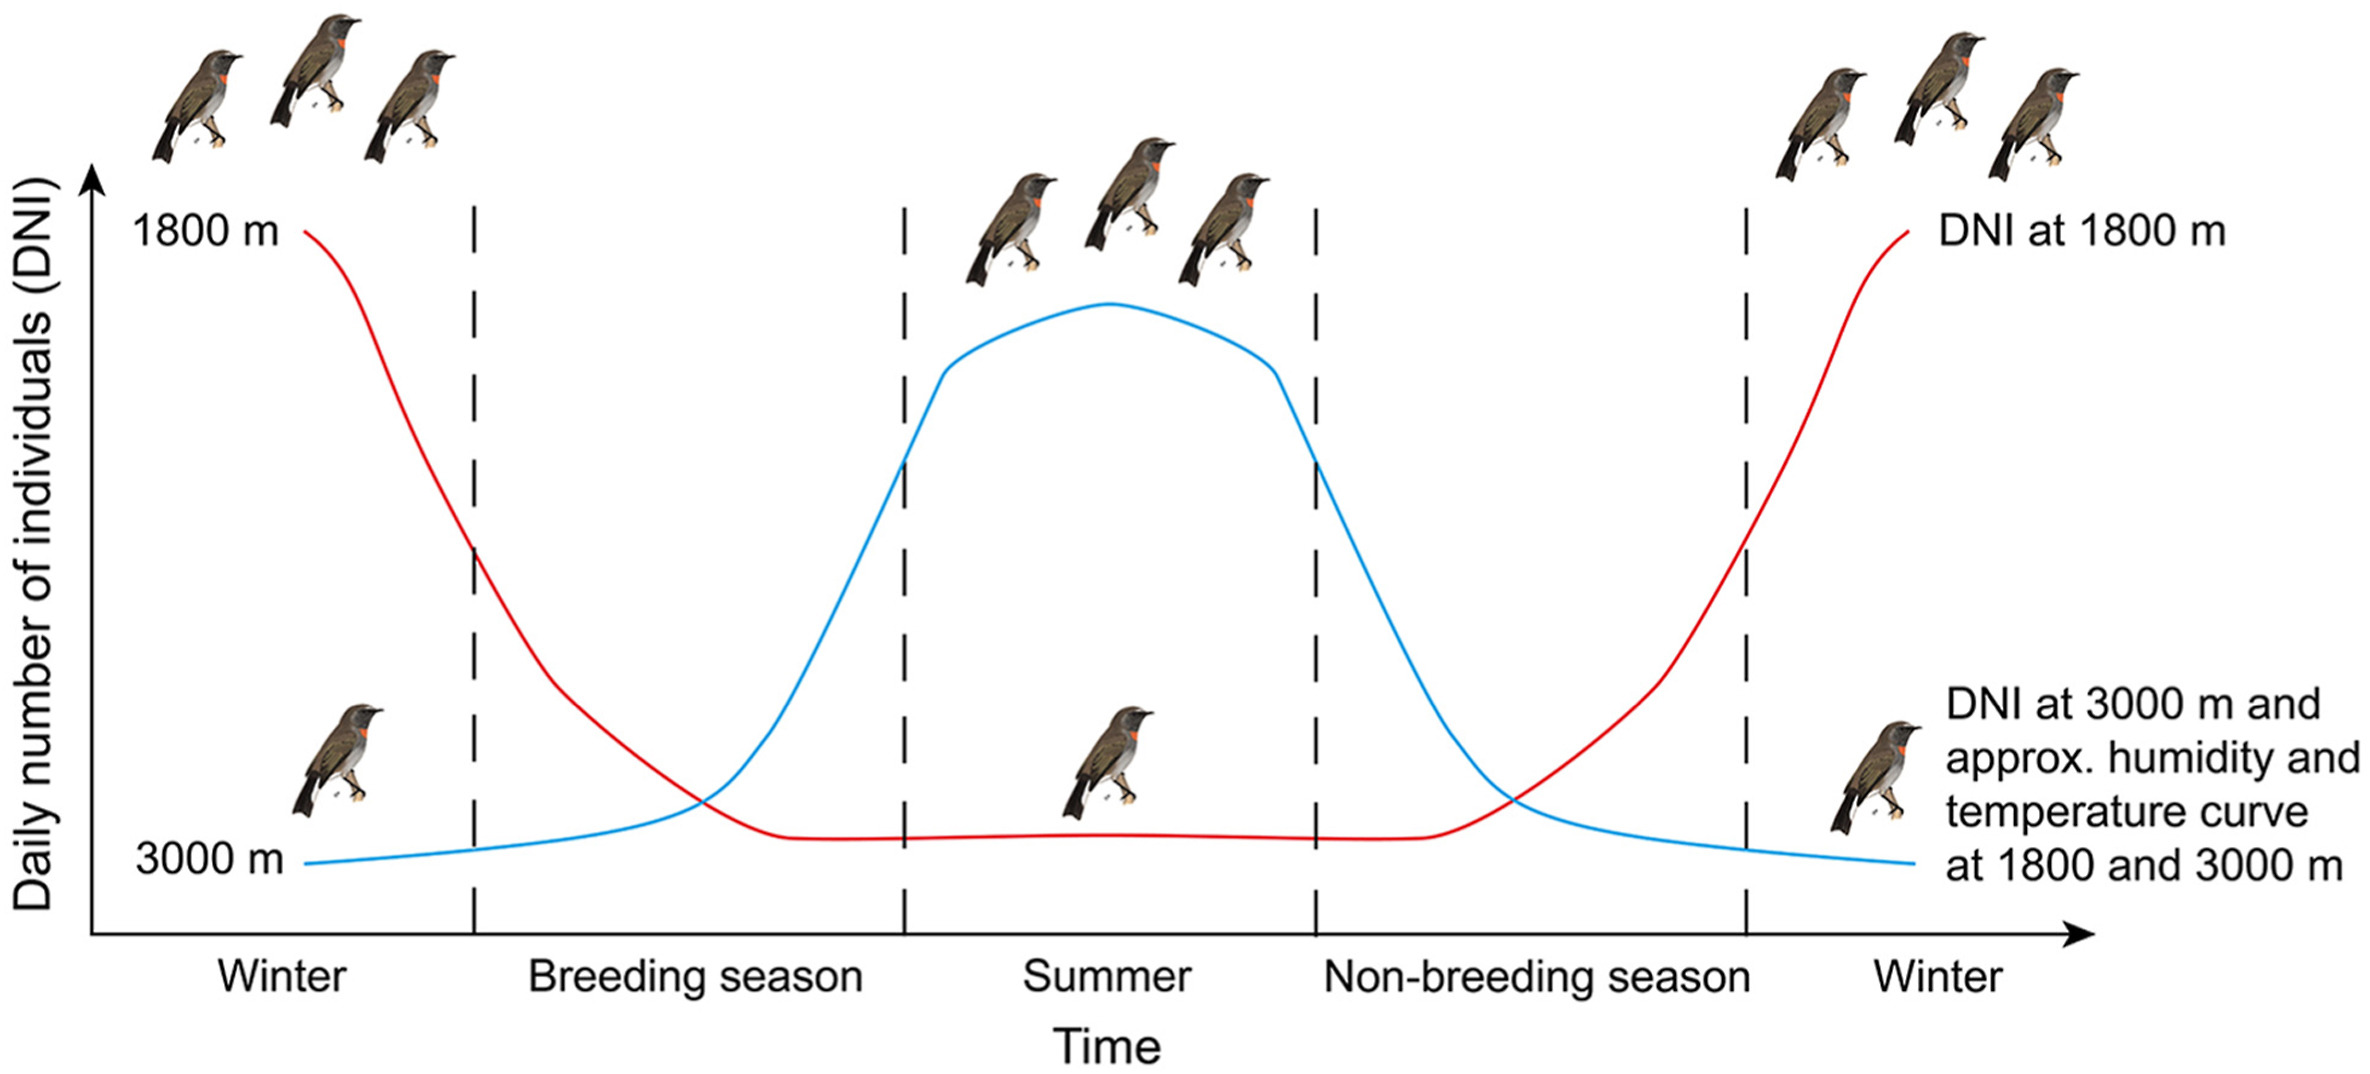
We defined the breeding season for birds from March to June and the non-breeding season from September to November based on our long-term studies in this area (Wu et al., 2017b; He et al., 2019, 2022). We expected some bird species to migrate from 1800 m to 3000 m during the breeding season due to increasing temperature and food availability, breed there and then migrate down to 1800 m again during the non-breeding season due to decreasing temperature and food availability (Fig. 2; Chaves-Campos, 2004; Boyle, 2017). In total, data of one breeding season and two non-breeding seasons were collected.
Figure
2.
Typical altitudinal migration behavior pattern of birds during the breeding and non-breeding season. Red line shows the daily number of individuals (DNI) at 1800 m. Blue line shows the DNI at 3000 m and a hypothetical humidity and temperature curve at 1800 and 3000 m. (For interpretation of the references to color in this figure legend, the reader is referred to the Web version of this article.)
We used mist net surveys and the point count method to make our surveys as detailed as possible. From September to November 2020, from March to June 2021 and from September to November 2021, birds at both study sites were caught using mist nets. Bird surveys could not be conducted in spring 2020 due to the global COVID-19 outbreak. Two types of mist nets were used: 15 m long × 4 m high and 12 m long × 4 m high mist nets. The hole size of the mist nets was 1.5 cm × 1.5 cm. Twelve to fifteen mist nets were installed at both study sites during each survey period. The capture of birds was authorized by the Gongga Mountain National Nature Reserve. The distance between each mist net was approximately 50 m. Mist net surveys were conducted from 7:30 a.m. to 5:30 p.m. The mist nets were checked for captured birds at least every hour to avoid injury or death of the captured birds. Captured birds were banded with a colored plastic ring on the right foot and then released. The species name, sex, capture date, time, ring color and the ring’s serial number were recorded.
Furthermore, the point count method was used to increase the number of observed bird individuals as a supplemental measure. Many bird species (especially medium to large bird species) are very difficult to catch using mist nets, because they fly much higher than the installed nets (Remsen Jr. and Good, 1996). Birds were recorded using direct sighting or bird song next to the mist nets. Birds were recorded for 1 h after sunrise (8:00 a.m. to 9:00 a.m.) and for 1 h before sunset (4:30 p.m. to 5:30 p.m.). We stayed at one mist net for 20 min and then moved on to another mist net. The species name, number of individuals, sex, date and time were recorded.
The data of the mist net and the point count surveys were then analyzed. By comparing the difference of the number of caught and observed bird individuals at 1800 and 3000 m during the breeding and non-breeding season (Fig. 2), we can indirectly conclude which bird species exhibit altitudinal migration behavior (Chaves-Campos, 2004; Merkord, 2010; Boyle, 2017).
We developed a new equation to calculate the altitudinal migration intensity of birds (Eq. (1)), to determine which species exhibit altitudinal migration and which species do not. First, the bird species (n = 40) which were recorded at both elevations during 2021 were selected. Considering the number of survey hours being different for each study site and season, Eq. (1) was used to standardize the number of individuals for each study site and season. If the altitudinal migration intensity of a particular species was greater than one, then that bird species was labeled as being an altitudinal migrant. If the altitudinal migration intensity of a particular species was smaller than one, then that bird species was labeled as being no altitudinal migrant. A theoretical altitudinal migration intensity of zero was omitted in the analysis.
A=|B×100C−D×100E|+|F×100G−H×100I|
(1)
where A refers to the altitudinal migration intensity, B is the number of individuals per species during the non-breeding season at 3000 m, C the number of survey hours during the non-breeding season at 3000 m, D the number of individuals per species during the breeding season at 3000 m, E the number of survey hours during the breeding season at 3000 m, F the number of individuals per species during the non-breeding season at 1800 m, G the number of survey hours during the non-breeding season at 1800 m, H the number of individuals per species during the breeding season at 1800 m, and I the number of survey hours during the breeding season at 1800 m.
In order to further analyze the relationship between the altitudinal migration behavior of birds in Hailuo Valley and the meteorological factors (temperature and humidity) of the two study sites, a COS-04-X automatic temperature and humidity recorder was installed at each study site in a shaded and dry place. Temperature and humidity were automatically recorded every 30 min. The highest daily temperature (HDT), average daily temperature (ADT), lowest daily temperature (LDT), daily temperature range (DTR), highest daily humidity (HDH), average daily humidity (ADH), lowest daily humidity (LDH) and daily humidity range (DHR) were calculated in Excel. Then, the Pearson correlation coefficient and the ordinary least squares (OLS) regression were calculated to examine the relationships between the daily number of individuals (DNI) and each meteorological factor. Moreover, a Poisson regression with best model selection was used to compare the relationship between the DNI and all meteorological factors combined. All statistical analysis was performed in R 4.3.0.
3.1
Bird diversity and community composition change
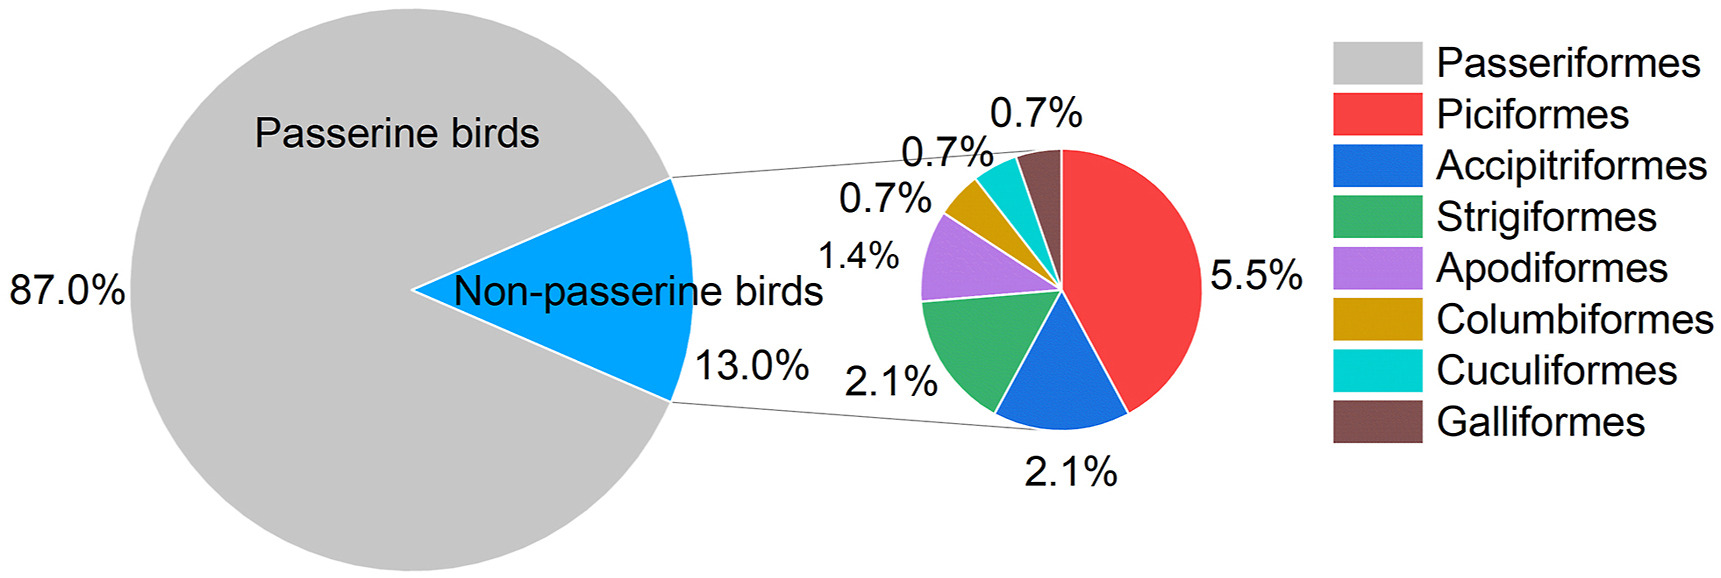
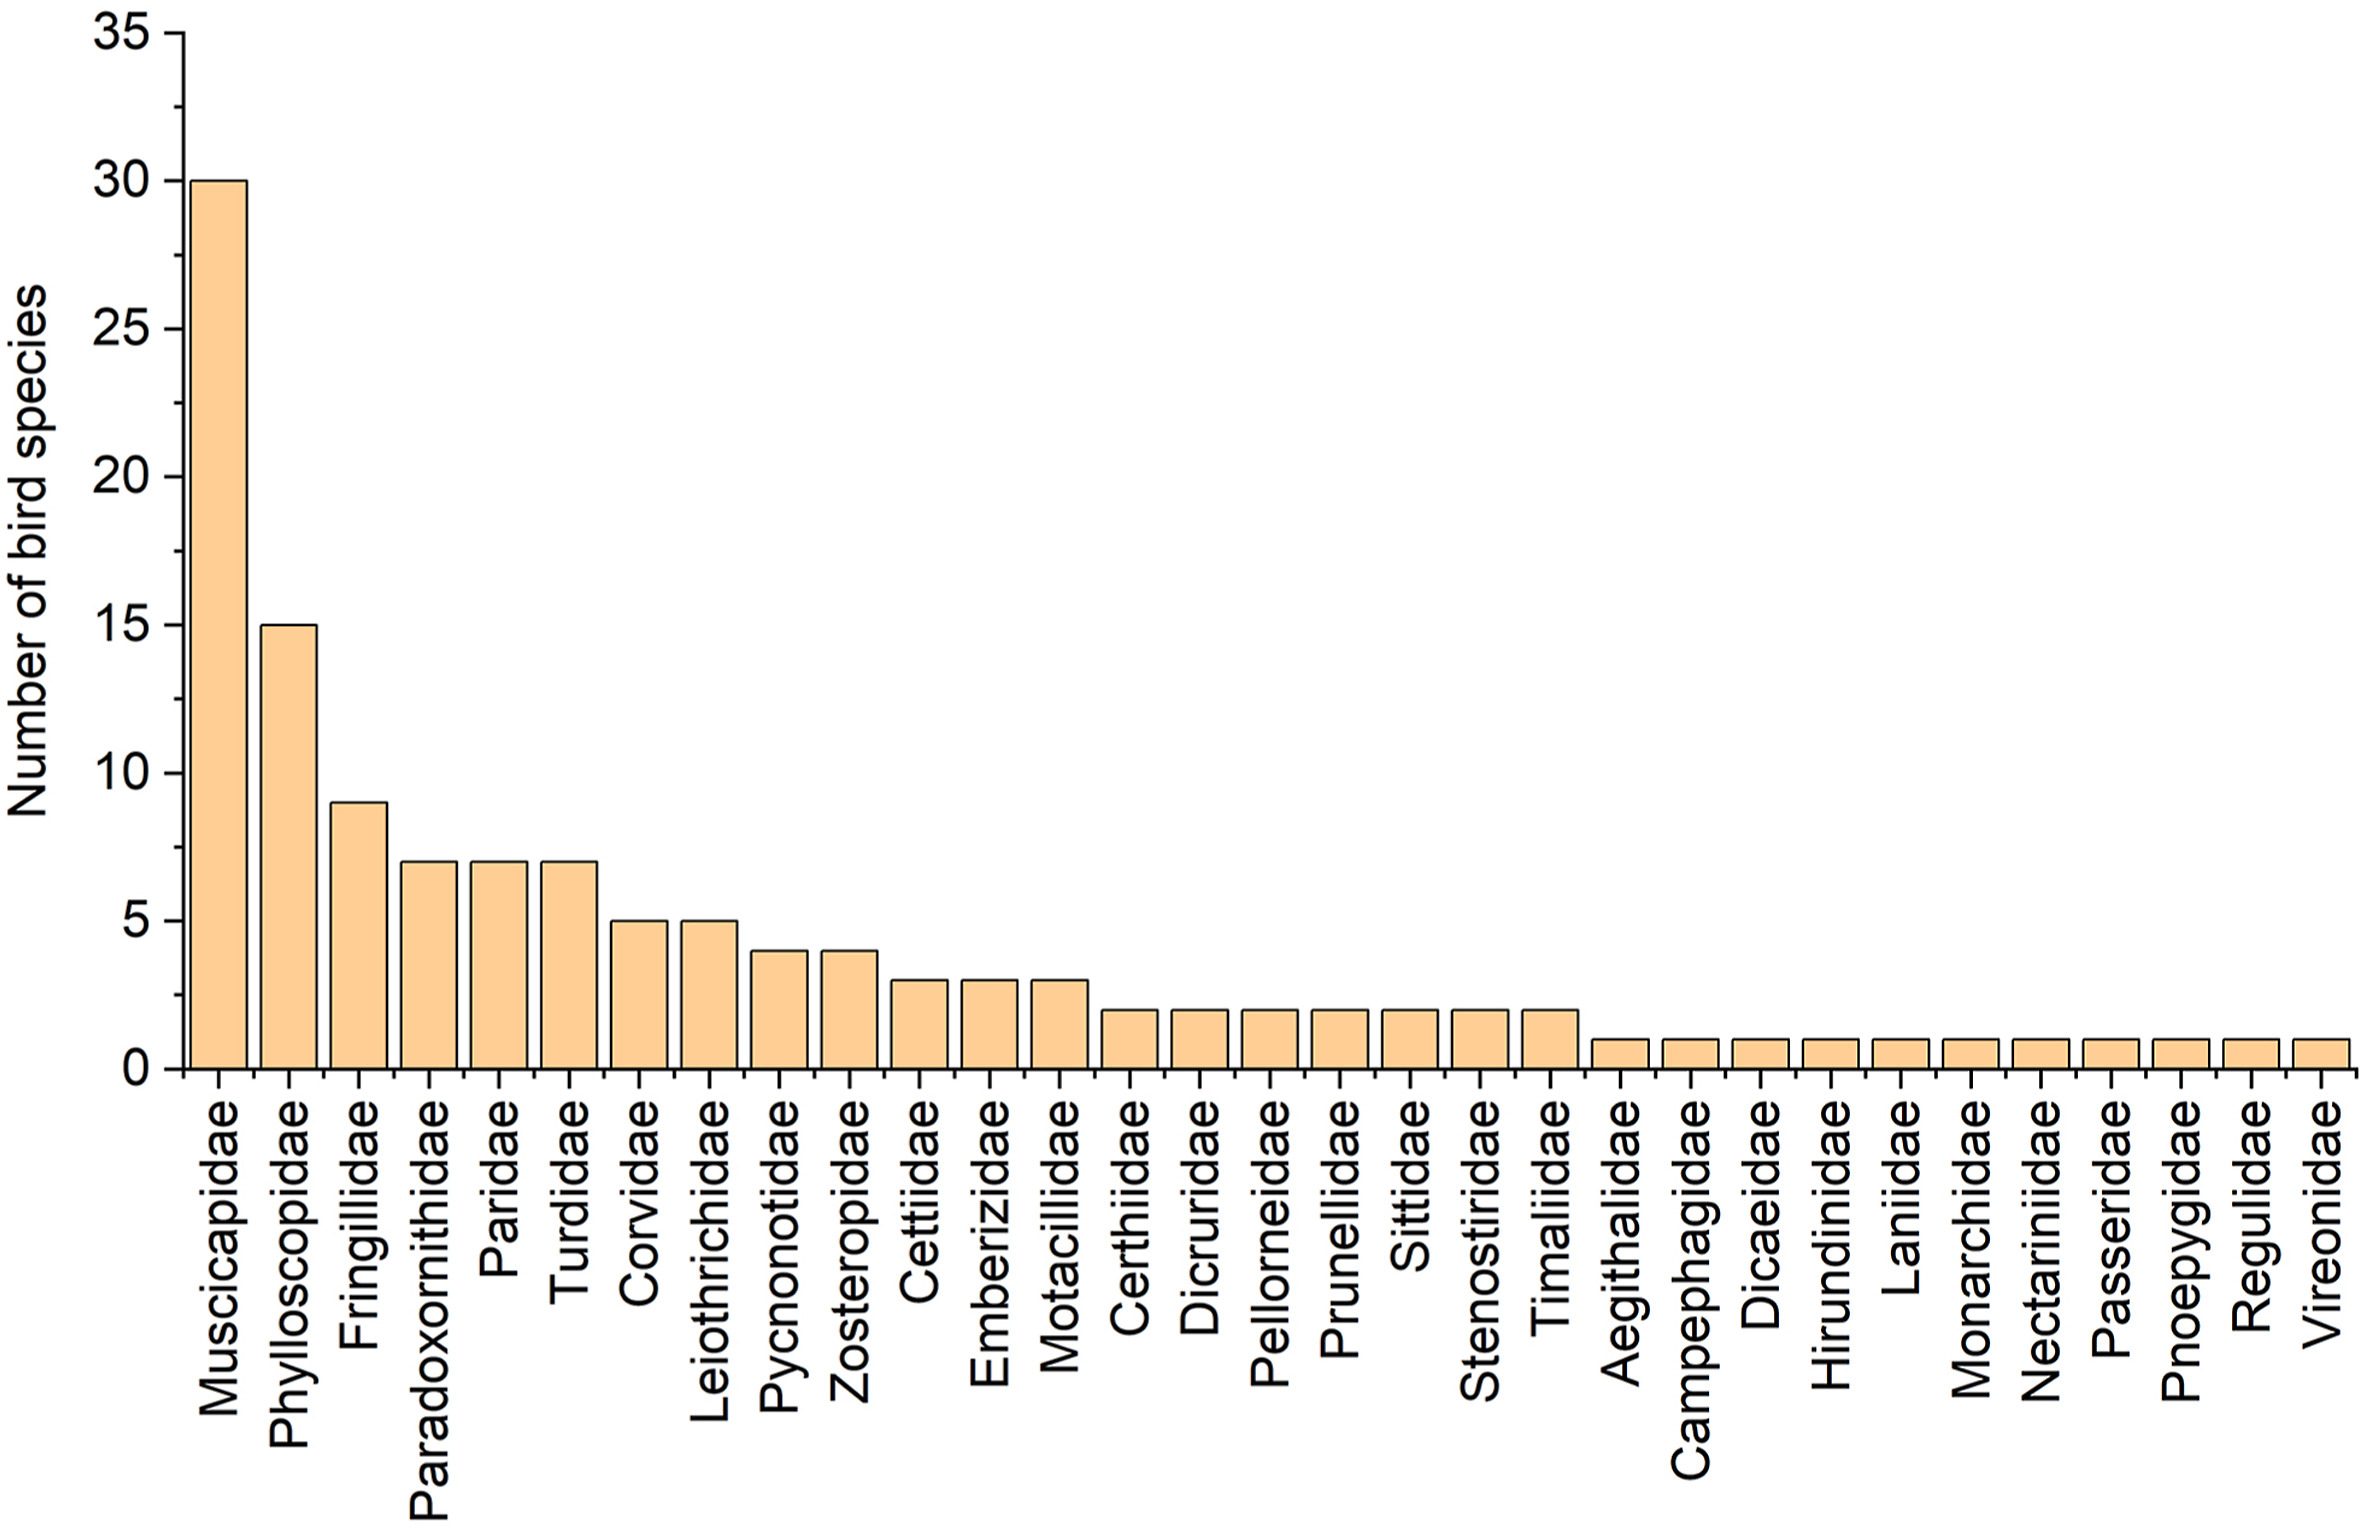
In total, eight orders, 40 families, 146 species and 2750 individuals were recorded. Totally 127 (87.0%) passerine bird species (distributed among 31 families) and 19 (13.0%) non-passerine bird species were recorded (Figs. 3 and 4). Muscicapidae (Old World flycatchers) had the most species (30 species, 23.6%), followed by Phylloscopidae (leaf warblers) with 15 species (11.8%) and Fringillidae (true finches) with nine species (7.1%) (Fig. 4).
Figure
3.
Percentage of bird species per avian order recorded during the surveys.
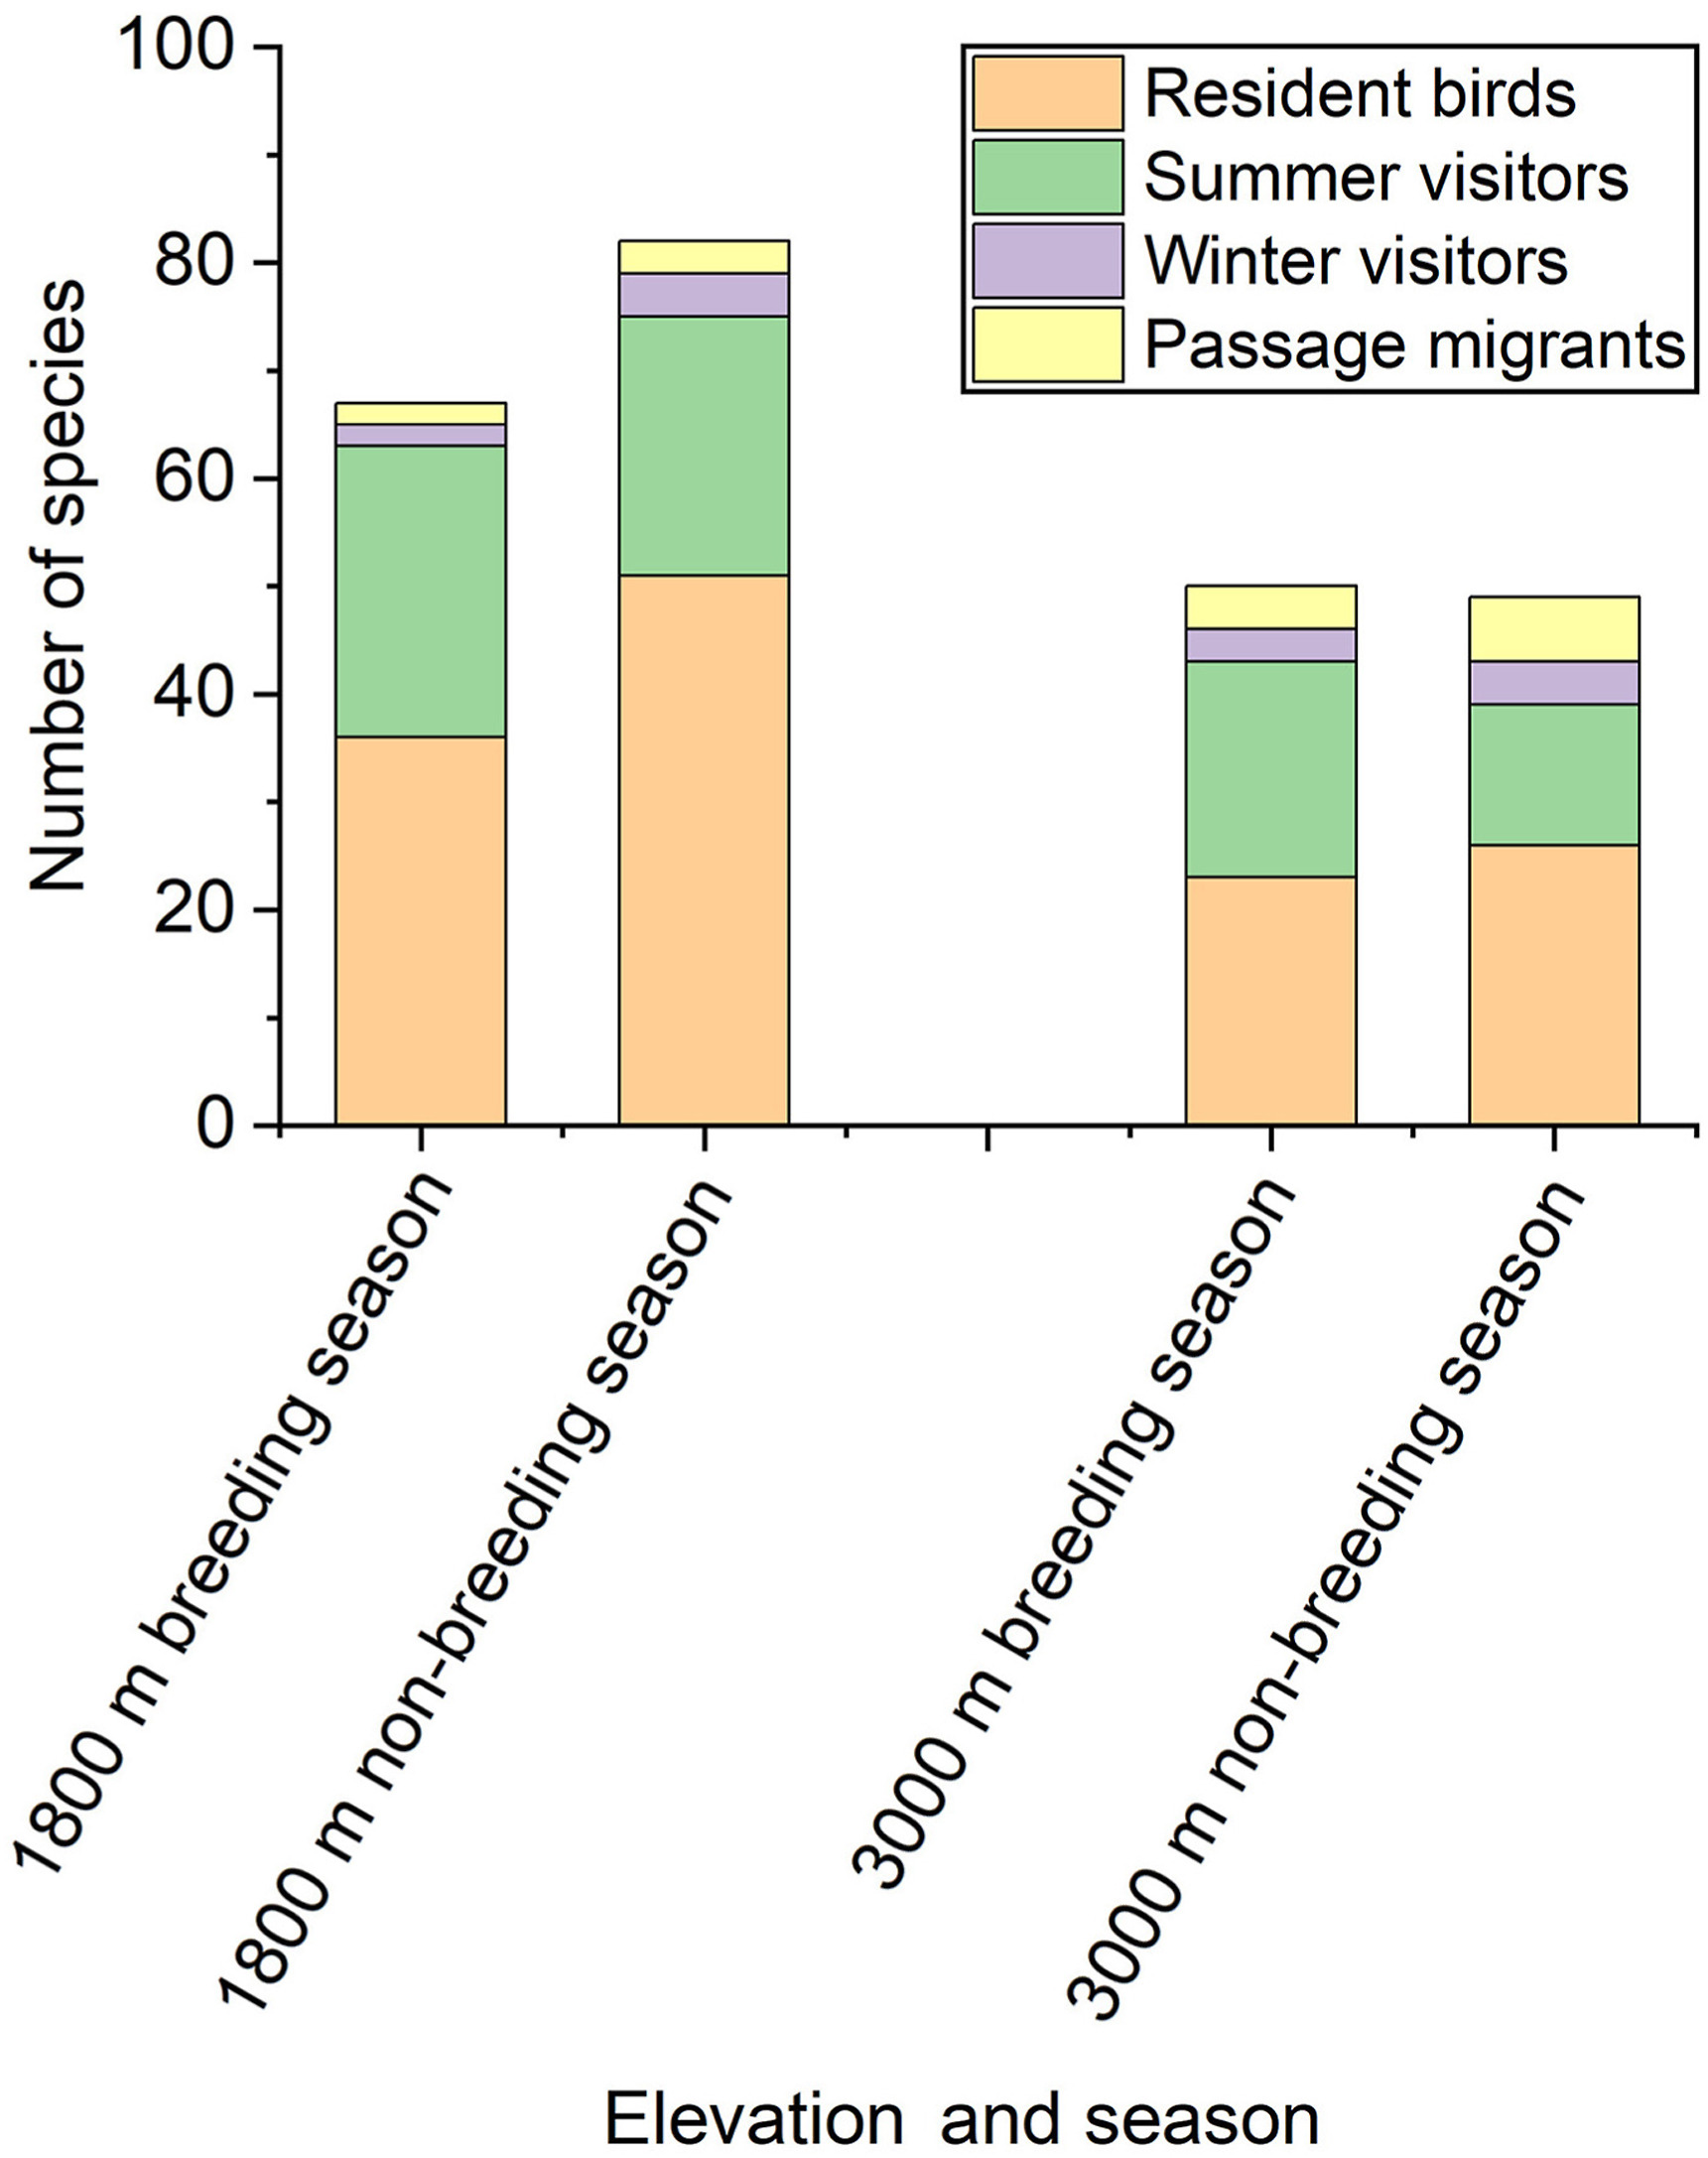
The species richness at 1800 m increased by 15 resident bird species during the non-breeding season. The number of summer visitors, winter visitors and passage migrants remained stable when comparing the breeding season to the non-breeding season (Fig. 5). However, the species richness at 3000 m decreased slightly during the non-breeding season and the number of resident bird species remained stable, but the number of summer visitors decreased significantly by seven species during the non-breeding season. The number of winter visitors and passage migrants remained stable (Fig. 5).
Figure
5.
Community composition showing seasonal change of the occurrence status and species richness at 1800 and 3000 m during the breeding season and the non-breeding season.
3.2
Bird species exhibiting altitudinal migration behavior
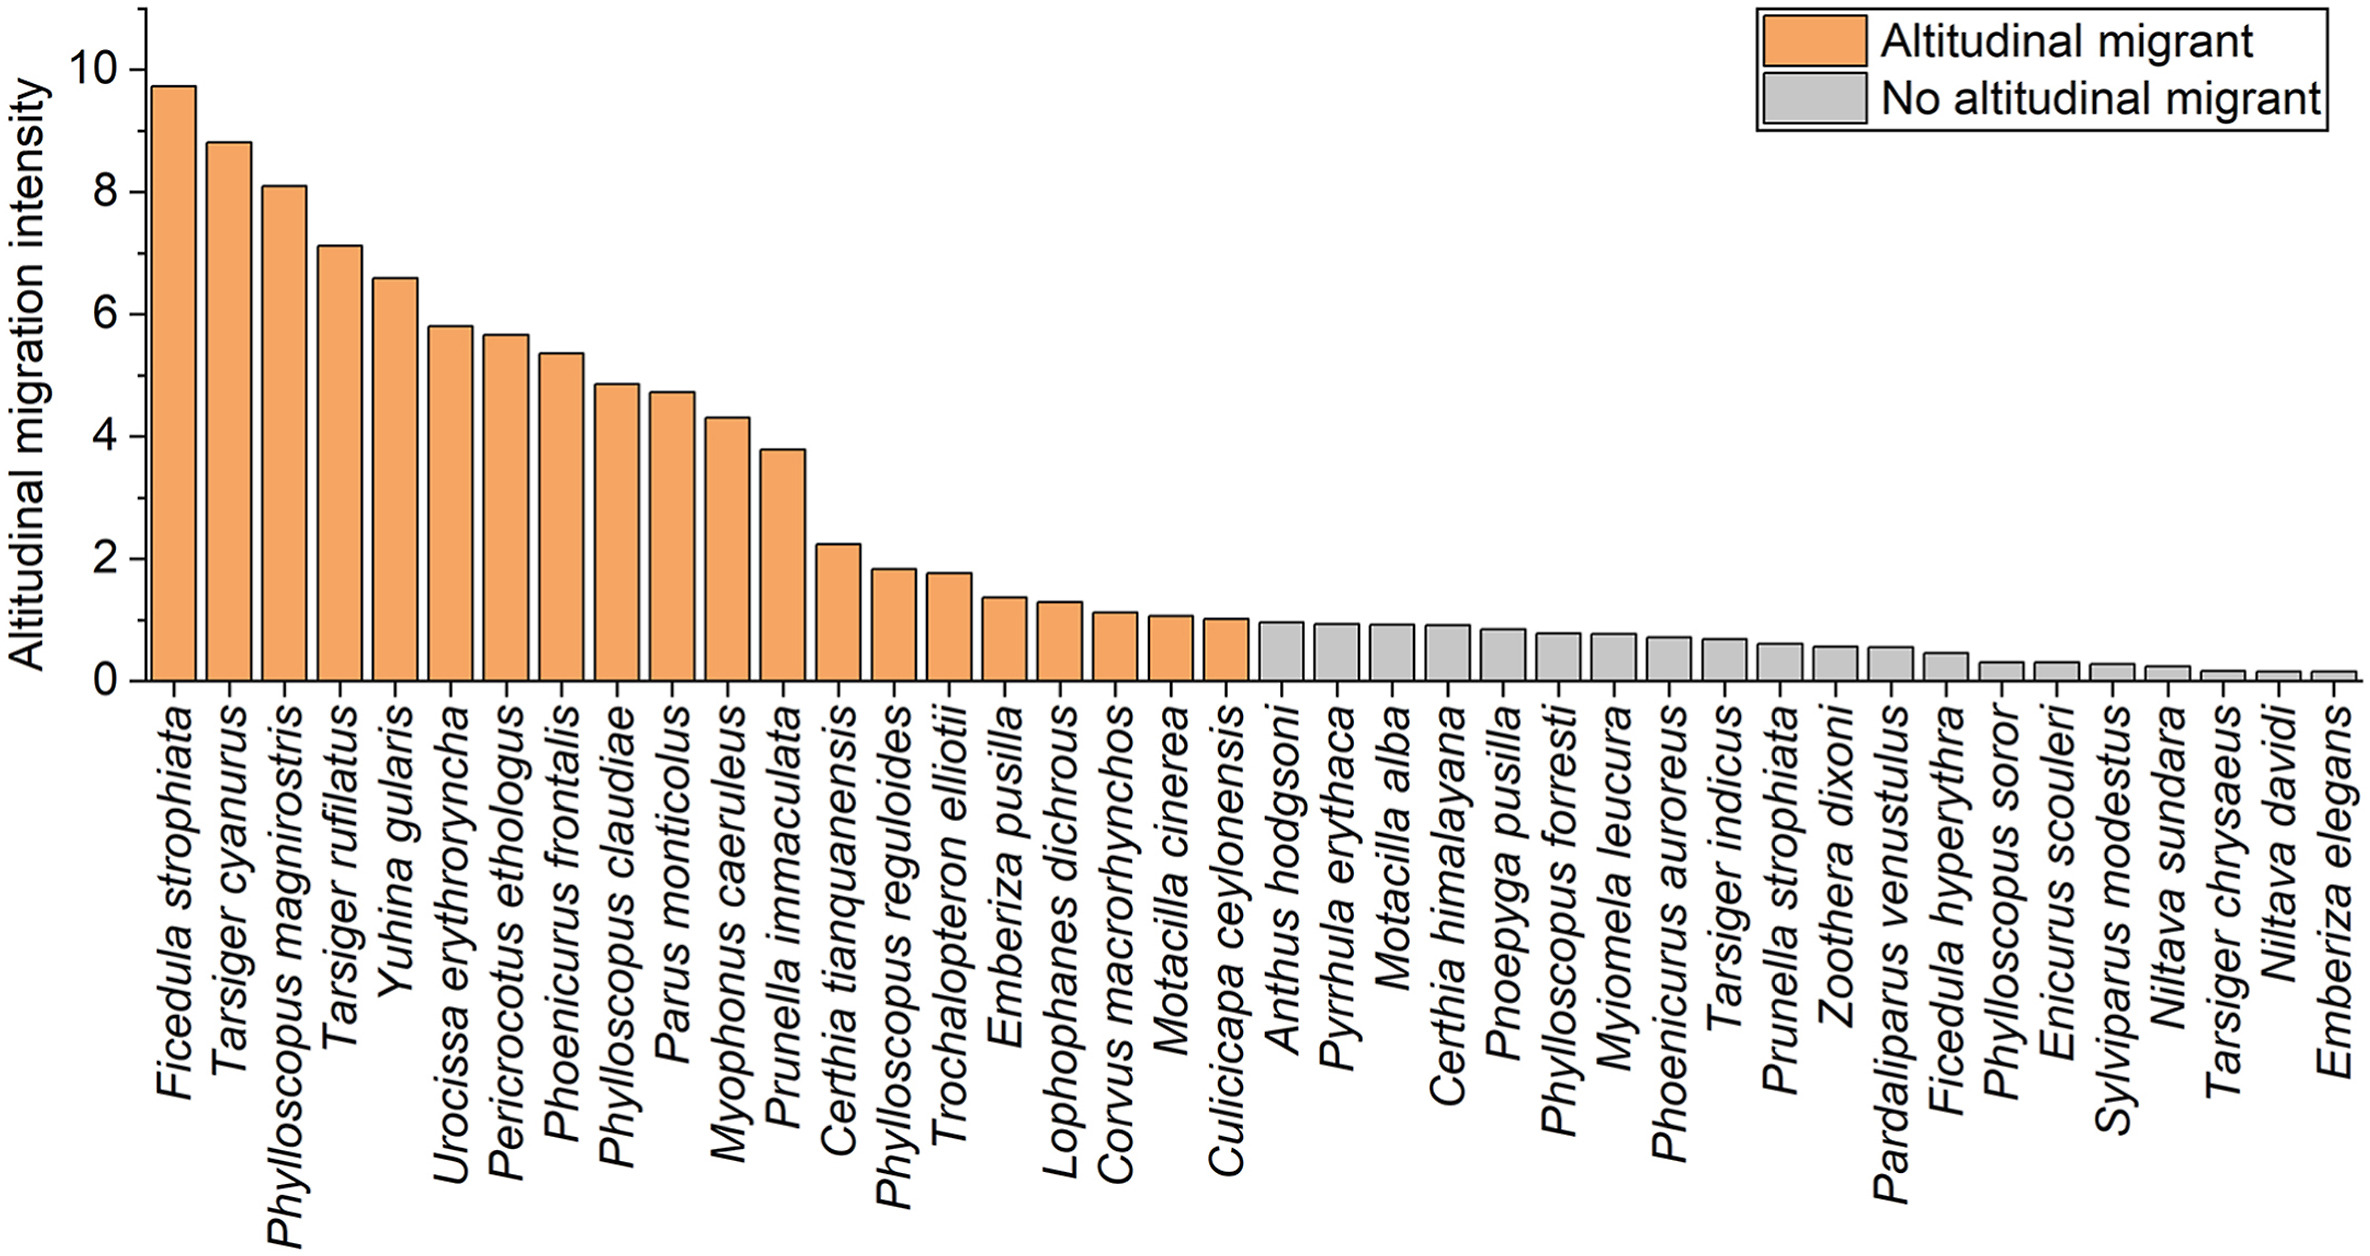
According to Eq. (1), 20 passerine bird species were labeled as altitudinal migrants (Fig. 6). These species consisted of 12 resident species (60.0%), seven summer visitors (35.0%) and one winter visitor (5.0%). There were 10 invertivorous (50.0%), nine omnivorous (45.0%) and one both invertivorous and carnivorous (5.0%) species. The dominant families were Muscicapidae (five species, 25.0%) and Phylloscopidae (three species, 15.0%) (Appendix Table S1).
Figure
6.
Altitudinal migration intensity per bird species. Orange bars represent bird species who are altitudinal migrants and grey bars represent bird species who are not altitudinal migrants. (For interpretation of the references to color in this figure legend, the reader is referred to the Web version of this article.)
Furthermore, according to Eq. (1), 20 passerine bird species were labeled as being no altitudinal migrants (Fig. 6). These species were observed at both study sites, but the number of individuals during the breeding and non-breeding season at 3000 m and at 1800 m did not show significant changes; therefore, the altitudinal migration intensity was below one. These species consisted of 11 resident species (55.0%), six summer visitors (30.0%) and three winter visitors (15.0%). There were 12 invertivorous (60.0%) and eight omnivorous (40.0%) species. The dominant family was Muscicapidae (eight species, 40.0%) (Appendix Table S1).
The rest of the 106 recorded species were labeled as having not enough data to prove altitudinal migration behavior, because these species were only recorded at one study site in usually small numbers (usually one to ten occurrences).
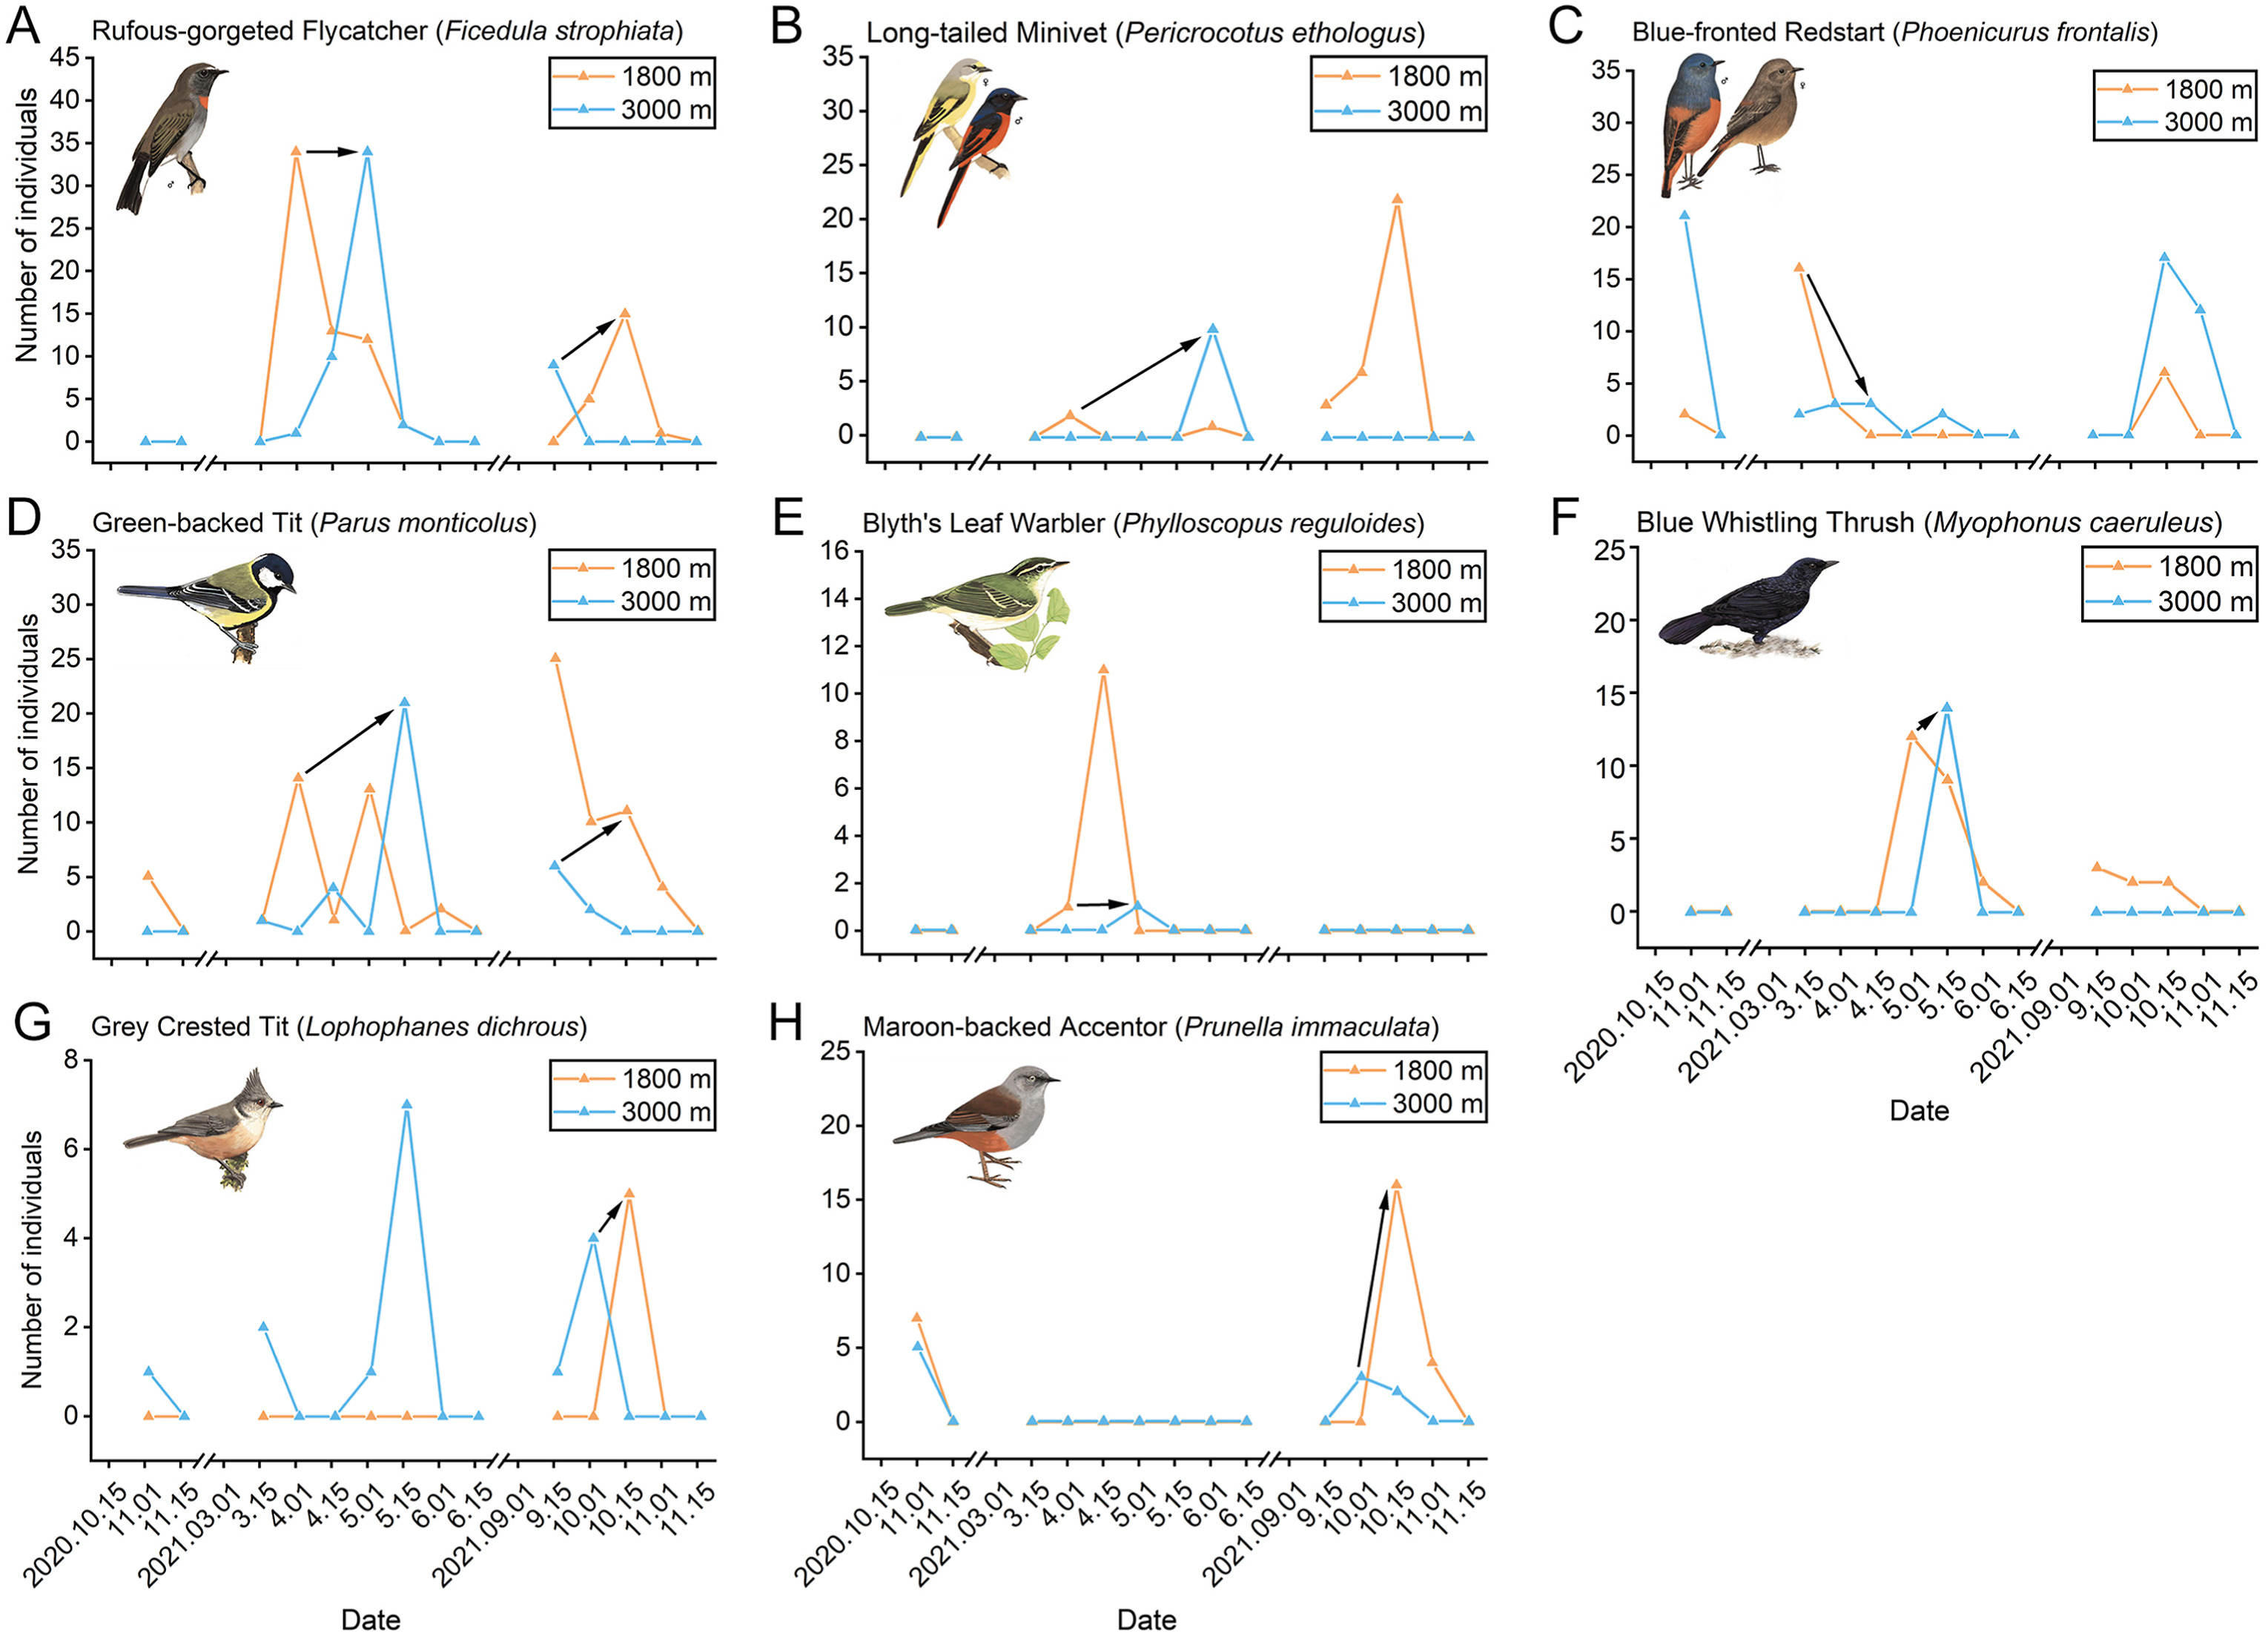
Among the 20 species being possible altitudinal migrants, eight bird species with a typical altitudinal migration pattern (upward migration during the breeding season and downward migration during the non-breeding season) were determined (Fig. 7). These bird species consisted of three summer visitors (37.5%) and five resident species (62.5%). The Rufous-gorgeted Flycatcher (Ficedula strophiata; Fig. 7A) had the most abundant data. This species is a summer visitor. During the breeding season of 2021, the Rufous-gorgeted Flycatcher likely migrated from 1800 m to 3000 m from the beginning until the end of April. The Rufous-gorgeted Flycatcher initiated upward migration at a temperature of 11–12 ℃ at 1800 m. During the non-breeding season of 2021, this bird species likely migrated from 3000 m to 1800 m from the mid of September until the mid of October. This species initiated downward migration at a temperature of 12–13 ℃ at 3000 m.
Figure
7.
Variation of individual numbers of species with a typical altitudinal migration pattern (A–H). Orange line shows number of individuals at 1800 m. Blue line shows number of individuals at 3000 m. Black arrow shows altitudinal migration trend. Bird pictures retrieved from MacKinnon et al. (2000). (For interpretation of the references to color in this figure legend, the reader is referred to the Web version of this article.)
3.3
Relationship between altitudinal migration behavior with temperature and humidity
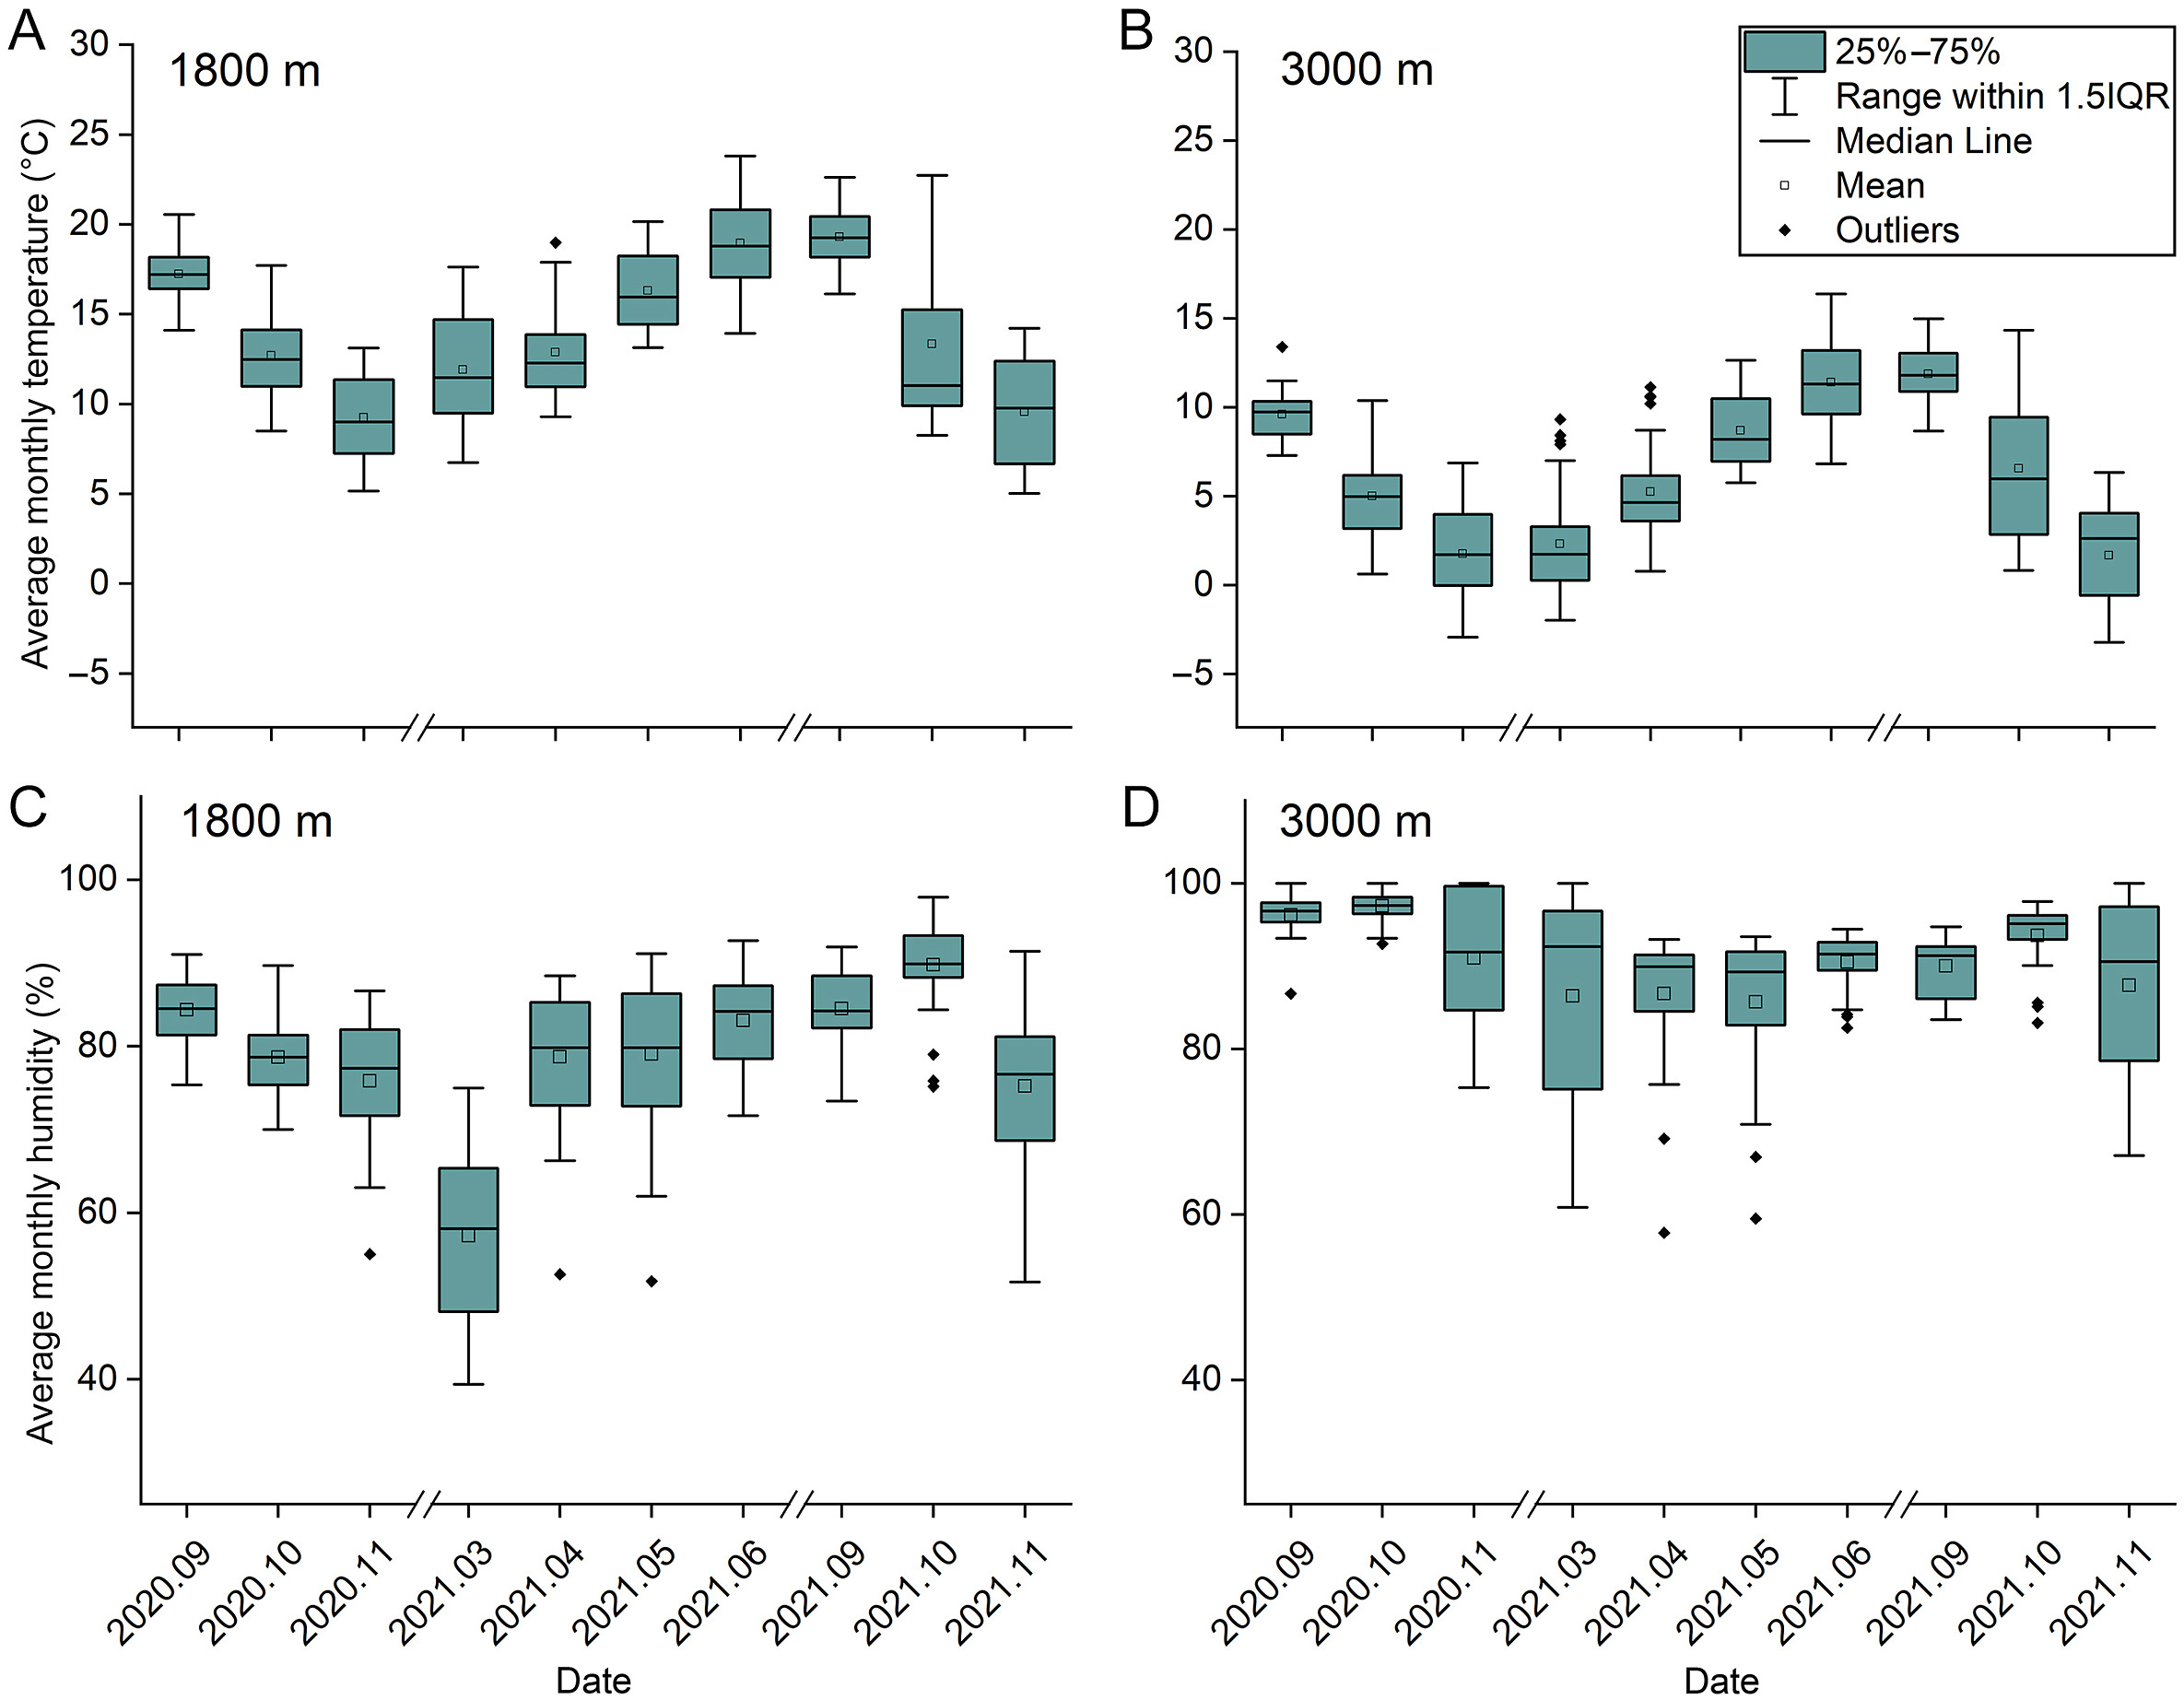
The average monthly temperature at 1800 m and 3000 m showed distinct seasonal changes. It gradually increased from March to June during the breeding season and rapidly decreased from September to November during the non-breeding season. The average monthly temperature on average was 7.7 ℃ lower at 3000 m than at 1800 m (Fig. 8A and B). The average monthly humidity at 1800 m showed distinct seasonal changes; however, the average monthly humidity at 3000 m did not show distinct seasonal changes. The average monthly humidity on average was 11.8% higher at 3000 m than at 1800 m (Fig. 8C and D).
Figure
8.
Average monthly temperature at 1800 m (A), average monthly temperature at 3000 m (B), average monthly humidity at 1800 m (C) and average monthly humidity at 3000 m (D).
For the Rufous-gorgeted Flycatcher, a summer visitor, the result of the Poisson regression (Table 1) indicated that the lowest daily temperature (LDT) had a positive correlation and the highest daily temperature (HDT) and the average daily temperature (ADT) had a negative correlation with the daily number of individuals (DNI) at 1800 m.
Table
1.
Poisson regression analyses with best model selection of the daily number of individuals (DNI) of the Rufous-gorgeted Flycatcher (F. strophiata), of summer visitors and of resident birds exhibiting altitudinal migration behavior against eight temperature and humidity factors.
Empty Cell
HDT
ADT
LDT
DTR
HDH
ADH
LDH
DHR
Rufous-gorgeted Flycatcher (F.strophiata) 1800 m
Estimate
−0.098
−0.515
0.387
NA
NA
−0.105
0.041
NA
z-value
2.417
2.679
2.116
NA
NA
1.606
1.052
NA
p-value
0.015*
0.007**
0.034*
NA
NA
0.108
0.293
NA
Rufous-gorgeted Flycatcher (F.strophiata) 3000 m
Estimate
NA
NA
NA
NA
−0.069
NA
NA
NA
z-value
NA
NA
NA
NA
1.174
NA
NA
NA
p-value
NA
NA
NA
NA
0.240
NA
NA
NA
Summer visitors 1800 m
Estimate
NA
−0.123
−0.104
NA
0.122
−0.058
0.025
−0.012
z-value
NA
4.392
4.076
NA
3.455
2.321
1.869
1.767
p-value
NA
1.120E–05**
4.580E–05**
NA
5.500E–04**
0.020*
0.062
0.077
Summer visitors 3000 m
Estimate
−0.036
0.013
0.002
−0.039
0.067
−0.045
0.013
0.020
z-value
1.522
0.299
0.073
1.511
2.042
1.848
1.361
1.391
p-value
0.128
0.765
0.942
0.131
0.041*
0.065
0.174
0.164
Resident birds 1800 m
Estimate
−0.031
0.230
−0.242
NA
0.026
0.023
0.021
NA
z-value
1.174
3.880
4.131
NA
1.749
2.107
2.403
NA
p-value
0.241
1.050E–04**
3.610E–05**
NA
0.080
0.035*
0.016*
NA
Resident birds 3000 m
Estimate
−1.622
NA
1.528
1.621
NA
NA
0.009
−0.011
z-value
5.017
NA
4.737
4.600
NA
NA
0.763
0.722
p-value
5.000E–07**
NA
2.200E–06**
4.200E–06**
NA
NA
0.446
0.470
Some factors were excluded by the model. *: significant correlation p ≤ 0.05. **: extremely significant correlation p ≤ 0.01. HDT: highest daily temperature. ADT: average daily temperature. LDT: lowest daily temperature. DTR: daily temperature range. HDH: highest daily humidity. ADH: average daily humidity. LDH: lowest daily humidity. DHR: daily humidity range.
Furthermore, for summer visitors, the result of the Poisson regression (Table 1) indicated that the highest daily humidity (HDH) had a positive correlation and ADT, LDT and the average daily humidity (ADH) had a negative correlation with the DNI at 1800 m. Moreover, HDH had a positive correlation with the DNI at 3000 m. Besides, the OLS regression (Table 2) showed that on the one hand HDH, ADH and lowest daily humidity (LDH) had a positive correlation and on the other hand HDT, ADT, LDT, the daily temperature range (DTR) and the daily humidity range (DHR) had a negative correlation with the DNI at 1800 m. The Pearson correlation (Table 3) had similar results to the OLS regression.
Table
2.
Ordinary least squares (OLS) regression analyses of the daily number of individuals (DNI) of the Rufous-gorgeted Flycatcher (F. strophiata), of summer visitors and of resident birds exhibiting altitudinal migration behavior against eight temperature and humidity factors.
Empty Cell
HDT
ADT
LDT
DTR
HDH
ADH
LDH
DHR
Rufous-gorgeted Flycatcher (F.strophiata) 1800 m
Estimate
−0.102
−0.183
−0.184
−0.106
0.006
−0.012
0.006
−0.008
R2
0.046
0.055
0.044
0.023
0
0.001
0.001
0.001
p-value
0.244
0.206
0.256
0.414
0.967
0.861
0.872
0.854
Rufous-gorgeted Flycatcher (F.strophiata) 3000 m
Estimate
0.011
−0.012
−0.011
0.011
−0.177
−0.016
−0.009
0.008
R2
0.003
0.001
0.001
0.003
0.083
−0.033
0.021
0.015
p-value
0.807
0.897
0.9
0.784
0.171
0.614
0.504
0.572
Summer visitors 1800 m
Estimate
−0.247
−0.434
−0.384
−0.289
0.234
0.095
0.088
−0.081
R2
0.161
0.153
0.089
0.121
0.102
0.073
0.135
0.110
p-value
3.210E–04**
4.850E–04**
0.009**
0.002**
0.005**
0.019*
0.001**
0.003**
Summer visitors 3000 m
Estimate
−0.099
−0.144
−0.124
−0.081
0.163
0.044
0.022
−0.017
R2
0.037
0.033
0.019
0.018
0.031
0.013
0.021
0.008
p-value
0.052
0.067
0.164
0.178
0.076
0.248
0.141
0.358
Resident birds 1800 m
Estimate
−0.083
−0.108
−0.129
−0.096
0.094
0.053
0.034
−0.038
R2
0.016
0.009
0.009
0.012
0.01
0.014
0.017
0.015
p-value
0.213
0.352
0.347
0.289
0.333
0.243
0.206
0.235
Resident birds 3000 m
Estimate
−0.124
−0.183
−0.189
−0.072
0.226
−0.005
0.004
0.005
R2
0.07
0.082
0.068
0.012
0.071
0
0.001
0.001
p-value
0.025*
0.016*
0.028*
0.357
0.025*
0.911
0.828
0.819
*: significant correlation p ≤ 0.05. **: extremely significant correlation p ≤ 0.01. HDT: highest daily temperature. ADT: average daily temperature. LDT: lowest daily temperature. DTR: daily temperature range. HDH: highest daily humidity. ADH: average daily humidity. LDH: lowest daily humidity. DHR: daily humidity range.
Table
3.
Pearson correlation coefficients of the daily number of individuals (DNI) of the Rufous-gorgeted Flycatcher (F. strophiata), of summer visitors and of resident birds exhibiting altitudinal migration behavior against eight temperature and humidity factors.
F.strophiata
DNI 1800 m
DNI 3000 m
HDT
−0.216
0.053
ADT
−0.233
−0.027
LDT
−0.210
−0.027
DTR
−0.152
0.059
HDH
0.008
−0.289
ADH
−0.033
−0.109
LDH
0.030
−0.143
DHR
−0.034
0.121
Summer visitors
HDT
−0.402**
−0.192
ADT
−0.389**
−0.180
LDT
−0.298**
−0.138
DTR
−0.348**
−0.134
HDH
0.319**
0.176
ADH
0.270*
0.115
LDH
0.367**
0.146
DHR
−0.331**
−0.091
Resident birds
HDT
−0.127
−0.265*
ADT
−0.095
−0.286*
LDT
−0.096
−0.261*
DTR
−0.108
−0.111
HDH
0.099
0.266*
ADH
0.119
−0.014
LDH
0.129
0.026
DHR
−0.121
0.028
*: significant correlation p ≤ 0.05. **: extremely significant correlation p ≤ 0.01. HDT: highest daily temperature. ADT: average daily temperature. LDT: lowest daily temperature. DTR: daily temperature range. HDH: highest daily humidity. ADH: average daily humidity. LDH: lowest daily humidity. DHR: daily humidity range.
Moreover, for resident birds, the result of the Poisson regression (Table 1) indicated that ADT, ADH and LDH had a positive correlation and LDT had a negative correlation with the DNI at 1800 m. LDT and DTR had a positive correlation and HDT had a negative correlation with the DNI at 3000 m. Furthermore, the OLS regression (Table 2) showed that HDH had a positive correlation and HDT, ADT and LDT had a negative correlation with the DNI at 3000 m. The Pearson correlation (Table 3) had similar results to the OLS regression.
4.
Discussion
4.1
Composition of altitudinal migrants and community composition change
Currently there are six bird families known to have a high number of species exhibiting altitudinal migration behavior, namely Fringillidae (33.6% of species), Turdidae (32.0%), Trochilidae (30.3%), Muscicapidae (22.3%), Thraupidae (15.2%) and Tyrannidae (9.8%) (Barçante et al., 2017). Muscicapidae, Fringillidae and Turdidae are distributed in Hailuo Valley (Wu et al., 2017b). We found that most altitudinal migrants in Hailuo Valley were distributed among Muscicapidae (five species, 25.0%) and Phylloscopidae (three species, 15.0%). Therefore, altitudinal migration in Muscicapidae and Phylloscopidae in Hailuo Valley is more common than in other families.
As for the community composition, the number of resident bird species at 1800 m during the non-breeding season was higher than during the breeding season (Fig. 5). This may indicate that low elevations (1800 m) are an important overwintering place for resident species. Low elevation areas therefore require more conservation attention because these areas are threatened much more by anthropogenic activities such as agriculture and animal farming (Martin et al., 2007; Wade et al., 2013). Additionally, the number of summer visitors at 3000 m during the breeding season was higher than during the non-breeding season. This may indicate that high elevations (3000 m) are an important breeding place for summer visitors.
4.2
Relationship between altitudinal migration with temperature and humidity
Temperature is considered to be an important factor affecting altitudinal migration behavior patterns (Hsiung et al., 2018). The direct effect of unfavorable weather (low temperature) is the increase of the energetic costs of maintaining an optimal body temperature in birds. Therefore, birds tend to move to elevations with more favorable temperatures to increase fitness as they have the ability to fly to areas with more favorable temperatures (McCain, 2009; Wu et al., 2013; He et al., 2019). Combining the results of the Poisson and the OLS regression and the Pearson correlation, it becomes evident that especially ADT and LDT, but also HDT had an important influence on the altitudinal migration of birds (Tables 1–3). The coefficient estimates of HDT, ADT and LDT of the Poisson and the OLS regression usually had a negative correlation with the DNI at 1800 m, implying that increasing temperatures caused upward migration of birds (DNI decreased at 1800 m) and vice versa. Furthermore, the coefficient estimates of HDT, ADT and LDT of the Poisson regression usually had a positive correlation with the DNI at 3000 m, implying that increasing temperatures made birds migrate from 1800 to 3000 m (DNI increased at 3000 m) and vice versa. These correlations are consistent with our expectations (Fig. 2) and with many previous studies (Chaves-Campos, 2004; Morrissey et al., 2004; Tsai et al., 2021; He et al., 2022). However, for the OLS regression, the coefficient estimates of HDT, ADT and LDT were usually negatively correlated at 3000 m instead. This is not surprising, as the relationship of migration behavior with the temperature is complex. Our dataset at 3000 m is smaller and might be not conclusive enough which may explain the negative correlation of the OLS regression.
Furthermore, rainfall or snow (equals to increasing humidity) make birds migrate downwards in order to avoid cold stress and to increase survival rate (O'Neill and Parker, 1978; Hahn et al., 2004), similar to the effect of low temperatures. Combining the results of the three statistical analysis methods, it becomes evident that the coefficient estimates of HDH, ADH and LDH usually had a positive correlation with the DNI (Tables 2 and 3), implying that increasing humidity caused downward migration of birds (DNI increased) and vice versa. This is consistent with the results of previous studies (Boyle, 2010, 2011).
4.3
Feeding habits of altitudinal migrants
Feeding habits are another important factor affecting the altitudinal migration behavior patterns of birds (Ghosh-Harihar and Price, 2014; Barçante et al., 2017; Pageau et al., 2020). Among the 20 altitudinal migrant species, there were 12 invertivorous (60.0%) and 8 omnivorous (40.0%) species. This is consistent with a previous study: altitudinal migration behavior among invertivores is most common, expect for the Neotropics, where nectarivores and frugivores are predominant among altitudinal migrants (Barçante et al., 2017). This may be related to the seasonal variation of the invertebrate biomass at different elevations. The invertebrate biomass increases at high elevations during the breeding season due to increasing temperature and decreases at high elevations during the non-breeding season due to decreasing temperature (Supriya et al., 2019; Araújo et al., 2022). Furthermore, the invertebrate biomass in Hailuo Valley was positively correlated with the total species richness and small-ranged species richness of birds, implying that the bird species richness was high at elevations with a high invertebrate biomass (He et al., 2019). Therefore, the spatial and temporal changes of the invertebrate biomass combined with increasing or decreasing temperature at low and high elevations might be an important ecological driver for the altitudinal migration of invertivores. Future studies need to include the monthly measure of the invertebrate biomass and plant food sources such as berries, flowers and seeds to study more ecological drivers which may influence the altitudinal migration of birds.
5.
Conclusions
This study clearly shows how altitudinal migration is seasonally dynamic across an elevational gradient in the Hengduan Mountains and explores the effects of temperature, humidity and feeding habits on the altitudinal migration of birds. Twenty altitudinal migrant species were determined and eight species exhibited a typical altitudinal migration behavior (upward migration during the breeding season and downward migration during the non-breeding season). The Rufous-gorgeted Flycatcher as a species with the most prominent altitudinal migration behavior, initiated upward migration at a temperature of 11–12 ℃ at 1800 m and initiated downward migration at a temperature of 12–13 ℃ at 3000 m. Our study provides basic understanding about which species exhibit altitudinal migration in the Hengduan Mountains, when birds in this region migrate and at what temperature they start migrating.
Authors’ contributions
ZL, YW and JR designed the study. ZL and IH analyzed the data. IH and YW wrote the manuscript. The manuscript and data were based on the master's thesis of ZL. ZL, SZ, ZD, YC, KF and KP performed the field data collection. All authors read and approved the final manuscript.
Ethics statement
All animal research procedures strictly complied with the P.R. China Legislation on the Use and Care of Laboratory Animals and were approved by the Animal Care Review Committee, College of Life Sciences, Sichuan University, China.
Declaration of competing interest
The authors declare that they have no known competing financial interests or personal relationships that could have appeared to influence the work reported in this paper.
Acknowledgements
We thank Yan Wang, Xiaofeng Zheng, Yanni Zhang, Yunhao Si, Dongyuan Ma, Zhihui Liu and Renxiu Zhou for their kind assistance with the field data collection. We thank Xiaoquan Lan and Faming Liu at the Gongga Mountain Alpine Ecosystem Observation and Experiment Station of the Chinese Academy of Sciences for their kind support with the field work. We thank the Forestry and Grassland Bureau of Ganzi Tibetan Autonomous Prefecture and Hailuo Valley Scenic Area Administration of Ganzi Tibetan Autonomous Prefecture for their kind support.
Araújo, C.D.O., Hortal, J., de Macedo, M.V., Monteiro, R.F., 2022. Elevational and seasonal distribution of Scarabaeinae dung beetles (Scarabaeidae: Coleoptera) at Itatiaia National Park (Brazil). Int. J. Trop. Insect Sci. 42, 1579–1592. .
Barçante, L., Vale, M.M., Alves, M.A.S., 2017. Altitudinal migration by birds: a review of the literature and a comprehensive list of species. J. Field Ornithol. 88, 321–335. .
Borras, A., Senar, J.C., Alba-Sánchez, F., López-Sáez, J.A., Cabrera, J., Colomé, X., et al., 2010. Citril finches during the winter: patterns of distribution, the role of pines and implications for the conservation of the species. Anim. Biodivers. Conserv. 33, 89–115.
Boyle, W.A., 2010. Does food abundance explain altitudinal migration in a tropical frugivorous bird? Can. J. Zool. 88, 204–213. .
Boyle, W.A., 2011. Short-distance partial migration of Neotropical birds: a community-level test of the foraging limitation hypothesis. Oikos 120, 1803–1816. .
Boyle, W.A., 2017. Altitudinal bird migration in North America. Auk 134, 443–465. .
Chaves-Campos, J., 2004. Elevational movements of large frugivorous birds and temporal variation in abundance of fruits along an elevational gradient. Ornitol. Neotrop. 15, 433–445.
Cheng, G., Luo, J., 2004. Succession features and dynamic simulation of subalpine forest in the Gongga Mountain, China. J. Mt. Sci. 1, 29–37. .
Dingle, H., Drake, V.A., 2007. What is migration? Bioscience 57, 113–121. .
Ghosh-Harihar, M., Price, T.D., 2014. A test for community saturation along the Himalayan bird diversity gradient, based on within-species geographical variation. J. Anim. Ecol. 83, 628–638. .
Gutiérrez, D., Wilson, R.J., 2014. Climate conditions and resource availability drive return elevational migrations in a single-brooded insect. Oecologia 175, 861–873. .
Habel, J.C., Rasche, L., Schneider, U.A., Engler, J.O., Schmid, E., Rödder, D., et al., 2019. Final countdown for biodiversity hotspots. Conserv. Lett. 12, e12668. .
Hahn, T.P., Sockman, K.W., Breuner, C.W., Morton, M.L., 2004. Facultative altitudinal movements by mountain white-crowned sparrows (Zonotrichia leucophrys oriantha) in the Sierra Nevada. Auk 121, 1269–1281. .
He, X., Wang, X., DuBay, S., Reeve, A.H., Alström, P., Ran, J., et al., 2019. Elevational patterns of bird species richness on the eastern slope of Mt. Gongga, Sichuan Province, China. Avian Res. 10, 1. .
He, X., DuBay, S., Zhangshang, M., Cheng, Y., Liu, Z., Li, D., et al., 2022. Seasonal elevational patterns and the underlying mechanisms of avian diversity and community structure on the eastern slope of Mt. Gongga. Divers. Distrib. 28, 2459–2474. .
Henry, P., 2011. Differential migration in the polygynandrous Alpine Accentor Prunella collaris. Bird Study 58, 160–170. .
Körner, C., 2007. The use of ‘altitude’ in ecological research. Trends Ecol. Evol. 22, 569–574. .
Lehikoinen, A., Hokkanen, T., Lokki, H., 2011. Young and female-biased irruptions in pygmy owls Glaucidium passerinum in southern Finland. J. Avian Biol. 42, 564–569. .
Liu, Y., Chen, S., 2021. The CNG Field Guide to the Birds of China, first ed. Hunan Science and Technology Press, Changsha.
MacKinnon, J., 2021. Guide to the Birds of China, first ed. Beijing Commercial Press, Beijing.
MacKinnon, J., Phillips, K., He, F., 2000. A Field Guide to the Birds of China, first ed. Hunan Education Press, Changsha.
Martin, T.G., Chadès, I., Arcese, P., Marra, P.P., Possingham, H.P., Norris, D.R., 2007. Optimal conservation of migratory species. PLoS One 2, e751. .
McCain, C.M., 2009. Global analysis of bird elevational diversity. Glob. Ecol. Biogeogr. 18, 346–360. .
Merkord, C.L., 2010. Seasonality and Elevational Migration in an Andean Bird Community, first ed. University of Missouri, Columbia.
Morrissey, C.A., Bendell-Young, L.I., Elliott, J.E., 2004. Seasonal trends in population density, distribution, and movement of American dippers within a watershed of southwestern British Columbia, Canada. Condor 106, 815–825. .
O'Neill, J.P., Parker, T.A., 1978. Responses of birds to a snowstorm in the Andes of southern Peru. Wilson Bull. 90, 446–449.
Pageau, C., Vale, M.M., de Menezes, M.A., Barçante, L., Shaikh, M., Alves, M.A.S., et al., 2020. Evolution of altitudinal migration in passerines is linked to diet. Ecol. Evol. 10, 3338–3345. .
Polakowski, M., Broniszewska, M., Skierczynski, M., 2008. Sex and Age Composition during Autumn Migration of Pygmy Owl Glaucidium passerinum in Central Sweden in 2005, vol. 18, pp. 82–86.
Pratt, A.C., Smith, K.T., Beck, J.L., 2017. Environmental cues used by greater sage-grouse to initiate altitudinal migration. Auk 134, 628–643. .
Que, P., Zhu, L., Zhang, J., Wang, J., Li, Z., Shen, Y., et al., 2020. Updates to the checklist of birds in Sichuan Province. Sichuan J. Zool. 39, 332–360.
Rappole, J., 2013. The Avian Migrant, first ed. Columbia University Press, New York.
Good, D.A., 1996. Misuse of data from mist-net captures to assess relative abundance in bird populations. Auk 113, 381–398. .
Resano-Mayor, J., Bettega, C., del Mar Delgado, M., Fernández-Martín, Á., Hernández-Gómez, S., Toranzo, I., et al., 2020. Partial migration of White-winged snowfinches is correlated with winter weather conditions. Glob. Ecol. Conserv. 24, e01346. .
Supriya, K., Moreau, C.S., Sam, K., Price, T.D., 2019. Analysis of tropical and temperate elevational gradients in arthropod abundance. Front. Biogeogr. 11, e43104. .
Tsai, P., Ko, C., Chia, S.Y., Lu, Y., Tuanmu, M., 2021. New insights into the patterns and drivers of avian altitudinal migration from a growing crowdsourcing data source. Ecography 44, 75–86. .
Wade, A.S.I., Barov, B., Burfield, I.J., Gregory, R.D., Norris, K., Butler, S.J., 2013. Quantifying the detrimental impacts of land-use and management change on European forest bird populations. PLoS One 8, e64552. .
Wu, Y., Colwell, R.K., Rahbek, C., Zhang, C., Quan, Q., Wang, C., et al., 2013. Explaining the species richness of birds along a subtropical elevational gradient in the Hengduan Mountains. J. Biogeogr. 40, 2310–2323. .
Wu, Y., DuBay, S.G., Colwell, R.K., Ran, J., Lei, F., 2017a. Mobile hotspots and refugia of avian diversity in the mountains of south-west China under past and contemporary global climate change. J. Biogeogr. 44, 615–626.
Wu, Y., He, X., Zhou, H., He, M., Yong, F., Zhang, W., et al., 2017b. Avifauna of the eastern slope of Mount Gongga. Sichuan J. Zool. 36, 601–615.
Zhang, J., 1996. A Manual to Identify Sichuan Birds. In: first ed. China Forestry Publishing House, Beijing.
Zheng, G., 2017. A Checklist on the Classification and Distribution of the Birds of China, third ed. Beijing Science Press, Beijing.
Zhong, X.H., 1999. The characteristics of the mountain ecosystem and environment in the Gongga Mountain region. Ambio 28, 648–654.
Table
1.
Poisson regression analyses with best model selection of the daily number of individuals (DNI) of the Rufous-gorgeted Flycatcher (F. strophiata), of summer visitors and of resident birds exhibiting altitudinal migration behavior against eight temperature and humidity factors.
Empty Cell
HDT
ADT
LDT
DTR
HDH
ADH
LDH
DHR
Rufous-gorgeted Flycatcher (F.strophiata) 1800 m
Estimate
−0.098
−0.515
0.387
NA
NA
−0.105
0.041
NA
z-value
2.417
2.679
2.116
NA
NA
1.606
1.052
NA
p-value
0.015*
0.007**
0.034*
NA
NA
0.108
0.293
NA
Rufous-gorgeted Flycatcher (F.strophiata) 3000 m
Estimate
NA
NA
NA
NA
−0.069
NA
NA
NA
z-value
NA
NA
NA
NA
1.174
NA
NA
NA
p-value
NA
NA
NA
NA
0.240
NA
NA
NA
Summer visitors 1800 m
Estimate
NA
−0.123
−0.104
NA
0.122
−0.058
0.025
−0.012
z-value
NA
4.392
4.076
NA
3.455
2.321
1.869
1.767
p-value
NA
1.120E–05**
4.580E–05**
NA
5.500E–04**
0.020*
0.062
0.077
Summer visitors 3000 m
Estimate
−0.036
0.013
0.002
−0.039
0.067
−0.045
0.013
0.020
z-value
1.522
0.299
0.073
1.511
2.042
1.848
1.361
1.391
p-value
0.128
0.765
0.942
0.131
0.041*
0.065
0.174
0.164
Resident birds 1800 m
Estimate
−0.031
0.230
−0.242
NA
0.026
0.023
0.021
NA
z-value
1.174
3.880
4.131
NA
1.749
2.107
2.403
NA
p-value
0.241
1.050E–04**
3.610E–05**
NA
0.080
0.035*
0.016*
NA
Resident birds 3000 m
Estimate
−1.622
NA
1.528
1.621
NA
NA
0.009
−0.011
z-value
5.017
NA
4.737
4.600
NA
NA
0.763
0.722
p-value
5.000E–07**
NA
2.200E–06**
4.200E–06**
NA
NA
0.446
0.470
Some factors were excluded by the model. *: significant correlation p ≤ 0.05. **: extremely significant correlation p ≤ 0.01. HDT: highest daily temperature. ADT: average daily temperature. LDT: lowest daily temperature. DTR: daily temperature range. HDH: highest daily humidity. ADH: average daily humidity. LDH: lowest daily humidity. DHR: daily humidity range.
Table
2.
Ordinary least squares (OLS) regression analyses of the daily number of individuals (DNI) of the Rufous-gorgeted Flycatcher (F. strophiata), of summer visitors and of resident birds exhibiting altitudinal migration behavior against eight temperature and humidity factors.
Empty Cell
HDT
ADT
LDT
DTR
HDH
ADH
LDH
DHR
Rufous-gorgeted Flycatcher (F.strophiata) 1800 m
Estimate
−0.102
−0.183
−0.184
−0.106
0.006
−0.012
0.006
−0.008
R2
0.046
0.055
0.044
0.023
0
0.001
0.001
0.001
p-value
0.244
0.206
0.256
0.414
0.967
0.861
0.872
0.854
Rufous-gorgeted Flycatcher (F.strophiata) 3000 m
Estimate
0.011
−0.012
−0.011
0.011
−0.177
−0.016
−0.009
0.008
R2
0.003
0.001
0.001
0.003
0.083
−0.033
0.021
0.015
p-value
0.807
0.897
0.9
0.784
0.171
0.614
0.504
0.572
Summer visitors 1800 m
Estimate
−0.247
−0.434
−0.384
−0.289
0.234
0.095
0.088
−0.081
R2
0.161
0.153
0.089
0.121
0.102
0.073
0.135
0.110
p-value
3.210E–04**
4.850E–04**
0.009**
0.002**
0.005**
0.019*
0.001**
0.003**
Summer visitors 3000 m
Estimate
−0.099
−0.144
−0.124
−0.081
0.163
0.044
0.022
−0.017
R2
0.037
0.033
0.019
0.018
0.031
0.013
0.021
0.008
p-value
0.052
0.067
0.164
0.178
0.076
0.248
0.141
0.358
Resident birds 1800 m
Estimate
−0.083
−0.108
−0.129
−0.096
0.094
0.053
0.034
−0.038
R2
0.016
0.009
0.009
0.012
0.01
0.014
0.017
0.015
p-value
0.213
0.352
0.347
0.289
0.333
0.243
0.206
0.235
Resident birds 3000 m
Estimate
−0.124
−0.183
−0.189
−0.072
0.226
−0.005
0.004
0.005
R2
0.07
0.082
0.068
0.012
0.071
0
0.001
0.001
p-value
0.025*
0.016*
0.028*
0.357
0.025*
0.911
0.828
0.819
*: significant correlation p ≤ 0.05. **: extremely significant correlation p ≤ 0.01. HDT: highest daily temperature. ADT: average daily temperature. LDT: lowest daily temperature. DTR: daily temperature range. HDH: highest daily humidity. ADH: average daily humidity. LDH: lowest daily humidity. DHR: daily humidity range.
Table
3.
Pearson correlation coefficients of the daily number of individuals (DNI) of the Rufous-gorgeted Flycatcher (F. strophiata), of summer visitors and of resident birds exhibiting altitudinal migration behavior against eight temperature and humidity factors.
F.strophiata
DNI 1800 m
DNI 3000 m
HDT
−0.216
0.053
ADT
−0.233
−0.027
LDT
−0.210
−0.027
DTR
−0.152
0.059
HDH
0.008
−0.289
ADH
−0.033
−0.109
LDH
0.030
−0.143
DHR
−0.034
0.121
Summer visitors
HDT
−0.402**
−0.192
ADT
−0.389**
−0.180
LDT
−0.298**
−0.138
DTR
−0.348**
−0.134
HDH
0.319**
0.176
ADH
0.270*
0.115
LDH
0.367**
0.146
DHR
−0.331**
−0.091
Resident birds
HDT
−0.127
−0.265*
ADT
−0.095
−0.286*
LDT
−0.096
−0.261*
DTR
−0.108
−0.111
HDH
0.099
0.266*
ADH
0.119
−0.014
LDH
0.129
0.026
DHR
−0.121
0.028
*: significant correlation p ≤ 0.05. **: extremely significant correlation p ≤ 0.01. HDT: highest daily temperature. ADT: average daily temperature. LDT: lowest daily temperature. DTR: daily temperature range. HDH: highest daily humidity. ADH: average daily humidity. LDH: lowest daily humidity. DHR: daily humidity range.

 DownLoad:


 Email Alerts
 RSS Feeds