Key Laboratory of Forest Protection of National Forestry and Grassland Administration, National Bird Banding Center of China, Ecology and Nature Conservation Institute, Chinese Academy of Forestry, Beijing, 100091, China
b.
Xingkai Lake National Nature Reserve of Heilongjiang, Jixi, Heilongjiang, 158300, China
Funds: This work was supported by National Key Research and Development Program of China (No. 2019YFA0607103) and the National Forestry and Grassland Administration of China (91217-2022, 202999922001, 213023721203)
The Oriental Stork (Ciconia boyciana) is listed as ‘Endangered’ on the International Union for the Conservation of Nature (IUCN) Red List of Threatened Species and is classified as a first category nationally protected bird species in China. Understanding this species' seasonal movements and migration will facilitate effective conservation to promote its population. We tagged 27 Oriental Stork nestlings at Xingkai Lake on the Sanjiang Plain in Heilongjiang Province, China, used GPS tracking to follow them over the periods of 2014–2017 and 2019–2022, and confirmed their detailed migratory routes using the spatial analysis function of ArcGIS 10.7. We discovered four migration routes during autumn migration: one common long-distance migration route in which the storks migrated along the coastline of Bohai Bay to the middle and lower reaches of the Yangtze River for wintering, one short-distance migration route in which the storks wintered in Bohai Bay and two other migration routes in which the storks crossed the Bohai Strait around the Yellow River and wintered in South Korea. There were no significant differences in the number of migration days, residence days, migration distances, number of stopovers and average number of days spent at stopover sites between the autumn and spring migrations (P > 0.05). However, the storks migrated significantly faster in spring than in autumn (P = 0.03). The same individuals did not exhibit a high degree of repetition in their migration timing and route selection in either autumn or spring migration. Even storks from the same nest exhibited considerable between-individual variation in their migration routes. Some important stopover sites were identified, especially in the Bohai Rim Region and on the Songnen Plain, and we further explored the current conservation status at these two important sites. Overall, our results contribute to the understanding of the annual migration, dispersal and protection status of the endangered Oriental Stork and provide a scientific basis for conservation decisions and the development of action plans for this species.
Climate change is considered one of the most significant threats to biodiversity, and its impact is thought to be particularly great on alpine ecosystems (Liu et al., 2018). The typical warmer and more extended growing season induced by climate change (Pachauri et al., 2014) is not only altering the timing of species' life cycles (Schmid et al., 2017; Forrest et al., 2019) but also leading to range expansion generally to the poles and higher elevations (Chen et al., 2011; Kerr et al., 2015). Such upslope shifting is often associated with an increased risk of extinction (Peters and Darling, 1985; Colwell et al., 2008). Some species generally migrate to higher elevations to avoid snowpacks and warmer summer temperatures. But those taxa already existing at high elevations lack higher habitats to which they can shift away (Loarie et al., 2009; Siegel et al., 2014), thus become more imperiled to climate change than their lowland congeners (Harris et al., 2014; Xu and Grumbine, 2014; Zhang et al., 2021).
In addition, variations in morphology can lead to trait-specific responses to climate change (Williams et al., 2008; Fei et al., 2017; Pacifici et al., 2017). By demonstrating the trade-offs between performance and tolerance (Valladares et al., 2014; Riddell et al., 2019), Bergmann (1848) postulated that endotherms tend to be larger in colder climates compared with warmer habitats, while Allen's rule predicts that the size of appendages of animals increases relative to body size in warmer climates to facilitate heat exchange and thermoregulation (Allen, 1876; Romano et al., 2020). Geographical variation in body and/or appendage size coherent with the above predictions have been observed frequently in many birds. Mariette and Buchanan (2016) found a decrease in nestling mass with increasing nest temperature in the Australian Zebra Finch (Taeniopygia guttata). Other studies in Calidridine sandpipers found a widespread reduction in wing length since the 1980s resulting from a wide-reaching environmental change (van Gils et al., 2016; Anderson et al., 2019). It's thus generally believed that morphological traits are closely related to ecological status and reflect the nutritional demands and maneuverable adaptions of organisms in the changing climate (Piersma and van Gils, 2011).
An impressive number of new climate scenarios have recently become available to assess the ecological impacts of climate change. Among these impacts, shifts in species range analyzed with species distribution models (SDMs) are most widely studied (Crase et al., 2014; Casajus et al., 2016). SDMs project species distribution by examining the relationships between species occurrence points and an impressive number of environmental variables (Synes and Osborne, 2011; Castro et al., 2020; Zhu et al., 2020). These simple models may under-represent complex natural systems (Davis et al., 1998; Pearson and Dawson, 2003; Peterson et al., 2019). Still, they can be regarded as the primary tools for identifying species' 'bioclimate envelope' and extinction risk, evaluating conservation priorities, and assessing reserve designs (Li, 2019). Having identified a species' climate envelope, the application of future climate change scenarios enables the potential redistribution of the species' climate space to be estimated (Pearson and Dawson, 2003).
Qinghai Province (QP) is situated northeast of the Qinghai-Tibet Plateau (QTP). As a traditionally sparsely inhabited region with a variety of different climatic zones and natural habitats, QP provides essential habitats for many rare and endangered animals, such as the Tibetan Antelope (Pantholops hodgsonii), the Przewalski's Gazelle (Procapra przewalskii), the Snow Leopard (Panthera uncia), as well as some raptors. The Upland Buzzard (Buteo hemilasius, UB), Common Kestrel (also known as Eurasian Kestrel Falco tinnunculus, EK), and Saker Falcon (Falco cherrug, SF) are three top predators sympatrically inhabiting the Qinghai Province which frequently require large territories such as plateaus, mountains, and grassland (Tinajero et al., 2017; Zhang et al., 2019). UB is listed as Least Concern by the International Union for Conservation of Nature (IUCN) and is a Category Ⅱ protected species in China. Being widespread in the world, the QTP and the Inner Mongolia Plateau are its mainly distributed area in China (BirdLife International, 2021a). EK is widespread in open countries throughout the Palearctic, Afrotropical, and Oriental regions (Geng et al., 2009), which was listed as a Least Concern species by IUCN and a Category Ⅱ protected species in China. It has a vast but decreasing population size as it suffered from pesticides, shooting agricultural intensification, and habitat degradation (Birdlife International, 2021c). SF occurs widely in the Palearctic region from eastern Europe to western China. It is the only member of its genus to be categorized as Endangered (BirdLife International, 2021b), and a Category I protected species in China. The current estimate of the SF shows a rapid decline due to a range of anthropogenic factors, and the decline rate appears particularly severe in its central Asian breeding grounds (BirdLife International, 2021a).
QTP is known as the "Third Pole" of the world, where the climate fluctuations are more extensive than in other regions of the northern hemisphere (Piao et al., 2006; Liu et al., 2018; Zhang et al., 2021). Some studies have indicated that a positive and direct relationship can be established between the raptors and the richness of other animals and plants in the same domain, making the former "indicators of biodiversity" (Martín and Ferrer, 2013; Burgas et al., 2014; Zhang et al., 2019). However, beyond the extremely limited report evaluating habitat suitability in Sanjiangyuan National Park (Zhang et al., 2019), it is unclear how climate change might affect the potential distributions of the sympatrically key-rare raptors on a larger scale and whether the pattern of their range shifts is consistent with that of morphological characteristics among species.
For the first time, this paper aims to: (1) explore current and future habitat suitability for the three raptor species in QP and formulate species-specific range-shifting patterns under climate change; (2) confirm whether there are morphological variations (both body and appendages size) among species and the potential pattern. The evidence for climate change now seems overwhelming, and smaller endotherms are generally expected to cope better with the gradual warming of the climate because their larger surface area to volume ratios allow more efficient heat dissipation (Gardner et al., 2017). We evaluate the climate envelopes for three raptor species on the one hand. Given that EK is believed to be smaller in both body size and the proportions of its parts, we harvest body size (wing length as a proxy (Fan et al., 2019)) and appendages size (beak depth, beak width, culmen length, tarsus length, and tail length as indicators (Tobias et al., 2022)) measurements from public resources on the other hand. By comparing their different responses towards a changing climate and correlating the variation pattern with morphological difference, we predict that: (1) all three raptor species would shift to habitats with higher altitude and elevation with range contraction in the future; (2) climate change affects EK less than UB and SF, with less range contraction or even range expansion, as its significantly smaller body size and appendages.
2.
Methods
2.1
Species distribution modeling in a changing climate
Among many methods modeling species' distributions, maximum entropy (MaxEnt) models are commonly used since they generate robust results using sparse, irregularly sampled data with minor locational errors (Elith et al., 2006; Kramer-Schadt et al., 2013). Moreover, MaxEnt has the advantage of using presence-only data, avoiding the need for confirmed absence records, making it especially suitable for rare species and/or those with a broader or fragmented range.
2.1.1
Occurrence data and sampling bias
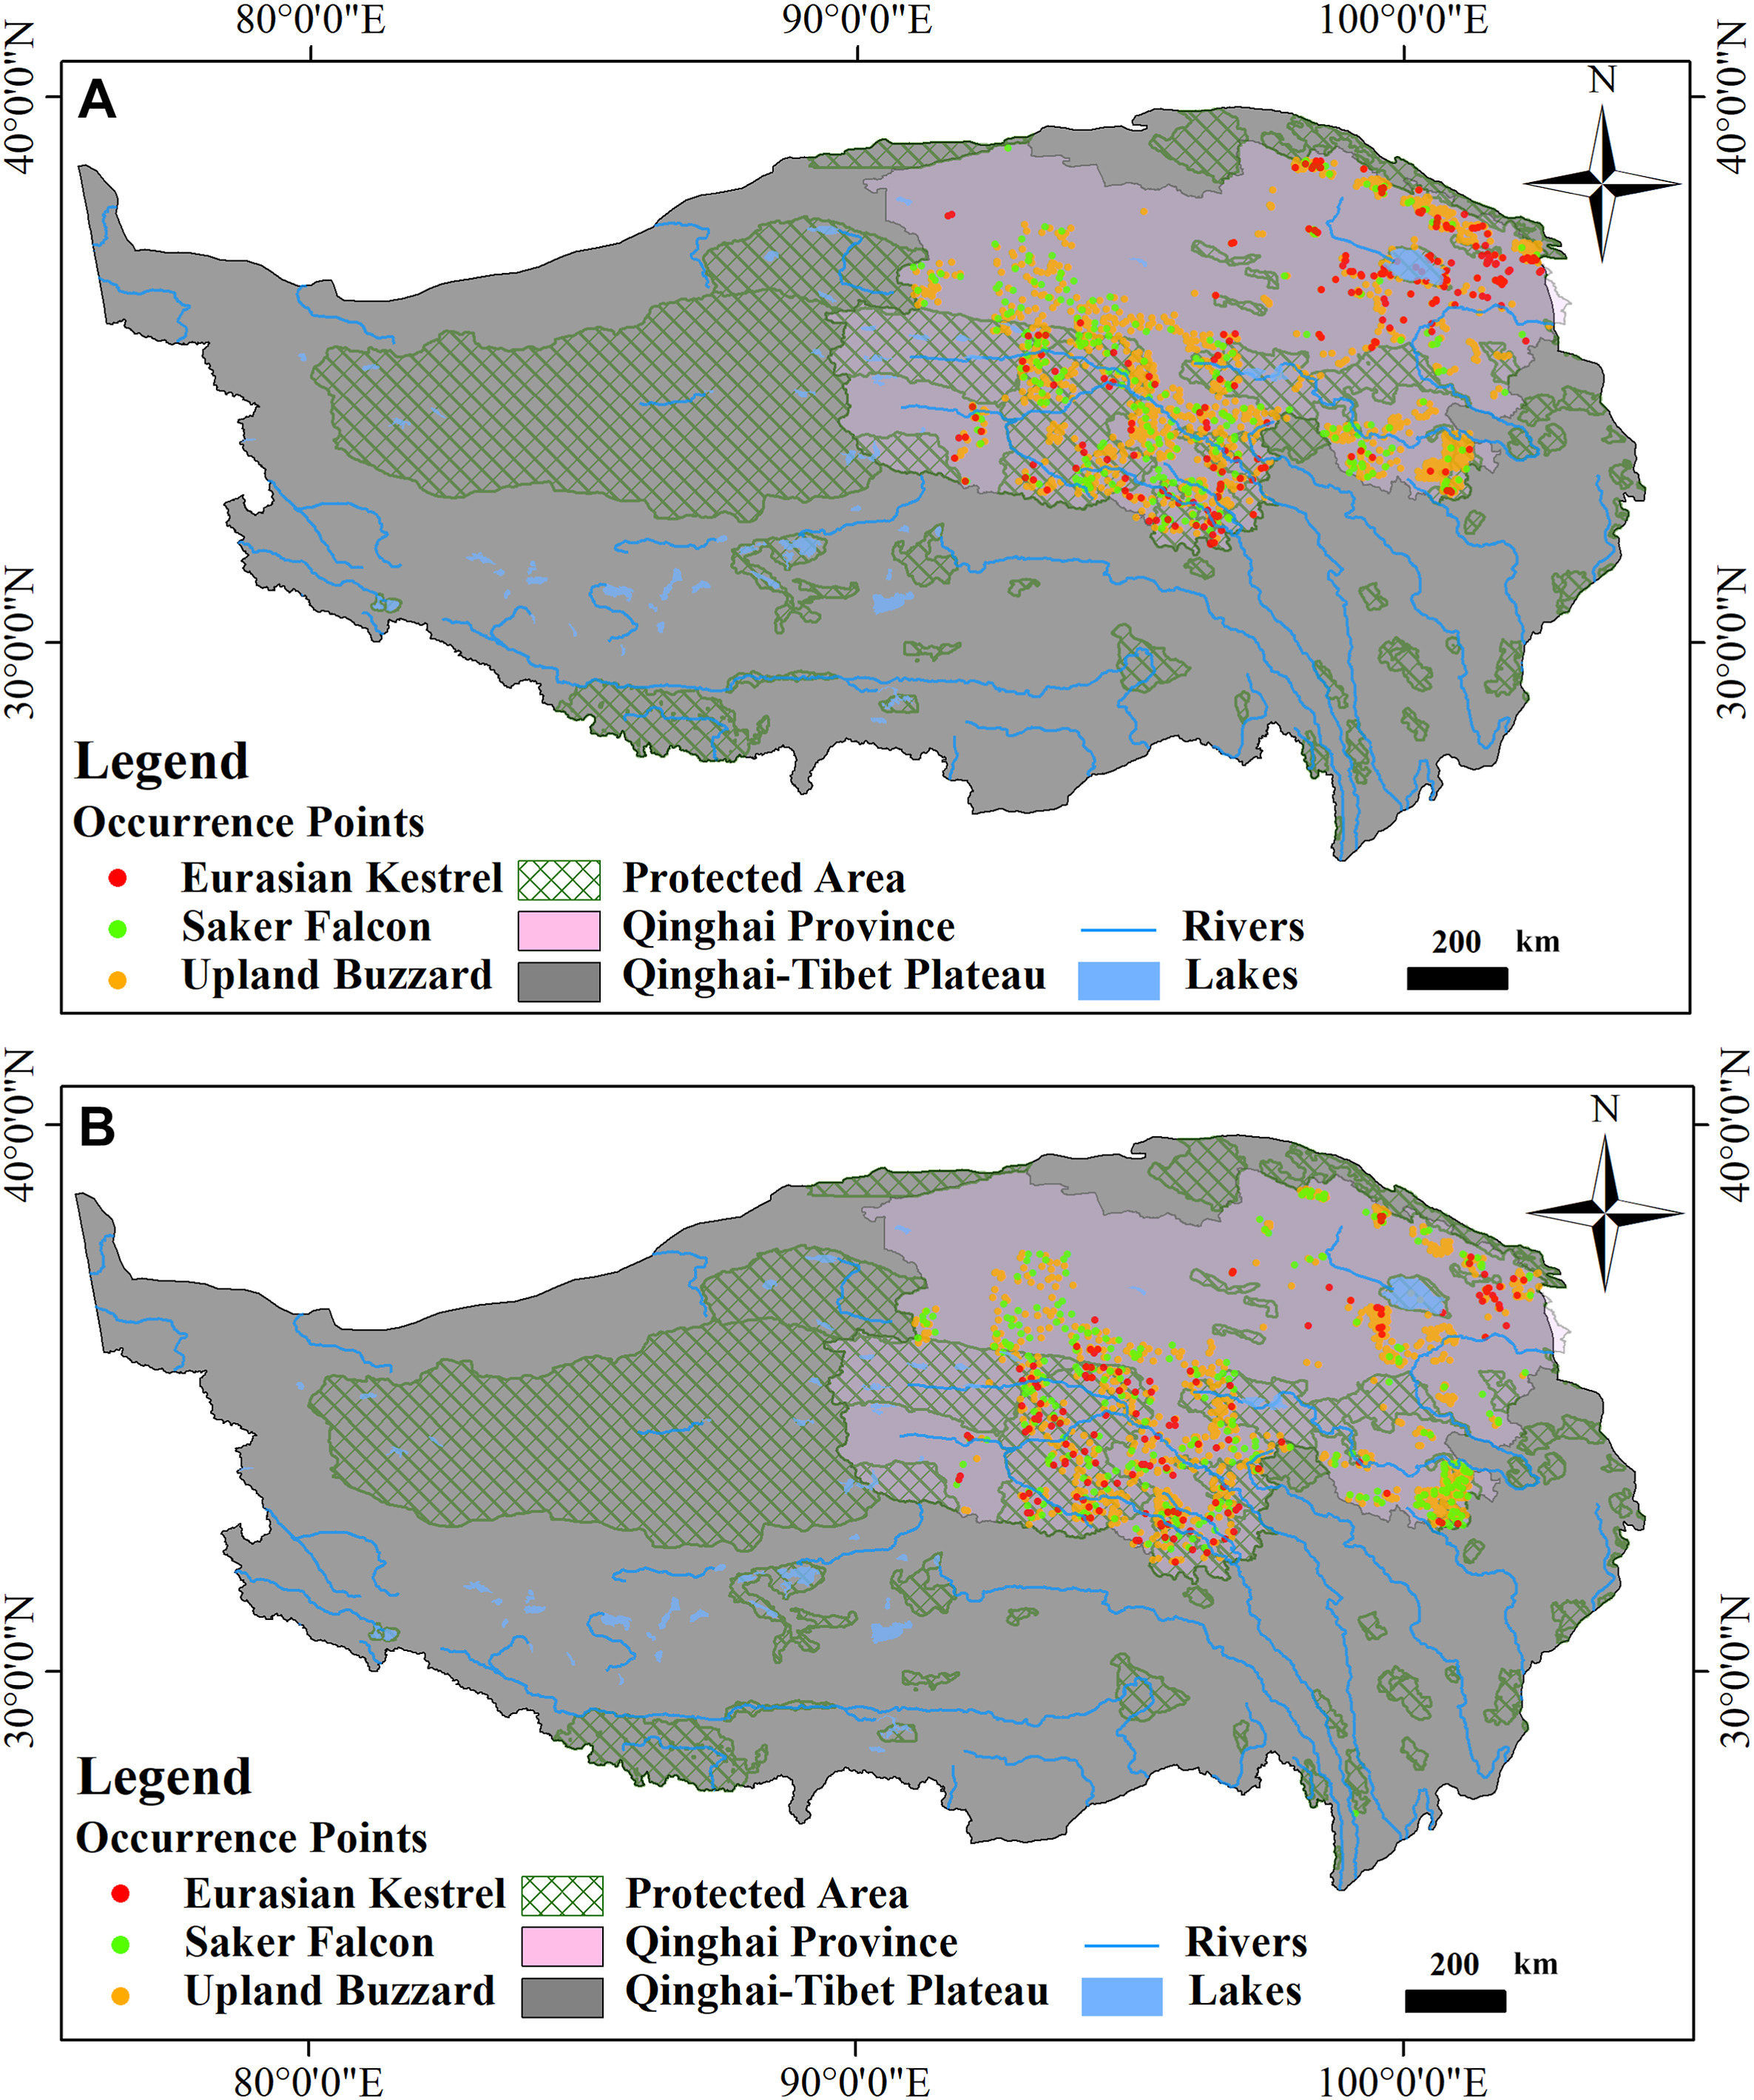
We defined the modeling period as winter (December to February) and summer (June to August). A probability surface for each species was generated based on presence records during the corresponding period (Appendix Table S1) from two primary sources: (1) observe locations in routine biodiversity survey during 2019–2020; (2) occurrence points described elsewhere either from eBird or GBIF citizen sciences databases (https://ebird.org/home; https://www.gbif.org/). We removed the points that are less than 1 km apart with the SDM toolbox Spatially Rarefy Occurrence data for SDMs tool to avoid spatial autocorrelation and kept the remaining points of UB (2119 for the summer, and 1062 for the winter), SF (286 for the summer, and 296 for the winter), and EK (314 for the summer, and 170 for the winter) as spatially filtered presence data for subsequent model operation (Fig. 1).
Figure
1.
Occurrence points of the Common (Eurasian) Kestrel (circles in red), the Saker Falcon (circles in green) and the Upland Buzzard (inverted triangles in orange) during summer (A) and winter (B) in this study after filtering with a radius of 1 km. (For interpretation of the references to colour in this figure legend, the reader is referred to the Web version of this article.)
Considering the potential heterogeneity of survey efforts within the study region, which can severely impact model quality (Phillips et al., 2009) by over-representation of specific environmental features of more accessible and extensively surveyed areas, all the original datasets were spatially filtered to obtain corresponding bias grid with the SDM toolbox Gaussian Kernel Density of Sampling Localities tool implemented in ArcMap 10.2 (ESRI, Redlands, WA, USA). Each bias grid was utilized in MaxEnt as the bias file while modeling.
2.1.2
Environmental variables
Twenty-three raster layers (Table 1) representing three groups of variables (bioclimatic parameters, vegetation, and topographical attributes) potentially related to the habitat suitability of our three studied species were initially selected as candidate variables. We included 19 bioclimatic variables for climate assessment. Dataset averaged for the years 1970–2000 from WorldClim version 2.1 (https://www.worldclim.org/data/index.html) was used as current bioclimate data, while the CMIP6 downscaling future bioclimate variables (https://www.worldclim.org/data/cmip6/cmip6climate.html) were chosen to represent upcoming scenarios at three different stages: 2041–2060 (2050s), 2061–2080 (2070s) and 2081–2100 (2090s) (Eyring et al., 2016). We selected BCC-CSM2-MR as the future climate model since it represents the next generation of BCC-CSM1-1 (Xia et al., 2021), which is one of the most common-used models for simulating climate change in China (Zhang et al., 2018). BCC-CSM2-MR is a medium-resolution climate system model configured for CMIP6, which is fully coupled with the ocean (MOM4-L40), land surface (BCC-AVIM2), atmosphere (BCC-AGCM3-MR), and sea-ice (SIS) components (Wu et al., 2019; Xin et al., 2019). Three Shared Socio-economic Pathways were used to depict the future gradients of emission scenarios (Low: SSP126; Medium: SSP245; High: SSP585).
Table
1.
The environmental variables used in the MaxEnt model indicated by plus sign for the Common Kestrel (Falco tinnunculus), Saker Falcon (Falco cherrug) and Upland Buzzard (Buteo hemilasius) in summer and winter, and their corresponding modelling parameters including regularization multiplier (RM), feature combination (FC), as well as the values of high area under the curve.
Modelling information
Common Kestrel
Saker Falcon
Upland Buzzard
Code
Complete name
Summer
Winter
Summer
Winter
Summer
Winter
Environmental variables
Dem
Elevation above sea level
+
+
+
+
+
+
Aspect
Direction of slope
+
+
+
+
+
+
Slope
Gradient of slope
+
+
+
+
+
+
LC
Landcover
+
+
+
+
+
+
Bio1
Annual mean temperature
Bio2
Mean diurnal range
+
+
+
+
+
+
Bio3
Isothermality
+
+
+
+
+
+
Bio4
Temperature seasonality
+
+
+
Bio5
Max temperature of warmest month
Bio6
Min temperature of coldest month
Bio7
Temperature annual range
+
+
+
Bio8
Mean temperature of wettest quarter
+
+
+
+
+
+
Bio9
Mean temperature of driest quarter
Bio10
Mean temperature of warmest quarter
Bio11
Mean temperature of coldest quarter
Bio12
Annual precipitation
+
Bio13
Precipitation of wettest month
Bio14
Precipitation of driest month
Bio15
Precipitation seasonality
+
+
+
+
+
+
Bio16
Precipitation of wettest quarter
Bio17
Precipitation of driest quarter
Bio18
Precipitation of warmest quarter
+
+
+
+
+
+
Bio19
Precipitation of coldest quarter
+
+
+
+
+
+
Modeling parameters
RM
Regularization multipliers
4
1
4
4
1
1
FC
Feature combinations
L†Q‡H§
LQHP¶
LQHPT#
LQHPT
LQHPT
LQHPT
High area under the curve
AUC
Currently
0.895
0.869
0.848
0.847
0.814
0.843
2050
0.902
0.864
0.853
0.851
0.816
0.843
2070
0.895
0.867
0.856
0.851
0.800
0.842
2090
0.892
0.866
0.849
0.858
0.810
0.842
Notes: For the abbreviation of FC, † stands for linear, ‡ stands for quadratic, § stands for hinge, ¶ stands for product, and # stands for threshold.
Land use and topographical attributes were also considered in the study. The Climate Change Initiative LC dataset (CCI-LC) from ESA (https://maps.elie.ucl.ac.be/CCI/viewer/download.php#ftp_dwl; 1992–2015; 300 m resolution) was used as a categorical variable of current vegetation type. The future land use data corresponding to the upcoming climate scenarios were obtained from the projected global gridded land cover dataset (https://data.pnnl.gov/group/nodes/dataset/13192) at 0.05-degree resolution. Slope and aspect were extracted from an ASTER GDEM V2 30 m resolution digital elevation model (DEM; 2000–2009; http://www.gscloud.cn/) using the Surface Analyst Tool of ArcGIS 10.2 (ESRI). To reduce multicollinearity, we calculated Pearson's correlation (r) between each variable pair for 6000 random points from throughout the geographical range. Tightly correlated (r > 0.80) and redundant variables were removed, favoring those more temporally inclusive, while the remaining variables were incorporated into the model (Table 1).
2.1.3
Habitat distribution modeling
We chose MaxEnt version 3.3.3k (Phillips et al., 2006) for SDMs for two main reasons. Firstly, we are constrained to use a presence-only modeling approach because most of our records were collected with unknown sampling effort. Hence, it is impossible to incorporate covariates that account for heterogeneity in detectability, effort, and reporting (duration spent searching for birds, start time, distance travelled, etc.) when constructing SDMs (Johnston et al., 2019). Secondly, MaxEnt is documented to outperform other presence-only modeling approaches (Townsend Peterson et al., 2007; Ruan et al., 2018).
MaxEnt can produce higher quality output if we optimize or adjust the model settings (sometimes called "smoothing") instead of the default settings to estimate the optimal model complexity (Anderson and Gonzalez, 2011; Warren and Seifert, 2011). Feature combination (FC) and regularization multiplier (RM) are critical parameters. We constructed models by applying alternate FCs (e.g., L – linear; LQ – linear and quadratic; H – hinge; LQH – linear, quadratic and hinge; LQHPT – LQH, product, and threshold; LQHP) and RMs ranging from zero to 15.0 at one interval. The ENMeval R package (Muscarella et al., 2015; R Core Team, 2019) was used to evaluate the complexity of the model by testing the AIC values (AICc) under different parameter conditions (Hope et al., 2016).
The suitability maps were drawn using the logistic output of MaxEnt, and the logical habitat suitability index (HSI) we obtained is from the lowest "0" to the highest "1". According to related studies, we divided the HSI maps into four grades: 0–0.25 is unsuitable; 0.25–0.50 is low; 0.50–0.75 is moderate; and 0.75–1 is high (Kassara et al., 2017; Jha and Jha, 2021).
2.1.4
Distribution change and nature reserve effectiveness
We projected the final MaxEnt model onto spatial data for each climate scenario to assess current and future habitat suitability. Continuous HSI maps were converted into binary layers indicating suitable and unsuitable habitats. The logistic threshold was applied to cut off and convert the HSI maps (0 = unsuitable, 1 = suitable), assuming the maximum test sensitivity plus specificity (Zhang et al., 2021).
The maintenance, expansion (range gain, RG), or reduction (range loss, RL) of habitat suitability was calculated for each species during the two seasons under different climate scenarios. The percentage of predicted future range change (C) by cell was also estimated according to del Río et al. (2021) as follows:
C=RG−RLPR×100
where RG is the number of grid cells projected currently as being unsuitable but suitable in a future scenario, RL is the number of grid cells projected as suitable under current conditions but unsuitable in the future; and PR (present range) is the number of grid cells projected as suitable under present conditions. A positive C value means an increase in overall range size, and a negative value indicates a loss.
Moreover, we calculated the longitude, latitude, and elevation of each cell of potential presence, and compared their average values during the two seasons under different climate scenarios for three raptor species. Lastly, to assess the conservation status at the prediction area, we downloaded the boundary information from the National Nature Reserves of China (https://www.resdc.cn/data.aspx?DATAID=272). We overlaid prediction layers with ArcGIS 10.2 (ESRI) to identify which pixels were located within protected area boundaries in QP.
2.2
Morphological variation among species
We harvested the comprehensive functional traits dataset for all three raptors from the AVONET dataset raised by Tobias et al. (2022). Our dataset includes six continuous morphological features (beak depth, beak width, culmen length, tail length, tarsus length, wing length) and two derivative indices (hand-wing index, relative bill surface area). The hand-wing index has been regarded as an estimate of wing shape widely adopted as a proxy for dispersal ability in birds, which proved to be predictive for geographical range size (Sheard et al., 2020). The relative bill surface area (Onley et al., 2020) was chosen since heat loss from blood flow within the bill can be substantial (Greenberg and Danner, 2012). Raw morphological measurements are presented from 22 individuals of three species.
To assess morphological variation among species, we applied nonparametric Kruskal–Wallis analyses of variance to six morphological traits and two other derivative indices. We then used Dunn's test to assess post hoc pairwise differences. All the statistical analyses were performed in the R statistical computing environment v4.0.5 (R Core Team, 2019).
3.
Results
3.1
Species distribution modeling in a changing climate
3.1.1
Model performance and important environmental variables
Spatial biases were detected in both seasons for all three raptors. The sampling intensity for EK was highest in the extreme northeastern area from Qinghai Lake to Menyuan Hui Autonomous County via Datong Hui and Tu Autonomous County within the summering range, while elsewhere appeared in the Source Region of the Yangtze River as well as the Source Region of the Lancang River in the winter (Appendix Fig. S1) within the Sanjiangyuan National Nature Reserve (SNNR). The sampling locations were within the SNNR for SF, but the hotspots in the upland region of the Tibetan Autonomous Prefecture of Golog differed slightly in the two seasons. The sampling sites of UB were inclined to SNNR and the Tibetan Autonomous Prefecture of Golog. At the same time, Qinghai Lake and its surrounding areas are other common areas of this species in the winter (Appendix Fig. S1).
All the spatial biases mentioned above in observations were translated into environmental preference by providing the bias grid as an "environmental covariate" to MaxEnt when constructing the summering/wintering SDMs. After spatial autocorrelation analysis, the environmental variables commonly retained were as follows: landcover (LC), all three topographical attributes (DEM, Aspects, Slope), and six bioclimatic variables (Bio2, the mean diurnal range; Bio3, the isothermality; Bio8, the mean temperature of the wettest quarter; Bio15, the precipitation seasonality; bio18, the precipitation of warmest quarter; Bio19, the precipitation of coldest quarter). We derived the AUC values of the three studied species in different time stages from the MaxEnt model (Table 1). Our results showed that the AUC values ranged from 0.800 to 0.902, representing moderate reliability.
3.1.2
Current distribution range
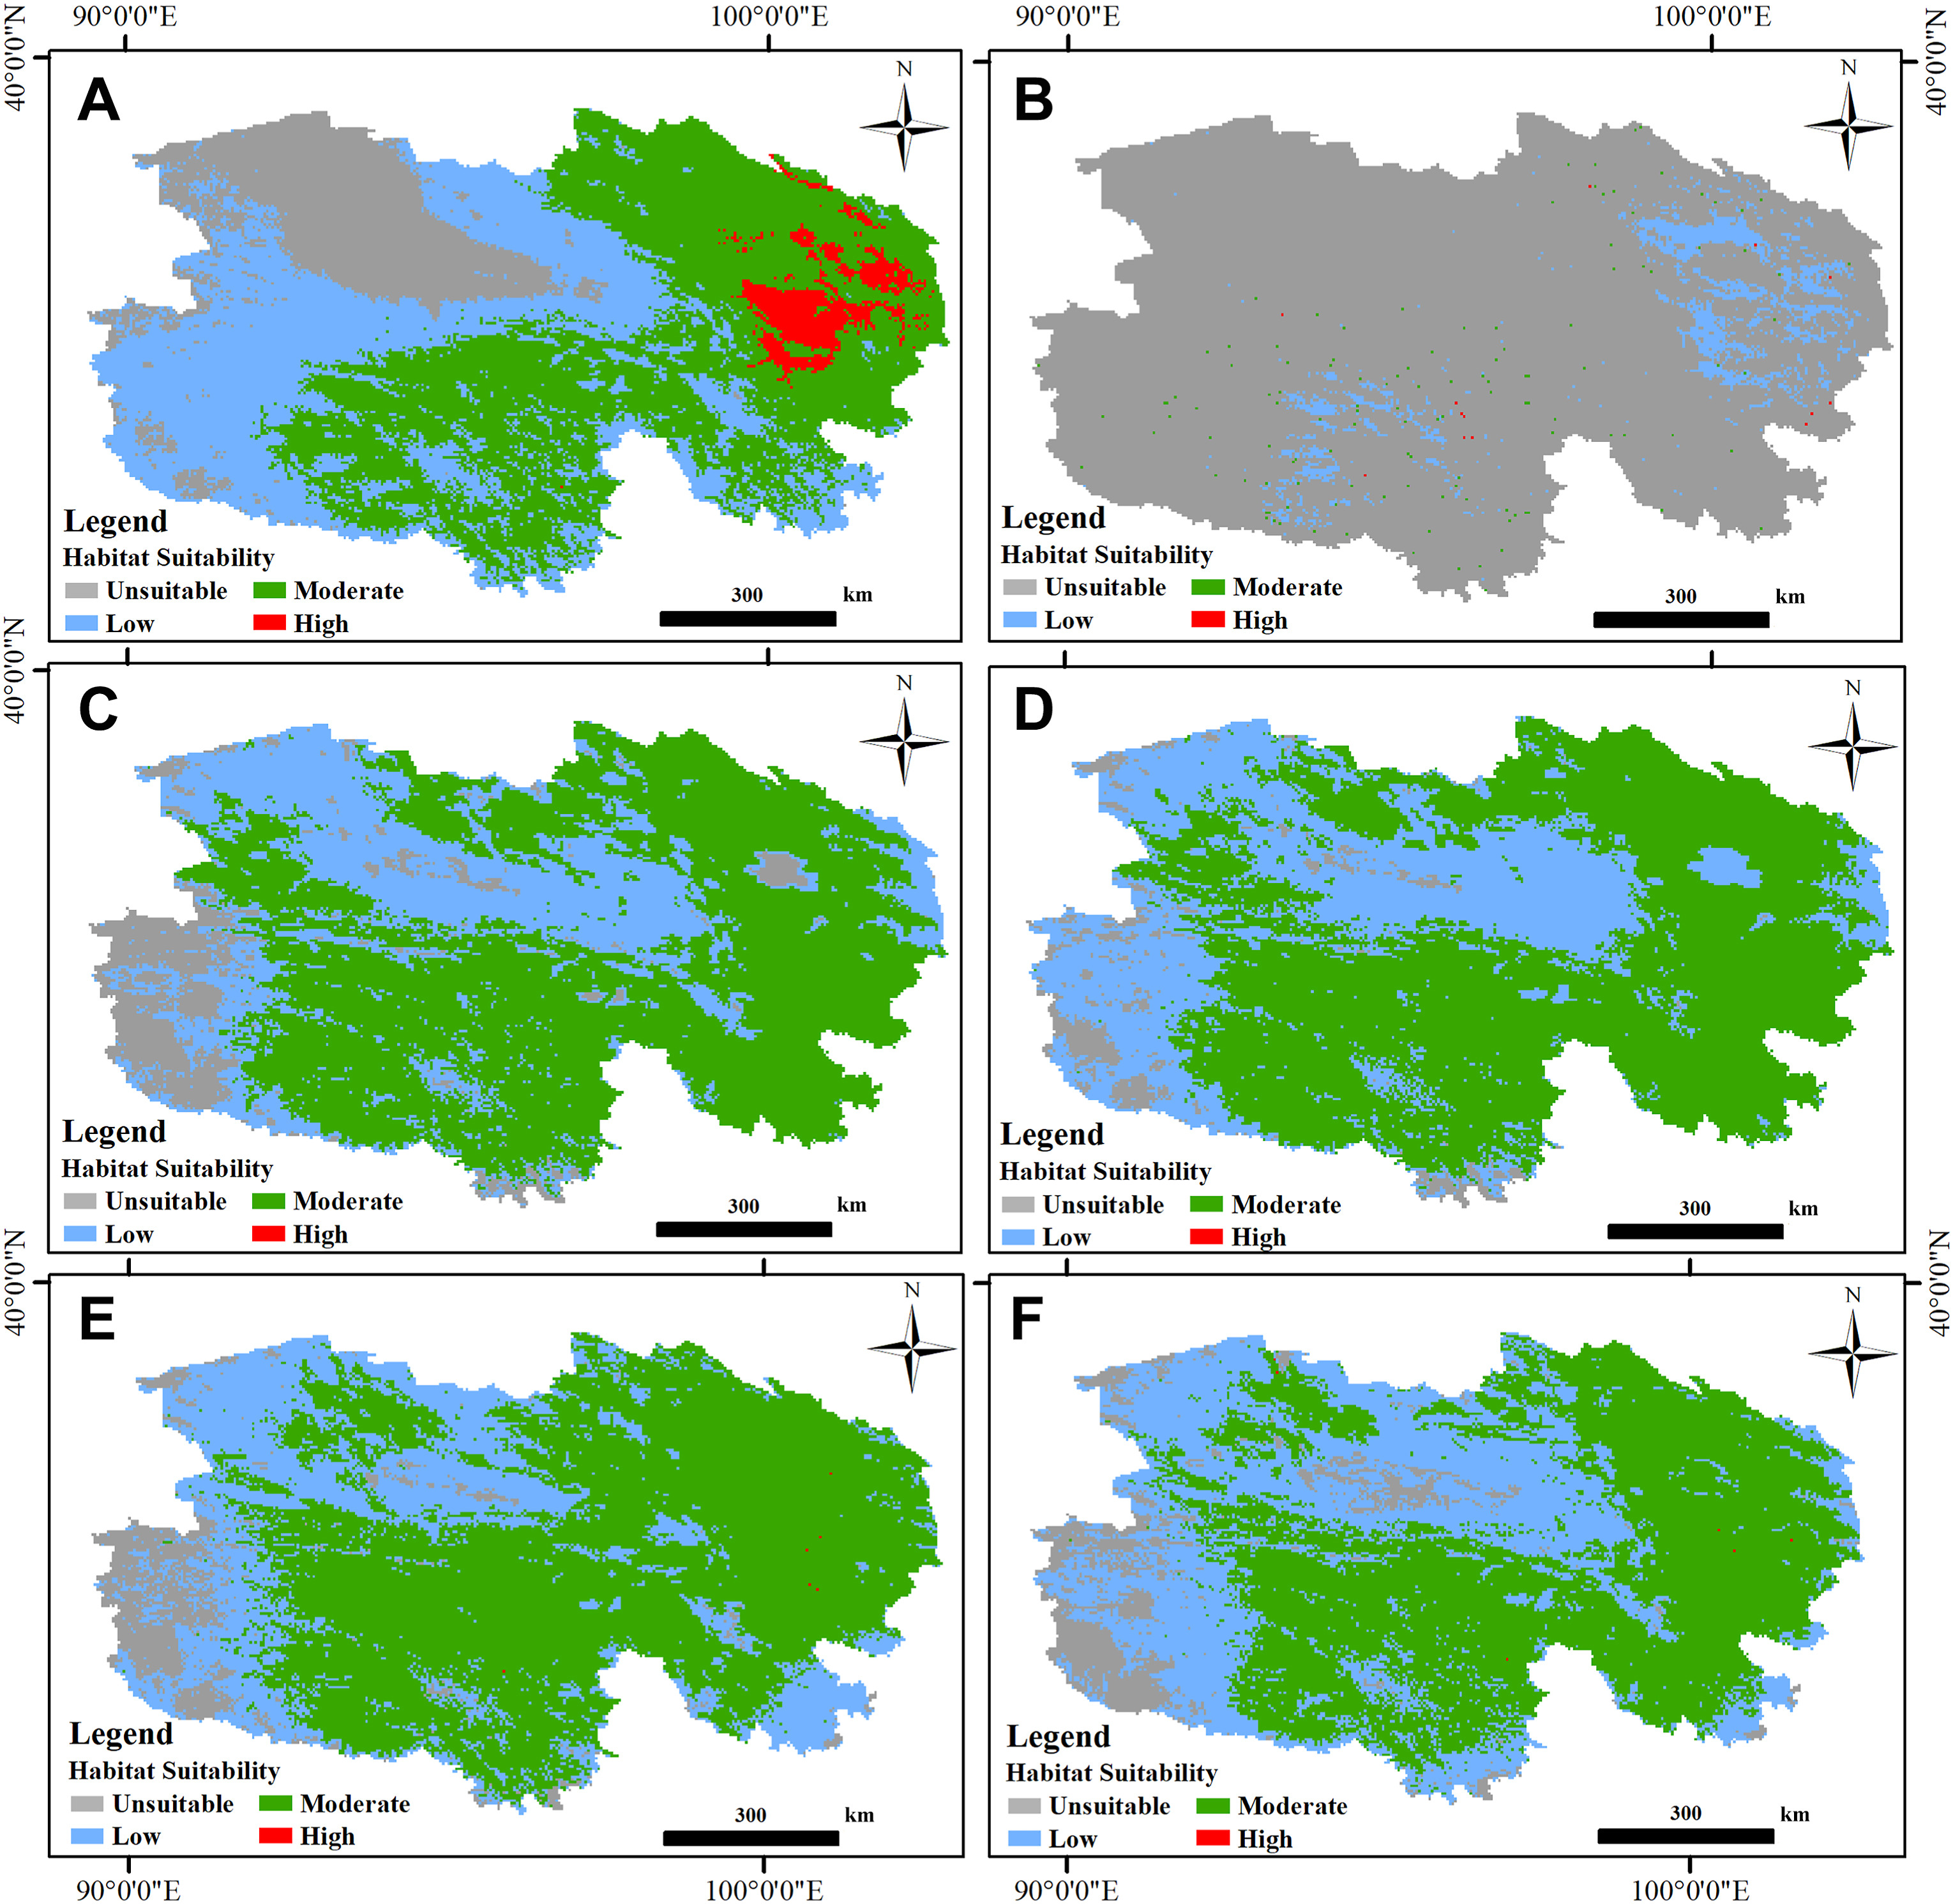
Based on model prediction results, the prospective highly suitable habitats for all three studied raptors were tiny in the Qinghai Province, which ranged from 0.01% to 3.43% (Fig. 2; Table 2), and mainly situated around the Qinghai Lake and its adjacent SNNR region, especially for EK and the UB. Sporadic areas elsewhere were found in the Source Region of the Yangtze River and the Lancang River in Yushu City (Fig. 2). All three species rarely appeared in Tsaidam Basin in the northwest, as well as the connecting areas between the Qinghai Hoh Xil and the Tanggula Pass in the southwest.
Figure
2.
Current habitat suitability index (HSI) map of the Common Kestrel (Falco tinnunculus; A, B), Saker Falcon (Falco cherrug; C, D) and Upland Buzzard (Buteohemilasius; E, F) in Qinghai Province within Qinghai-Tibet Plateau derived from MaxEnt modeling for the summering (panels in the left) and wintering (panels in the right) period.
Table
2.
Current habitat suitability of the Common Kestrel (Falco tinnunculus), Saker Falcon (Falco cherrug) and Upland Buzzard (Buteo hemilasius) in Qinghai Province derived from prediction results of MaxEnt modeling.
Species
Season
Habitat Suitability
Unsuitable (0–0.25)
Low (0.25–0.5)
Moderate (0.5–0.75)
High (0.75–1)
Grids' count
Area percentage
Grids' count
Area percentage
Grids' count
Area percentage
Grids' count
Area percentage
Common Kestrel
Summer
6386
0.1591
14,894
0.371
17,483
0.4355
1378
0.0343
Winter
36,738
0.9152
2169
0.054
119
0.003
1115
0.0278
Saker Falcon
Summer
3522
0.0877
12,534
0.3122
24,082
0.5999
3
0.0001
Winter
1589
0.0396
13,882
0.3458
24,666
0.6145
4
0.0001
Upland Buzzard
Summer
2610
0.065
12,333
0.3072
25,193
0.6276
5
0.0001
Winter
3102
0.0773
15,891
0.3959
21,143
0.5267
5
0.0001
Percentage of occupied area by the four suitability categories (as represented inside the brackets) were indicated in italic.
3.1.3
Species range shift and protecting the status
According to model projection results, the highly prospective suitable habitats in the future for EK in the summer were mainly located around the Qinghai Lake and its adjacent SNNR region (Appendix Fig. S2). On the other hand, this species hardly occurred in QP in the winter, as illustrated by Appendix Fig. S3. The SF had almost no highly suitable habitats in QP in the future in both seasons, where its moderately suitable habitats were projected within the regions between the Qilian Mountains and the northeastern border of the Tsaidam Basin, as well as the most parts of the SNNR (Appendix Figs. S4 and S5). The UB was predicted as widespread in both seasons in QP apart from the connecting areas between the Qinghai Hoh Xil and the Tanggula Pass in the southwest and the Tsaidam Basin in the northwestern side (Appendix Figs. S6 and S7). The exceptionally highly suitable habitats for this species were predicted around the northeastern part of the SNNR, with the broader range occurring in the summer.
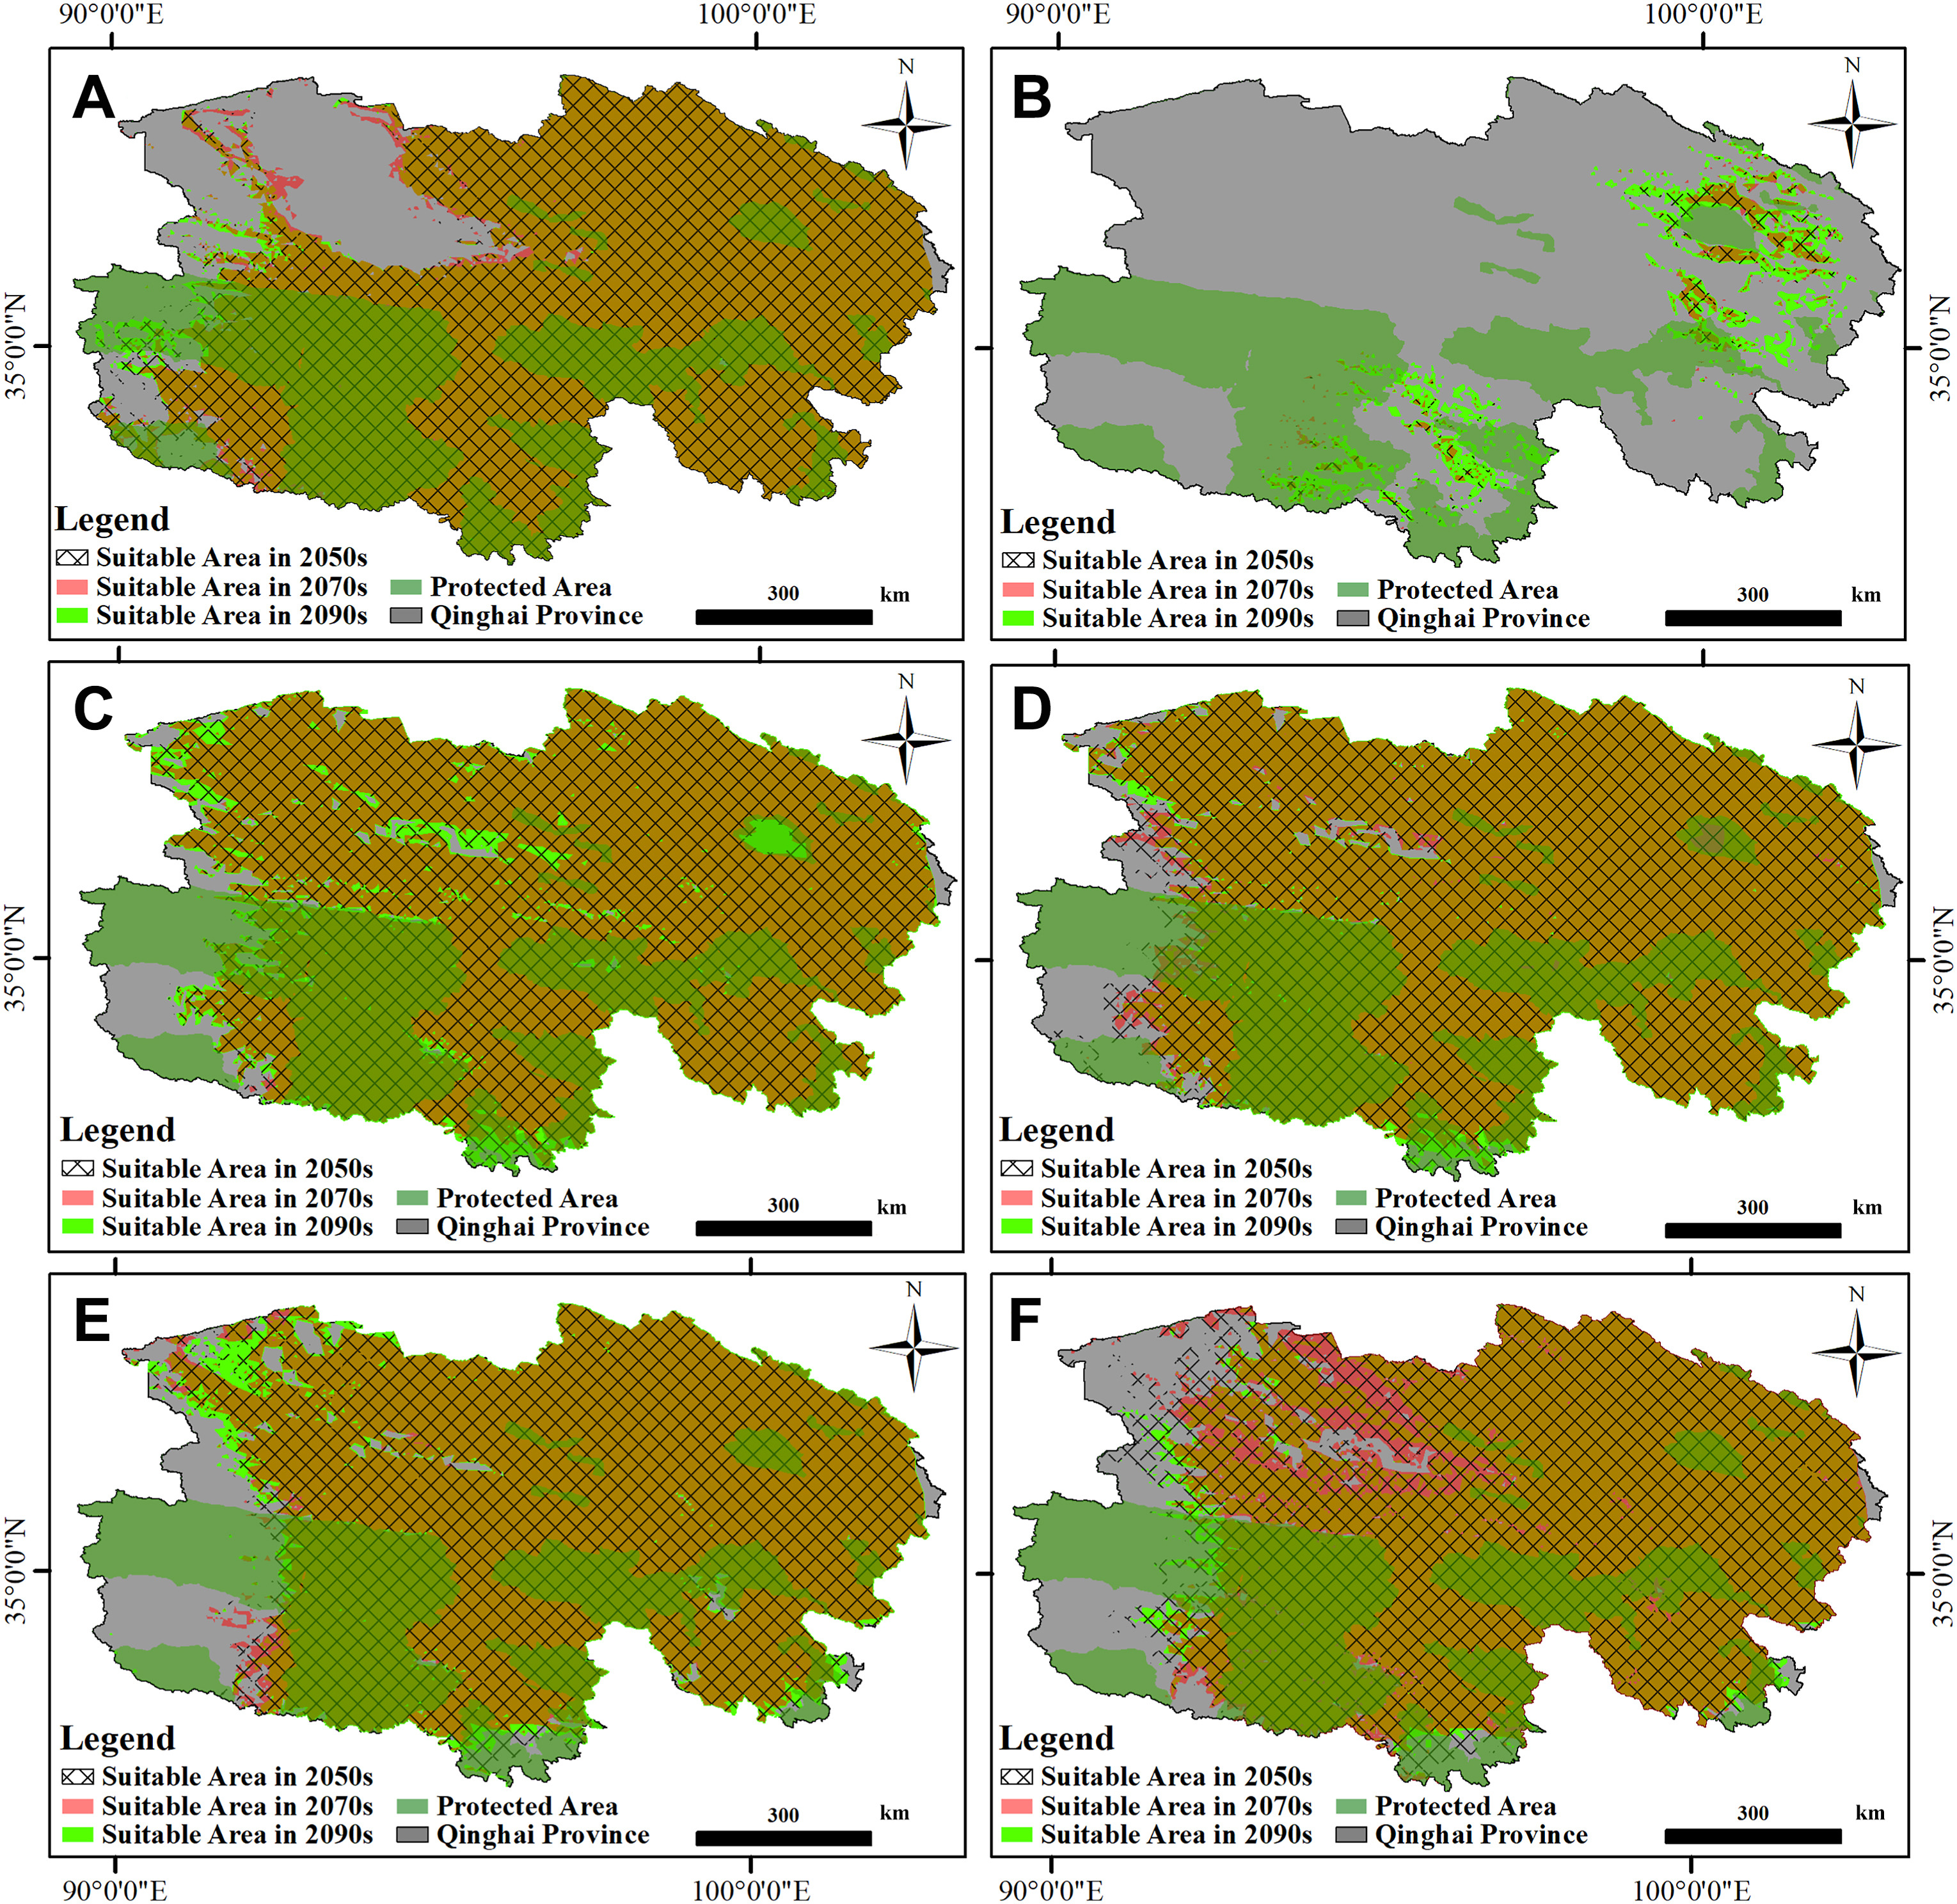
Newly suitable habitats emerged around the border of the Tsaidam Basin, especially at the northwest and northeast part for EK in the summer of 2070s; in comparison, these former suitable areas disappeared in the 2090s, with new habitats at the western part of the Qinghai Hoh Xil, the Zhiduo County in Yushu Tibetan Autonomous Prefecture, and the Mangya Town in northwestern Haixi Mongolian and Tibetan Autonomous Prefecture. However, this species gained potentially new habitats in the winter, basically around Qinghai Lake and its adjacent SNNR, as well as the connecting area between the Source Region of the Yangtze River and the Source Region of the Lancang River. SF was primarily predicted to expand westward till the Mangya Town in northwestern Haixi Mongolian and Tibetan Autonomous Prefecture and the middle part of the Tsaidam Basin in the summer of 2090s. In comparison, as suggested, these newly potential habitats were listed as unsuitable in the 2070s. The suitable areas in the winter remained almost the same for SF except for those regions in the extremely northwestern border, which were predicted to gain back. In contrast, those in the south were expected to disappear. UB was predicted to expand its summering edge in the southwestern side in the 2070s while in the northwestern section in the 2090s. However, this species was likely to lose its potential habitats along the eastern edge of the Qinghai Hoh Xil Mountains and Kunlun Mountain in the 2070s. In comparison, it largely disappeared from the Tsaidam Basin in the 2090s (Fig. 3).
Figure
3.
Common suitable area for the Common Kestrel (Falco tinnunculus; A, B), Saker Falcon (Falco cherrug; C, D) and Upland Buzzard (Buteo hemilasius; E, F) among three different emission scenarios (Low: SSP126; Medium: SSP245; High: SSP585) for the summering (panels in the left) and wintering (panels in the right) period at three stages in the future in Qinghai Province. Black cross-hatch = 2041–2060 (2050s), red shading = 2061–2080 (2070s), bright green shading = 2081–2100 (2090s). Orange shading = overlaying between red and bright green shading. Protected areas within Qinghai Province were indicated by dark green shading. (For interpretation of the references to colour in this figure legend, the reader is referred to the Web version of this article.)
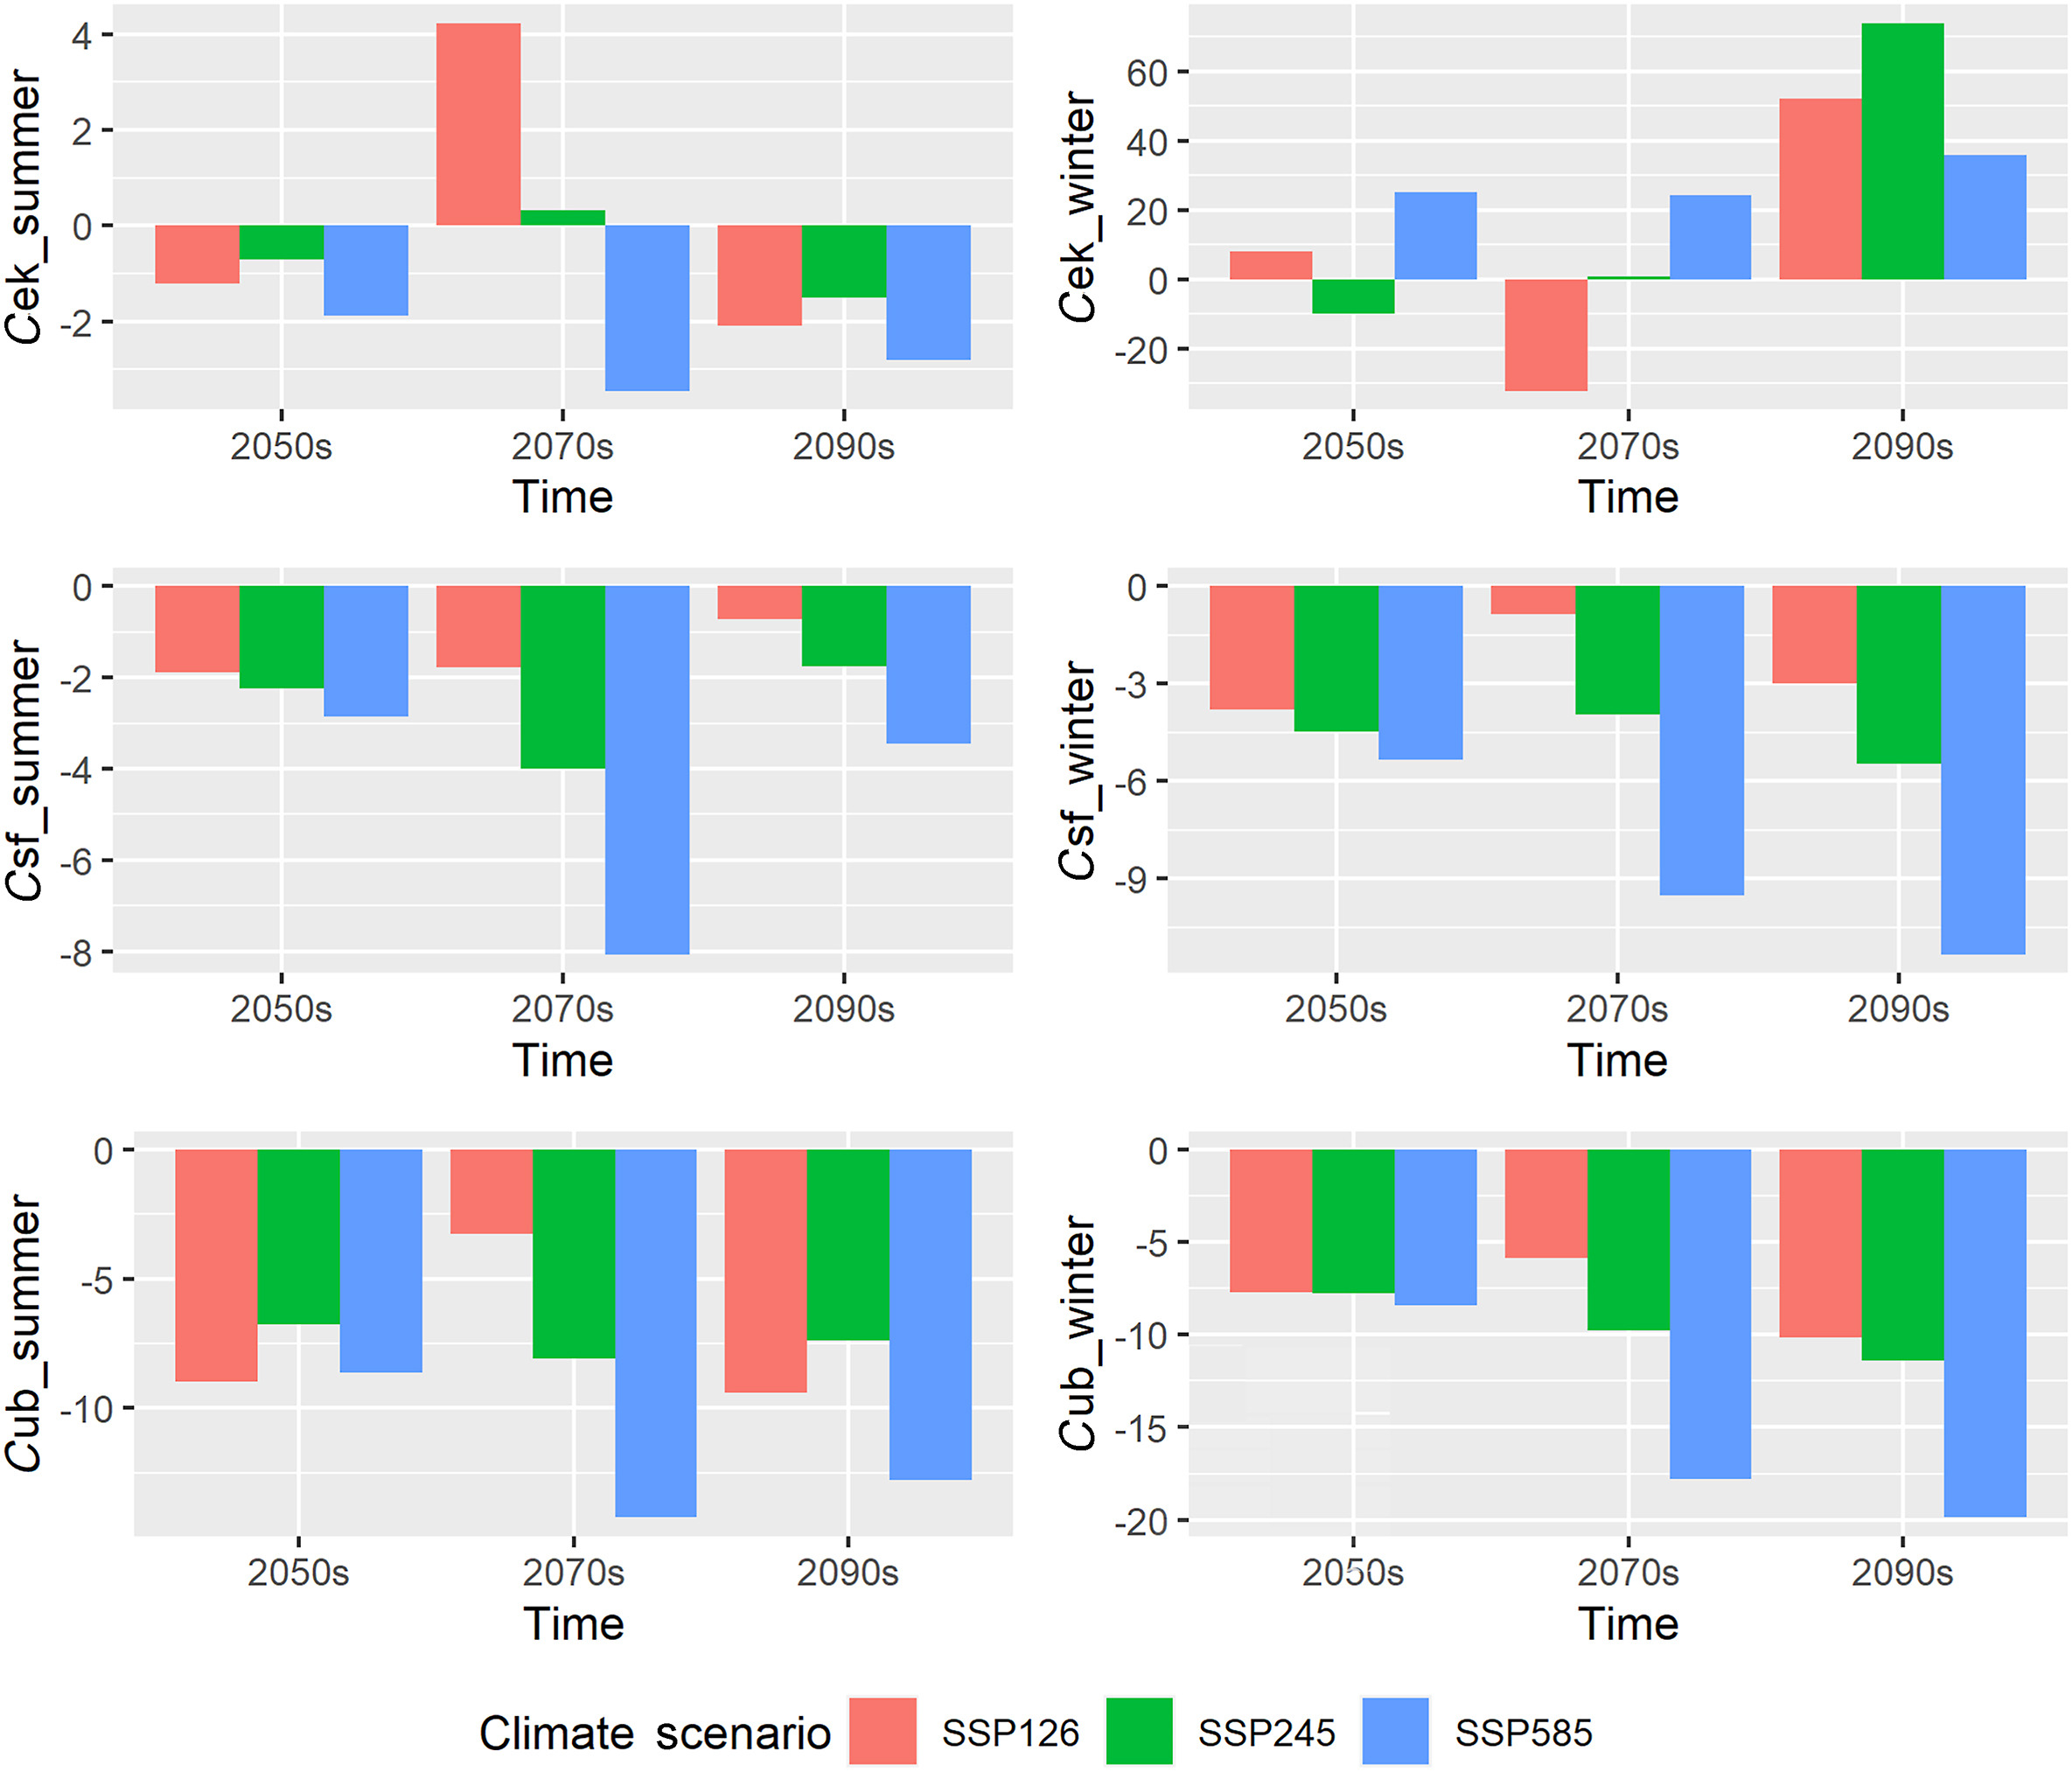
The percentage of predicted future range change (C) for three raptors were expected to be always negative at most time and seasons and increases with the levels of climate/emission (Fig. 4). The C values for EK ranged from −4.45 in the 2070s under SSP585 to 4.24 in 2070s under SSP126 in the summer and from −32.19 in 2070s under SSP126 to 73.92 in the 2090s under SSP245 in the winter. The C values for SF ranged from −8.07 in the 2070s under SSP585 to −0.72 in 2090s under SSP126 in the summer, while from −11.33 in 2090s under SSP585 to −0.85 in 2070s under SSP126 in the winter. The same index for UB ranged from −14.24 in the 2070s under SSP585 to −3.26 in 2070s under SSP126 in the summer and from −19.88 in 2090s under SSP585 to −5.87 in 2070s under SSP126 in the winter. The predicted suitable habitats of the three species reduced farthest under SSP585 (worst case scenario).
Figure
4.
The percentage of predicted future range change (C) for the Common Kestrel (Falco tinnunculus; abbreviated with ek before the underline), Saker Falcon (Falco cherrug; abbreviated with sf before the underline) and Upland Buzzard (Buteo hemilasius; abbreviated with ub before the underline) derived from prediction results of MaxEnt modeling for the summering (with summer after the underline) and wintering (with winter after the underline) period under three different climate/emission scenarios (SSP126, indicated by red bars; SSP245, indicated by green bars; SSP585, indicated by blue bars) in the future in Qinghai Province within Qinghai-Tibet Plateau at three stages (2050s: 2041–2060; 2070s: 2061–2080; 2090s: 2081–2100). (For interpretation of the references to colour in this figure legend, the reader is referred to the Web version of this article.)
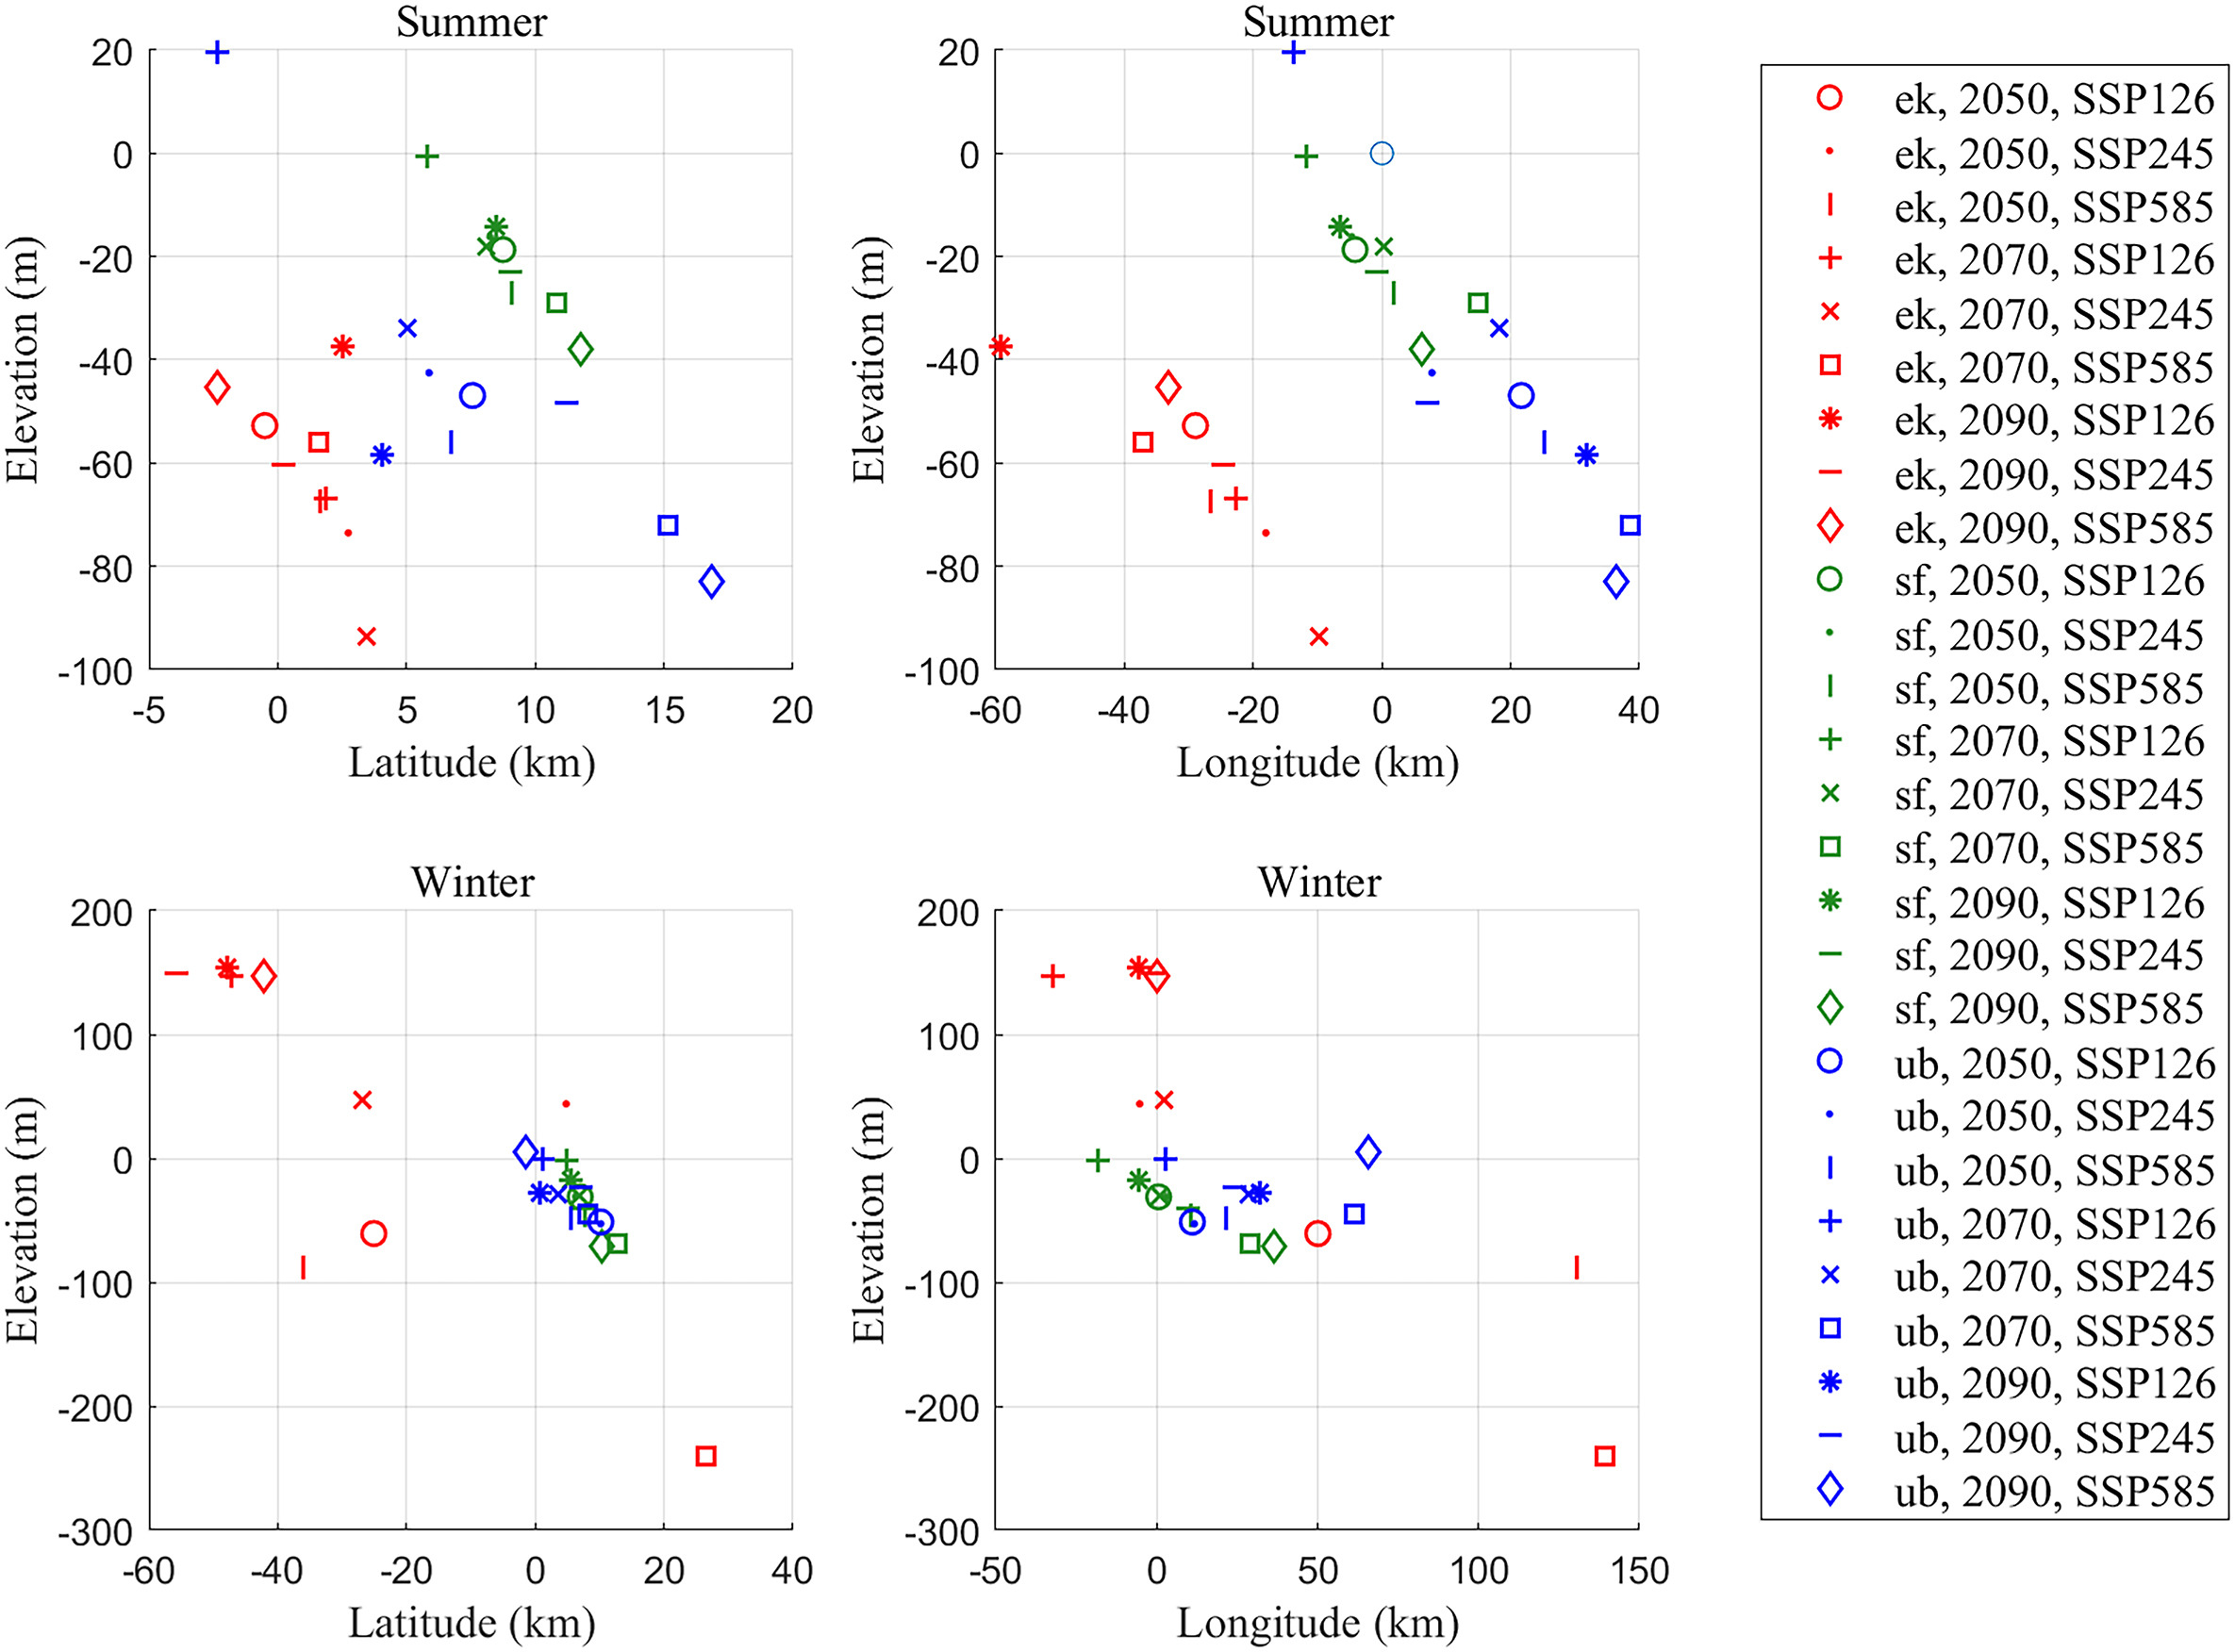
For most scenarios, the models suggest that there will be shifts in suitable climates to lower elevations (46/54), especially in the summer (26/27; Fig. 5). Moreover, appropriate climate spaces for UB, as well as the SF, were predicted to shift northeastward in latitude regardless of the seasons on most occasions (34/36). However, the magnitude of the predicted shifts varies among different scenarios. For instance, the mean elevation shift in suitable habitats always reaches the maximum under SSP585 for both UB and SF. Still, the maximum value of the former species is twice that of the latter in the same period.
Figure
5.
Changes in mean elevation, mean latitude, and mean longitude during the two seasons under different climate change projections (different shapes) for three raptor species (different colours, ek stands for the Common Kestrel (Falco tinnunculus), sf stands for the Saker Falcon (Falco cherrug), ub stands for the Upland Buzzard (Buteo hemilasius)) in Qinghai Province within Qinghai-Tibet Plateau. (For interpretation of the references to colour in this figure legend, the reader is referred to the Web version of this article.)
We also calculated the ratio of highly suitable habitats (RHA), high-moderately suitable habitats (RHMA), and the protecting high-moderately suitable habitats (PRHMA) for three raptors in the future. We compared them with each other under different concentrations and years. The RHAs were extremely low, with a maximum value of less than 5%, almost lying below 1% (36/45; Appendix Figs. S8 and S9). Although the RHMAs were always around 60%, the PRHMAs all ranged from 30% to 40% unexceptionally. No obvious pattern was found for the change of RHMA along time series in the summer for specific species, but it consistently decreased over time for the SF and UB in the winter (Appendix Figs. S8 and S9). Notably, the RHMA values were lowest under the SSP585 emission scenario in most of our investigated cases (11/15), especially for SF (all six-year-climate scenario combinations) and UB (4/6).
3.2
Assessment of morphological variation among species
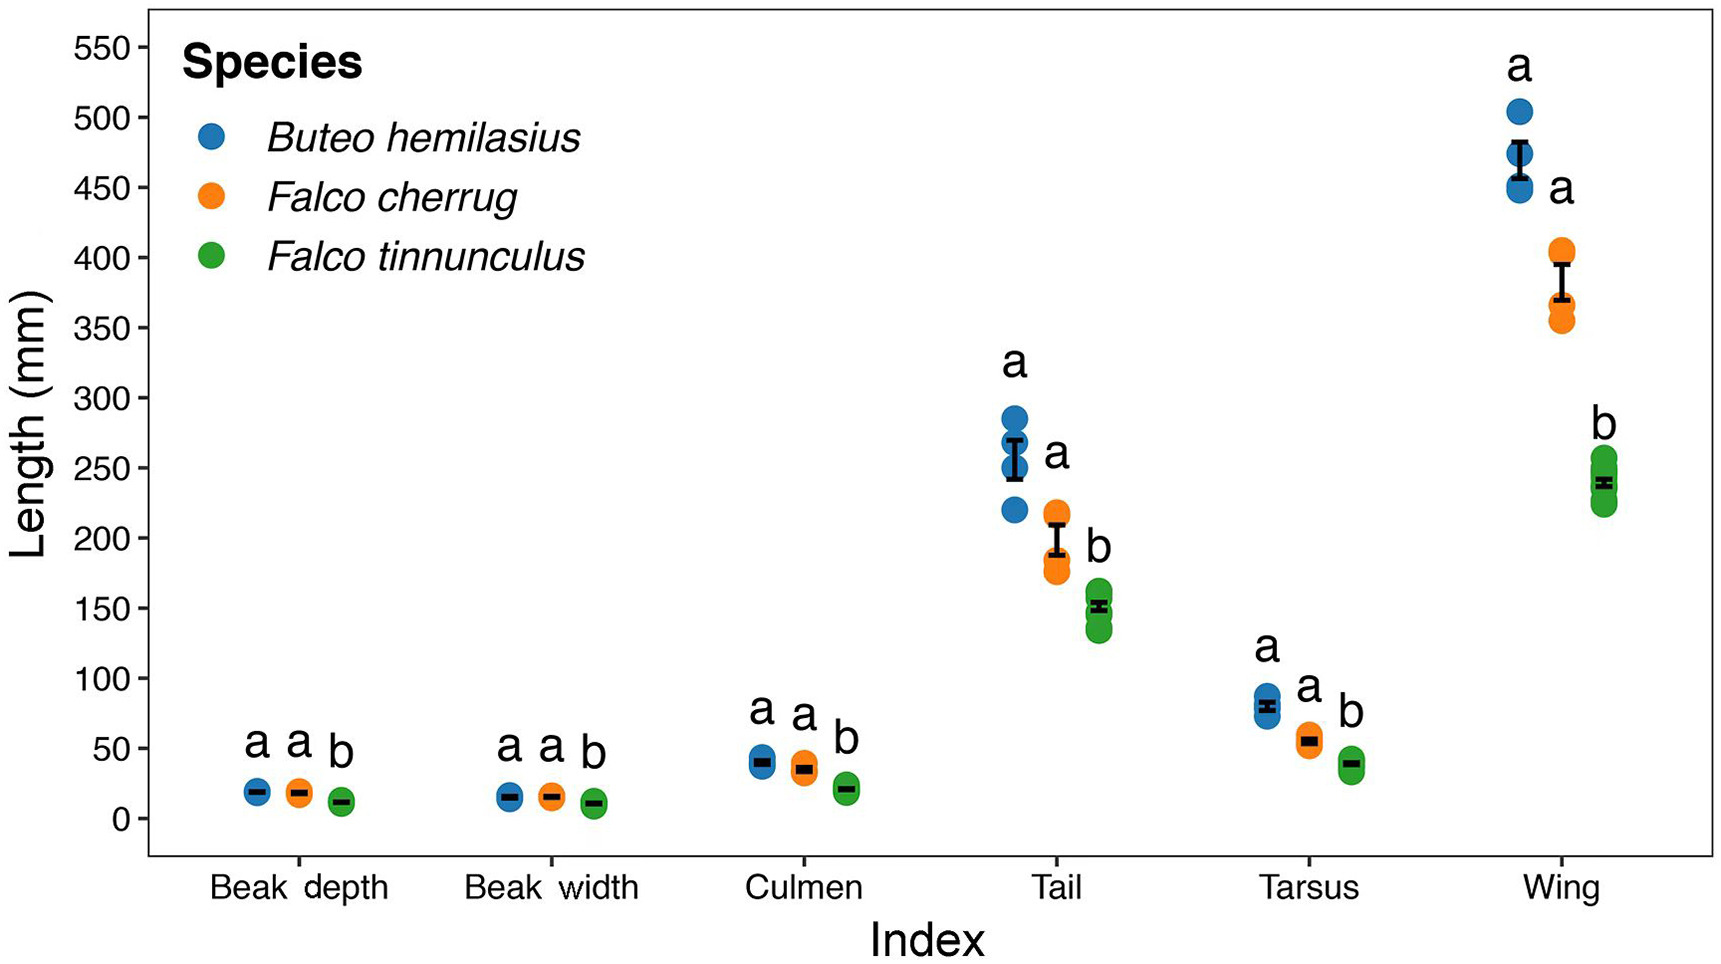
EK had the smallest measurements for all six morphological traits at a significant level (Fig. 6). UB always had the biggest measurement values but similar to SF. The hand-wing index and relative bill surface area were significantly smaller for EK than the UB, while SF seems to have intermediate values for both (Table 3).
Figure
6.
Boxplot of morphological variation among species for six traits (beak depth, beak width, culmen length, tail length, tarsus length, wing length), with three colours indicate three species (the Common Kestrel (Falco tinnunculus) in green, the Saker Falcon (Falco cherrug) in orange and the Upland Buzzard (Buteo hemilasius) in blue). Error bars indicate the standard error (SE) of the means. Post hoc pairwise differences by Dunn's test were presented with different English letters (a and b). (For interpretation of the references to colour in this figure legend, the reader is referred to the Web version of this article.)
Table
3.
Assessment of morphological variation among the Common Kestrel (Falco tinnunculus; n = 14), the Saker Falcon (Falco cherrug; n = 4) and the Upland Buzzard (Buteo hemilasius; n = 4) for the hand-wing index (HWI, at the bottom-left of the diagonal) and the relative bill surface area (BSA, at the upper-right of the diagonal) by Kruskal-Wallis rank sum test.
Comparison
Common Kestrel
Saker Falcon
Upland Buzzard
Common Kestrel
−1.40 (0.16)
−3.298,329 (0.003)
Saker Falcon
−1.27 (0.21)
−1.52 (0.19)
Upland Buzzard
−3.27 (0.003)
−1.61 (0.16)
Dunn's test was applied to assess post hoc pairwise differences between species. Z values were listed out of the brackets, with adjusted P-values inside.
This study first tested the alternative hypotheses for Allen's rule for UB, EK, and SF in Qinghai Province, by modeling their current and future habitat suitability and confirming whether a consistent pattern exists between climate-induced range shifts and morphological differences among species. We identified the downward elevation for all the species in the future, but with the notably northeastward shifting of the suitable climate space for UB and SF. Climate change would cause these two species to lose their suitable area in the future, and the more intense the climate change is, the more pronounced the decline would be. No obvious pattern in climate-induced range shift was found for EK, for whom the morphological traits were significantly smaller all the time. Our research is one of the few examples assessing the expected impact of climate change on the distribution of raptors in China. It is the first attempt to correlate this impact across species with morphological variations. The findings of our study help us understand how these raptors might respond to future climates and why they respond differently. All these findings are significant for protecting related species in a changing environment.
The surrounding regions of Qinghai Lake, the SNNR, and the Datong Mountain in the Tibetan Autonomous Prefecture of Haibei are suitable areas for three raptors over time; while the northwest Qaidam Basin, the connecting regions between Qinghai Hoh Xil Mountains and the western Tuotuo River have extremely low occurrence probabilities for all of them. The primary landscape type for those aforementioned areas that were predicted as preferred habitats were moderate-to-high coverage grassland and shrubland (Liu et al., 2013), which is consistent with the preferred habitat of our studied species (Zhang et al., 2019; IUCN, 2021). This confirms that topography and vegetation have a certain predictive ability on the distribution of these small-to-medium-sized raptors, as Bustamante and Seoane (2004) pointed out, and suggests that our variable selection and model running outputs are convincing (Table 1). In contrast, being birds of prey consuming small vertebrates like rodents (Geng et al., 2009), lizards (Du and Ma, 2013), and birds (Sundev et al., 2009), the extraordinary sandy and arid northwestern tip of the Qaidam Basin, as well as the southwest zone between Qinghai Hoh Xil Mountains and the western Tuotuo River, which at an altitude of nearly 6000 m, are unsuitable for our species to survive given potential food resource shortage, especially in the winter (Zhang et al., 2019).
4.1
Range contraction with lack of protection
Generally, the distribution range tends to contract along with northeastward shifting for UB and SF, which is jointly confirmed by the percentage of predicted future range change, mean elevation (reduction), and latitude (increase). Despite the increasing number of reports challenging traditional types of range shifts, such as in east-west directions across longitudes or towards tropical latitudes and lower elevations (Parmesan and Yohe, 2003; Lenoir et al., 2010; Wu, 2015), our results are in accordance with previous SDM projections across a wide range of species showing poleward geographic range shifts in the face of a changing climate (Hickling et al., 2006; Hu and Jiang, 2011; He et al., 2019).
Generally, poleward and upward shifts are likely to be the most frequently documented types of range shifts (Lenoir and Svenning, 2015), which reflects the tracking of a climatic niche by organisms (La Sorte and Jetz, 2012). But a host of factors involving temperature, precipitation (Moritz and Agudo, 2013), species-specific tolerances (La Sorte and Jetz, 2012), competitive release (Rubidge et al., 2011), and land-use changes (Raxworthy et al., 2008; Selwood et al., 2015) all act upon the species' potential to adapt or shift distributions in response to climate change successfully. The evidence we found for downward shifts in elevation might be attributable to the demand of our studied species to specific niche conditions such as oxygen content, temperature, or precipitation (Spence and Tingley, 2020). According to our model performance result, temperature, precipitation, and derivative variables were critical factors. This might explain why the predicted range for our species is always with a reducing elevation.
The future projections consistently suggested that the area of suitable habitat will decrease for all scenarios and were more acute for the pessimistic SSP585, except for the EK in both seasons. In the next few decades, global warming will continue at ever-growing rates (Morelli et al., 2020). Recent studies suggest that the worst predictions of global warming and climate change are probably the most accurate (Brown and Caldeira, 2017). More seriously, the deficient level of RHAs (most below 1%) and the poor protecting degree of the RHMAs (all around 1/3) all suggest that the species selected in this study are widely distributed outside the boundary of the reserve either at present or in the future, which warns us the protection deficiency and the necessity of formulating targeted protection strategies as soon as possible.
According to the BirdLife International and Handbook of the Birds of the World (2021c), EK appears in southeastern QP only in breeding seasons around Haidong City, the Tibetan Autonomous Prefecture of Huangnan, the Tibetan Autonomous Prefecture of Golog. However, the Gaussian Kernel Density of presence records for this species showed hotspots elsewhere around Xining City and the Tibetan Autonomous Prefecture of Haibei, as well as considerable density in the central SNNR region in the winter (Appendix Fig. S1). On one hand, the unexpected distribution pattern may result from a relatively loose definition of the summering and wintering period. While on the other hand, although the quality of citizen sciences' data cannot be guaranteed (Brown and Williams, 2019), we cannot reject the possibility that the current distribution area of this species has already changed.
4.2
The smaller, the better
Interestingly, compared with the other two raptors living at slightly higher altitudes (BirdLife International and Handbook of the Birds of the World, 2021a, b), EK was predicted to be narrow-distributed but exhibits a disordered pattern for its predicted suitable range shift under climate change. The size of its distribution area does not decrease with time as the other two species do but expands in half of the prediction scenarios. At the same time, the centroid shifting of the distribution area is also relatively distinctive from the other two species.
One of the responsible explanations might be the smallest body size and its most extensive thermal insulation area, which were correspondingly verified by the comparison result for the wing length (Fig. 6) and bill surface area (Table 3). It is well known that the appendages of birds, especially in many featherless regions, such as the bill, tarsus, are key parts of their heat exchange with the environment (Fan et al., 2019). From the traditional physiological perspective, the lower surface-to-volume ratio of large individuals has better thermal insulation performance than that of small individuals (Romano et al., 2020). According to our results, all the six morphological indices we chose for representing appendage size were the smallest for the EK. And the only thermal insulation index we could currently calculate suggests that this species has a relatively more extensive heat exchange area, at least at the bill. All these indicate that even EK has the smallest body size but with the highest efficiency of thermal maintenance, which could help it copes better with the warming climate.
Another possible explanation is the adaptability discrepancy to changing environment for our three raptors. On one hand, EK exhibits a stronger dispersal ability when compared with the other two, given its biggest hand-wing index, which is widely adopted as a proxy for avian flight efficiency and dispersal ability in birds (White, 2016; Sheard et al., 2020). The more considerable rate and distance of dispersal by organisms are thought to facilitate the colonization of new regions, thereby driving range expansion (Lester et al., 2007). This may be the case for EK, for whom the size of its distribution area expands in half of the prediction scenarios. On the other hand, EK is considered a species that appears intrinsically resilient to urbanization and even proliferates in human-modified environments (Dykstra, 2018; Huchler et al., 2020). It opportunistically uses anthropogenic structures available in agricultural areas (Costantini et al., 2014; Sumasgutner et al., 2019) and urban settings (Kübler et al., 2005; Sumasgutner et al., 2014). These jointly demonstrate that EK has a more comprehensive resource use ability, which could be a key predictor of species' responses to environmental changes as well (Walther et al., 2002; McMahon et al., 2019).
Although this study reveals essential discoveries, there are also limitations. Firstly, as one of the very few pilot studies modeling the impact of climate change on raptors in QP (Zhang et al., 2019), we concentrated niche shift primarily used SDMs, while the evolutionary process, which potentially reflects the species response to climate change (Aguirre-Liguori et al., 2021), is beyond our consideration. Secondly, since a lack of related information, the definitions for summering and wintering periods for occurrence points need to be more relaxed to meet the phenological patterns for each species, which could potentially mask the distribution discrepancy among seasons. Lastly, any broad-scale climate change threat analysis based on species distribution modeling like ours should be interpreted with great care and accompanied by regular field monitoring, given that shifts or fragmentation in suitable climate space, albeit expanding, may still lead to a decline in adaptive genetic variation and population fitness (He et al., 2019). Thus, we advocate the more comprehensive combined application of SDMs, landscape genomic data, and field validation to effectively investigate the implications of climate change on raptor distribution patterns in the future.
5.
Conclusions
Our study identified the downward shifting in elevation in the future for all three raptor species in Qinghai Province, with the consistently northeastward shifting of the suitable climate space and range reduction for two of them in larger body and appendage size. At the same time, the small-sized Common Kestrel seems more flexible in dealing with climate change. While any broad-scale climate change threat analysis based on SDMs like ours should be interpreted with great care, we expect more research in the future to verify our findings with more comprehensive methods across more taxa.
Author contributions
AX, JZ, QL collected the field data, QZ did the analyses and wrote the paper together with ZL. AX and ZL brought their expertise and reviewed the manuscript before submission. All authors read and approved the final manuscript.
Ethics statement
The fuctional traits of all three raptor species were acquired from AVONET dataset raised by Tobias et al. (2022) and no measurements were conducted on living birds.
Declaration of competing interest
The authors declare that they have no competing of interest.
Acknowledgments
We're grateful to Weiming Zou, Guosheng Wu, E Zhao for conducting fieldwork. We appreciate the Forestry and Grassland Bureau of Qinghai Province's financial support and the invaluable field assistance from the Forestry and Grassland Bureau of local counties in Qinghai Province. National Natural Science Foundation of China (Grant No. 32101237 and Grant No. 41871294) and Tibet Major Science and Technology Project (Grant No. XZ201901-GA-06) supported this work. The funders had no role in study design, data collection, analysis, publication decision, or manuscript preparation.
Appendix A. Supplementary data
Supplementary data to this article can be found online at https://doi.org/10.1016/j.avrs.2023.100079. Environmental data were downloaded from open-access data servers, mentioned in the Materials and Methods.
Birdlife International, 2018. Ciconia boyciana. The IUCN Red List of Threatened Species 2018: E.T22697695A131942061. .
Chen, L.X., Liu, H.J., Liu, Y.L., Yang, P.Y., Zhang, G.G., Lu, J., 2019. Analysis on the variation of waterbird communities in different habitats of Khanka Lake in China. Sci. Silvae Sin. 55, 56-65. . (in Chinese)
Cheng, L., Zhou, L.Z., Yu, C., Wei, Z.H., Li, C.H., 2023. Flexible nest site selection of the endangered Oriental Storks (Ciconia boyciana): Trade-off from adaptive strategies. Avian Res 14, 100088. .
Cobben, M.M.P., van Noordwijk, A.J., 2016. Stable Partial migration under a genetic threshold model of migratory behaviour. Ecography 39, 1210-1215. .
Green, M., Alerstam, T., Clausen, P., Drent, R., Ebbinge, B.S., 2002. Dark-bellied Brent Geese (Branta bernicla bernicla), as recorded by satellite telemetry, do not minimize flight distance during spring migration. Ibis 144, 106-121.
Jia, R., Liu, D., Lu, J., Zhang, G., 2020. Wetland destruction on migration routes threatens a breeding population of the endangered black-faced spoonbill (Platalea minor). Global Ecol. Conserv. 23, e1105. .
Jia, Y., Liu, Y., Jiao, S., Guo, J., Lu, C., Zhou, Y., et al., 2021. Shifting of the migration route of White-Naped Crane (Antigone vipio) due to wetland loss in China. Rem. Sens. 13, 2984. .
Kidd-Weaver, A., Hepinstall-Cymerman, J., Welch, C.N., Murray, M.H., Adams, H.C., Ellison, T.J., et al., 2020. The movements of a recently urbanized wading bird reveal changes in season timing and length related to resource use. PLoS One 15, e230158.
Knudsen, E., Lindén, A., Both, C., Jonzén, N., Pulido, F., Saino, N., et al., 2011. Challenging claims in the study of migratory birds and climate change. Biol. Rev. 86, 928-946. .
Lei, J., Jia, Y., Zuo, A., Zeng, Q., Shi, L., Zhou, Y., et al., 2019. Bird satellite tracking revealed critical protection gaps in East Asian – Australasian flyway. Int. J. Environ. Res. Publ. Health 16, 1147. .
Lessells, C.M., Boag, P.T., 1987. Unrepeatable repeatabilities: a common mistake. Auk 104, 116-121. .
Li, A.Q., Yang, B., 2020. Ecological protection strategy analysis of Songhua River Basin in Heilongjiang Province. Economist 3, 136-137+139. (in Chinese)
Liu, D.P., Zhang, G.G., Jiang, H.X., Chen, L.X., Meng, D.R., Lu, J., 2017. Seasonal Dispersal and longitudinal migration in the Relict Gull Larus Relictus across the inner-mongolian plateau. PeerJ 5, e3380. .
Liu, H.J., Chen, L.X., Liu, Y.L., Yang, P.Y., Lu, J., Zhang, G.G., 2021. Population dynamics of Oriental Storks (Ciconia boyciana) at Xingkai Lake in China. Chinese J. Ecol. 40, 3683-3690. (in Chinese)
Martin, B., Onrubia, A., Ferrer, M., 2016. Migration timing responses to climate change differ between adult and juvenile white storks across western Europe. Clim. Res. 69, 9-23. .
Mellone, U., Limiñana, R., Mallia, E., Urios, V., 2011. Extremely detoured migration in an inexperienced bird: interplay of transport costs and social interactions. J. Avian Biol. 42, 468-472. .
Palacín, C., Alonso, J.C., Alonso, J.A., Magaña, M., Martín, C.A., 2011. Cultural transmission and flexibility of partial migration patterns in a long-lived bird, the great bustard Otis tarda. J. Avian Biol. 42, 301-308. .
Panuccio, M., Martín, B., Morganti, M., Onrubia, A., Ferrer, M., 2017. Long-term changes in autumn migration dates at the Strait of Gibraltar reflect population trends of soaring birds. Ibis 159, 55-65.
Pearse, A.T., Metzger, K.L., Brandt, D.A., Bidwell, M.T., Harner, M.J., Baasch, D.M., et al., 2020. Heterogeneity in migration strategies of Whooping Cranes. Condor 122, duz056. .
Pearse, A.T., Rabbe, M., Juliusson, L.M., Bidwell, M.T., Craig-Moore, L., Brandt, D.A., et al., 2018. Delineating and identifying long-term changes in the whooping crane (Grus americana) migration corridor. PLoS One 13, e192737. .
Peng, W., Zhu B.G., Dong, S., Li, B., Li, X., 2020. Study on the migration route of Oriental White Stork in autumn tracked by satellite. Int. J. Ecol. 9, 108-116. .
Shephard, J.M., Rycken, S., Almalik, O., Struyf, K., van Erp-Van der Kooij, L., 2015. Migration strategies revealed by satellite tracking among descendants of a population of European White Stork (Ciconia Ciconia) reintroduced to Belgium. J. Ornithol. 156, 943-953. .
Shimazaki, H., Tamura, M., Darman, Y., Andronov, V., Parilov, M.P., Nagendran, M., et al., 2004. Network analysis of potential migration routes for Oriental White Storks (Ciconia Boyciana). Ecol. Res. 19, 683-698. .
Studds, C.E., Kendall, B.E., Murray, N.J., Wilson, H.B., Rogers, D.I., Clemens, R.S., et al., 2017. Rapid population decline in migratory shorebirds relying on Yellow Sea tidal mudflats as stopover sites. Nat. Commun. 8, 14895 .
Sun, Y., Du, L., Yin, Y., Wu, Y., Cai, A., Li, D., 2020. Aquaculture jeopardizes migrating Oriental storks. Science 370, 669. .
Tedeschi, A., Sorrenti, M., Bottazzo, M., Spagnesi, M., Telletxea, I., Ibàñez, R., et al., 2020. Interindividual variation and consistency of migratory behavior in the Eurasian woodcock. Curr. Zool. 66, 155-163. .
Tian, X.H., Ma, X.F., 2021. Research on Conservation of Oriental White Storks in China. Northeast Forestry University Press, Harbin.
Wails, C.N., Major, H.L., 2017. Fitting in with the crowd: the role of prospecting in seabird behavioural trends. Can. J. Zool. 95, 247-253.
Wang, Q., Yang, Z., 1995. Current studies on Oriental White Stork. J. Anhui Univ. 1, 82–99 (in Chinese).
Wang, X., Lin, B.Q., Li, L.S., 2018. Population quantity and habitat selection of Ciconia boyciana in Xianghai Nature Reserve. J. Anhui Agr. Sci. 46, 57-58. (in Chinese) .
Wang, Y.X., Xie, Y.B., Nyambayar, B., Zhu, B.G., Dong, S.B., Anna, B., et al., 2020. Discussion of existing protection for three waterbirds’ habitats in the Yellow River basin nature reserves, based on satellite tracking. Biodivers. Sci. 28, 1483-1495. (in Chinese)
Xie, P., Dong, S.B., Zhu, G.B., Li, T.F., Zhang, Y.G., Ma, Y.D., et al., 2018. Activity of juvenile Oriental White Stork (Ciconia boyciana) by GPS/GSM technology in Sanjiang Plain Areas, China. Chinese J. Wildl. 39, 600-606. (in Chinese)
Yang, H., Chen, B., Barter, M., Piersma, T., Zhou, C., Li, F., et al., 2011. Impacts of tidal land reclamation in Bohai Bay, China: ongoing losses of critical Yellow Sea waterbird staging and wintering sites. Bird. Conserv. Int. 21, 241-259. .
Zhang, G.X., 2011. The status and population recovery of Oriental Stork in Heilongjiang Province, China. Chinese J. Wildl. 32, 164-166. .
Zhao, L., Lian, X.W., 2019. Analysis on current situation of Songhua River control and protection in Jilin Province. Water Res. Hyd. N. China 37, 47-48. (in Chinese)
Zhu, B.G., Liu, H.J., Li, X.M., Zhu, L.P., Thomas, D., 2008. Current status of Oriental White Stork population and artificial reintroduction in Sanjiang Plain. Wetland Sci. Manag. 4, 21-23. .
Table
1.
The environmental variables used in the MaxEnt model indicated by plus sign for the Common Kestrel (Falco tinnunculus), Saker Falcon (Falco cherrug) and Upland Buzzard (Buteo hemilasius) in summer and winter, and their corresponding modelling parameters including regularization multiplier (RM), feature combination (FC), as well as the values of high area under the curve.
Modelling information
Common Kestrel
Saker Falcon
Upland Buzzard
Code
Complete name
Summer
Winter
Summer
Winter
Summer
Winter
Environmental variables
Dem
Elevation above sea level
+
+
+
+
+
+
Aspect
Direction of slope
+
+
+
+
+
+
Slope
Gradient of slope
+
+
+
+
+
+
LC
Landcover
+
+
+
+
+
+
Bio1
Annual mean temperature
Bio2
Mean diurnal range
+
+
+
+
+
+
Bio3
Isothermality
+
+
+
+
+
+
Bio4
Temperature seasonality
+
+
+
Bio5
Max temperature of warmest month
Bio6
Min temperature of coldest month
Bio7
Temperature annual range
+
+
+
Bio8
Mean temperature of wettest quarter
+
+
+
+
+
+
Bio9
Mean temperature of driest quarter
Bio10
Mean temperature of warmest quarter
Bio11
Mean temperature of coldest quarter
Bio12
Annual precipitation
+
Bio13
Precipitation of wettest month
Bio14
Precipitation of driest month
Bio15
Precipitation seasonality
+
+
+
+
+
+
Bio16
Precipitation of wettest quarter
Bio17
Precipitation of driest quarter
Bio18
Precipitation of warmest quarter
+
+
+
+
+
+
Bio19
Precipitation of coldest quarter
+
+
+
+
+
+
Modeling parameters
RM
Regularization multipliers
4
1
4
4
1
1
FC
Feature combinations
L†Q‡H§
LQHP¶
LQHPT#
LQHPT
LQHPT
LQHPT
High area under the curve
AUC
Currently
0.895
0.869
0.848
0.847
0.814
0.843
2050
0.902
0.864
0.853
0.851
0.816
0.843
2070
0.895
0.867
0.856
0.851
0.800
0.842
2090
0.892
0.866
0.849
0.858
0.810
0.842
Notes: For the abbreviation of FC, † stands for linear, ‡ stands for quadratic, § stands for hinge, ¶ stands for product, and # stands for threshold.
Table
2.
Current habitat suitability of the Common Kestrel (Falco tinnunculus), Saker Falcon (Falco cherrug) and Upland Buzzard (Buteo hemilasius) in Qinghai Province derived from prediction results of MaxEnt modeling.
Species
Season
Habitat Suitability
Unsuitable (0–0.25)
Low (0.25–0.5)
Moderate (0.5–0.75)
High (0.75–1)
Grids' count
Area percentage
Grids' count
Area percentage
Grids' count
Area percentage
Grids' count
Area percentage
Common Kestrel
Summer
6386
0.1591
14,894
0.371
17,483
0.4355
1378
0.0343
Winter
36,738
0.9152
2169
0.054
119
0.003
1115
0.0278
Saker Falcon
Summer
3522
0.0877
12,534
0.3122
24,082
0.5999
3
0.0001
Winter
1589
0.0396
13,882
0.3458
24,666
0.6145
4
0.0001
Upland Buzzard
Summer
2610
0.065
12,333
0.3072
25,193
0.6276
5
0.0001
Winter
3102
0.0773
15,891
0.3959
21,143
0.5267
5
0.0001
Percentage of occupied area by the four suitability categories (as represented inside the brackets) were indicated in italic.
Table
3.
Assessment of morphological variation among the Common Kestrel (Falco tinnunculus; n = 14), the Saker Falcon (Falco cherrug; n = 4) and the Upland Buzzard (Buteo hemilasius; n = 4) for the hand-wing index (HWI, at the bottom-left of the diagonal) and the relative bill surface area (BSA, at the upper-right of the diagonal) by Kruskal-Wallis rank sum test.
Comparison
Common Kestrel
Saker Falcon
Upland Buzzard
Common Kestrel
−1.40 (0.16)
−3.298,329 (0.003)
Saker Falcon
−1.27 (0.21)
−1.52 (0.19)
Upland Buzzard
−3.27 (0.003)
−1.61 (0.16)
Dunn's test was applied to assess post hoc pairwise differences between species. Z values were listed out of the brackets, with adjusted P-values inside.

 DownLoad:


 Email Alerts
 RSS Feeds