Illegal hunting and trafficking of wildlife and their derivatives extort unprecedented population decline of relatively many species pushing them towards extinction. Notwithstanding contemporary counteracting interventions at international, regional, national and local levels, wildlife farming is advocated as an alternative approach to minimize pressure on wild populations. For wildlife farming to be an effective conservation tool, the integration of wildlife forensics is inevitable to allow distinction between captive-bred and wild-caught species. To this end, we analyzed methylation rates of skeletal muscle samples (pectoralis major, triceps brachii, gastrocnemius, biceps femoris, and neck muscles) from 60 captive-bred and 30 wild-caught Common Pheasant. A total of 13,507 differentially methylated regions were identified between five wild-caught and five captive-bred individuals through whole-genome methylation sequencing (WGBS). Based on the selected five methylation sites, LOC116231076, LOC116242223, ATAD2B, EGFL6, and HS2ST, quantitative detection technique was developed using methylation-sensitive high-resolution melting curve (MS-HRM) to measure methylation rates. The results showed significant differences in methylation rates at all differential sites between wild-caught and captive-bred individuals (|t| = 0.67–33.10, P = 0.000–0.042). The discrimination accuracy rate of each locus was highest in the gastrocnemius muscle and lowest in the neck muscle. The discrimination accuracy rate on LOC116231076, LOC116242223, ATAD2B, EGFL6, and HS2ST methylation sites for gastrocnemius muscle was 64.98%, 100.00%, 68.54%, 63.79%, and 63.70%, respectively; and for neck muscle it was 67.42%, 68.06%, 83.61%, 65.04%, and 68.85%, respectively. The united discrimination accuracy rate of the five loci were 100.00% for gastrocnemius muscle, 99.78% for biceps femoris muscle, 97.52% for pectoralis major muscle, 93.96% for triceps brachii muscle, and 91.63% for neck muscle, respectively. The panel also revealed excellent repeatability, reproducibility, sensitivity and universality to mammals and avian species. This study establishes an effective, accurate and low-cost identification technology for the identification of wild and farmed Common Pheasant, and also provides a reference for the development of identification methods for other species.
The long existing illegal trade in wildlife and their derivatives is a significant threat to global biodiversity, leading to the decline and extinction of wildlife populations (Harrison, 2011; Butchart et al., 2018). The increasing demand for wildlife and their products for food, pets, entertainment, luxury collections, and medicines perpetuates market-driven unsustainable overexploitation of wild populations (McRae et al., 2022; Fromentin et al., 2023). Amidst this illicit money-spinning trade and its devastating aftermath, wildlife farming is sought as a potential conservation tool likely to provide substitutes to saturate consumer utility whilst minimizing pressure on wild populations and subsequently avert their extinction risks (Challender and MacMillan, 2014). On this account, as it strives to ensure sustainable wildlife trade, the Convention on International Trade in Endangered Species of Wild Fauna and Flora (CITES) allows commercial utilization of at least second generation offspring (F2) for captive-bred wildlife with registered operations. Despite a favorable prognosis, the paradigm shift from wild to captive source populations in a global trade raises new concerns of laundering products from wild caught animals as “captive bred”. In reality, such cases happen from time to time worldwide (Wang et al., 2019). Establishing tracing and verification system in the market for all legal wildlife products to restrict laundering of illegal wild sourced products is an anticipated countermeasure worldwide (Chen et al., 2007; Hinsley et al., 2016). Alongside law enforcement to combat poaching, and safeguard wildlife populations, technology is needed to differentiate between wild-captured and captive-bred animals; otherwise, wildlife farming system would launder illegal products and lose its conservation function (Tensen, 2016).
Genetically, distinguishing the wild captured from captive-bred wildlife and their associated products is challenging because of shared gene pool similarities due to short-time artificial selection and limited occurrence of private mutations. In view of this, the developed approaches involve detecting biochemical, morphological and physiological differences. These approaches include targeting chemical elements such as fatty acid composition (Atlantic Salmon Salmo salar and Rohu’s Bat Philetor brachpterus) (Blanchet et al., 2005; Sharma et al., 2010), DART (Direct Analysis in Real Time) mass spectrometry of bone (African Lion Panther leo) (Coals et al., 2021), stable carbon and nitrogen isotopes (African Lion) (Hutchinson and Roberts, 2020), morphometrics of hindlimb (Dybowski’s Frog Rana dybowskii and American Mink Neovison vison) (Xia, 2011; Sun et al., 2021), skull and mandible (American Mink) (Qi, 2015; Meng, 2016), relative mass of liver to skull size (King Ratsnake Elaphe carinata) (Li 2018)and femur bone density (Dybowski’s Frog and American Mink) (Yang et al., 2011; Zhou et al., 2015). However, these approaches were only validated for limited number of species and materials, far from the actual demands.
Many species from different taxa including amphibians, reptiles, birds and mammals are farmed for their meat, skin and other purposes around the world (Liang et al., 2023). Skeletal muscles are convenient available for identification of source population for the animals that are bred in captivity for their meat. However, muscles are often processed by different means and preserved at different conditions before being sold and consumed, during which biochemicals may change dramatically (Gomez et al., 2020). Consequently, approaches like fatty acid profiling and DART mass spectrometry would no longer be accurate to detect the true difference between wild and farmed animals. These challenges prompt the urge to develop a novel approach tolerant to quality changes induced by processing and preservation chemicals and methods.
Global methylation and methylation status of specific genes would not be significantly affected by variation in collection, storage, and processing of DNA from multiple sources of tissues (Groen et al., 2018b). Genomic DNA is often modified by methylation as to regulate gene expression to meet the demand of cell function (Moore et al., 2012). This makes methylation superior over other biochemical markers to detect true difference between individuals sharing the same gene pool but experienced different environmental conditions which shape anatomy and physiology of the animal.
The physiology and anatomy of movement is the most notable difference between wild and captive animals as influenced by exercise volume. Wild animals express a broad spectrum of active behaviors like walking, territory patrolling, foraging (hunting), displaying, fighting, playing, escaping, and others, whereas captive ones not only express less diversity but more static behaviors, like standing, resting, and walking (Mason, 2013). These differences may alter the metabolism of skeletal muscles that may further result in differential methylation pattern on genome and methylation rate on specific genes. Some of these differences could be used to establish a method to differentiate the meat from the wild-captured to that of captive-bred individuals. This hypothesis is in line with the empirical such that exercise training may lead to alterations in the methylation status of functional genes (Barres et al., 2012; Ehlert et al., 2013; Brown, 2015; Kanzleiter et al., 2015), signaling pathway of MAPK (Aronson et al., 1997; Long et al., 2004; Benziane et al., 2008) and Ca2+ (Rose and Hargreaves, 2003; Rose et al., 2006) in human and mice skeletal muscle. Similarly, different methylation level was observed on skeletal muscle α-ACTN3 gene promoter between wild and captive American Mink (Wang et al., 2020). These suggest methylation may reveal epigenetic difference between wild and captive con-specific individuals.
The Common Pheasant (Phasianus colchicus) is one of the most popular game species in the world. Its skeletal muscle is a widely recognized exotic meat as it is tasty, nutritious and healthy with high protein and low fat and cholesterol content (Kokoszynski et al., 2012; Quaresma et al., 2016). To meet the demand of hunting and consumption, the species is extensively farmed worldwide, either for releasing to the wild for hunting in western countries (Diefenbach et al., 2000; Balfour, 2022) or for meat production as a new poultry species in eastern countries (Li et al., 2017; Argamjav et al., 2023; Van et al., 2023). However, the wild population is often protected by laws and hunting is prohibited without administrative permits (Liang et al., 2023). Without restrictive verification methods to identify the source population, the species is prone to laundering of wild-caught into captive-bred meat products. Therefore, this species is an ideal model to test the feasibility of muscle DNA methylation rate to differentiate the wild-captured from captive-bred birds.
For this purpose, we explored the difference in genome wide methylation level between captive and wild pheasants, selected five loci of great inter-group methylation discrepancy to set up a panel, established MS-HRM quantification system and evaluated discriminant effectiveness of the panel. This study not only provides an effective forensic approach to support law enforcement of the Common Pheasant, but also lends experience to develop identification methods for other species.
2.
Materials and methods
2.1
Sample collection
A total of 60 captive-bred adult Common Pheasant (30 for each sex) were purchased from two farms (Qinhuangdao Wild Zoo and Lesser Xing’an Mountains Wildlife Rescue and Breeding Center of Heilongjiang Province, Yichun). All were artificially hatched, raised in coops and fed with commercial formulated feed. The birds were euthanized by inhalating halothane according to veterinary anesthesia guidelines. Concurrently, thirty adult wild specimens (15 for each sex, all are whole carcass) were donated by forestry police after poaching cases were closed (now stored in the Wildlife Detection Center, National Forestry and Grassland Administration). The pectoral major muscle, triceps brachii muscle, gastrocnemius muscle, biceps femoris muscle, and neck muscle were isolated from each individual bird and preserved under -20 ℃.
2.2
DNA extraction and whole-genome bisulfite sequencing
Total DNA was extracted from each muscle sample using the AxyPrep Multisource Genomic DNA Miniprep Kit (AXYGEN, USA) according to the manufacturer’s instruction sand then subjected to bisulfite treatment using EZ DNA Methylation Kit (ZYMO Research, Irvine, CA, USA) to convert unmethylated cytosines into uracil leaving methylated cytosines unchanged.
The converted pectoralis major muscle DNA of five wild and five male captive pheasants were selected for whole-genome bisulfite sequencing. Library was constructed using the TruSeq DNA Methylation Kit (Illumina, USA) and sequenced on an Illumina HiSeq 2000 platform (Illumina, USA). The paired-end reads of 150 bp were generated for each fragment. The raw reads were filtered to remove contaminated reads using trim-galore v0.6.7. Trim-galore (http://www.bioinformatics.babraham.ac.uk/projects/trim_galore/) is a combination of two tools: cutadapt v4.6 (Kechin et al., 2017) and fastqc v0.11.8 (http://www.bioinformatics.babraham.ac.uk/projects/fastqc). Quality control was performed using the software fastp v0.23.1 (Chen et al., 2018) with the following parameters: q 5, -u 50, -f 10, -F 10, -n 15, -l 140, –overlap_diff_limit 1, and –overlap_diff_percent_limit 10. Clean reads were mapped to the Phasianus colchicus reference genome (Liu et al., 2019) (GCA_004143745.1, NCBI) using Bismark v0.23.1 (Krueger and Andrews, 2011). The conversion rate was calculated as the percentage of methylated reads in the total number of clean reads using the same software with default parameters setting. No mismatch was permitted in the “seed” during alignment.
The bismark_methylation_extractor script packaged in Bismark v2.4.4 was used to extract methylation calls. The methylation status of each cytosine with higher than five-fold coverage was analyzed using the binomial distribution model. At each nucleotide position, read depth was used to test whether or not the number of detected cytosines exceeded the number expected due to sequencing error. This analysis generated coverage statistics for methylated cytosine reads and their contexts (CG, CHG and CHH, where H can be A, T, C, respectively). To analyze differentially methylated genes (DMGs) and differentially methylated regions (DMRs), the wild group and the captive group were compared using DSS v.2.44.0 (Feng et al., 2014), with the criteria Q-value < 0.01 to quantify methylation level differences.
2.3
Differential methylation analysis
The independent t-test was used to compare differences in methylation profiles between the wild and farm groups. DMGs with an absolute value of diff.Methy ≥ 0.60 were considered as differentially methylated loci. Kyoto Encyclopedia of Genes and Genomes (KEGG) pathway analyses were used to determine the roles of DMGs. Pathway data were extracted from two standard public pathway databases: KEGG (http://www.kegg.jp/kegg/pathway.html). The KEGG pathways were considered significantly enriched with unadjusted raw P < 0.05 and ranked by –log10(P) from lowest to highest.
2.4
MS-HRM system setup for large sample testing of DMRs
2.4.1
MS-HRM primers design
From DMRs with methylation rate discrepancy over 60% between the two groups, 73 CG sites were selected to test methylation rate in pectoral major muscle of 30 wild-captured and 30 captive-bred samples using MS-HRM approach. A pair of primers were designed for each site using Methyl Primer Express v1.0 and Primer Premier 5 software and synthesized by Comate Bioscience Co., Ltd. (Jilin, China). Information of DMRs and primers is shown in Table 4.
Table
1.
The accuracy of five loci in the panel to discriminate captive and wild Common Pheasant by using methylation rate in five skeletal muscles.
Gene locus
Pectoral major
Triceps brachii
Gastrocnemius
Biceps femoris
Neck muscle
LOC116231076
90.01%
85.59%
64.98%
71.99%
67.42%
LOC116242223
96.67%
87.84%
100.00%
97.48%
68.06%
ATAD2B
90.07%
82.13%
68.54%
77.16%
83.61%
EGFL6
67.51%
65.09%
63.79%
66.75%
65.04%
HS2ST
74.05%
66.18%
63.70%
70.28%
68.85%
Whole panel
97.52%
93.96%
100.00%
99.78%
91.63%
Note: Tested using 5-fold cross-validation repeated for 400 times.
Quantitative PCR (qPCR) was set up in a 20 μL system, including ∼80 ng converted DNA template, 5 μL of 2×HRM Analysis PreMix, 1 μL of 50×ROX Reference Dye, 5.8 μL of RNase-Free ddH2O, and 0.3 μM of forward and reverse primers. The reaction was performed on a FQD-96A quantitative PCR cycler equipped with melting curve analysis module (Bioer Technology, China) with a pre-denaturation at 95 ℃ for 2 min, followed by 40 cycles of denaturation at 95 ℃ for 10 s, annealing at optimal annealing temperature (46.6 ℃) of each gene for 20 s and extension at 72 ℃ for 30 s. The final extension step was melting-curve stage to visualize the melting temperature (Tm) of amplicons as the estimator of methylation rate. Loci with no, ambiguous, or unstable results were discarded, and loci with perfect amplification were regarded as candidate loci to set up a panel.
2.4.3
Standard curve for each locus
A standard curve was created for each locus to quantify the methylation rate of each muscle DNA. At first, we completely prepared methylated (100%) and non-methylated (0.0%) standard templates for each locus. The total DNA of a pectoral major muscle was treated with CpG methyltransferase (NEB Co., Ltd. Beijing, China) as the standard template of 100% methylation, and the genome DNA obtained by performing whole-genome amplification treatment was used as the standard template of zero methylation (0.0%). The two standard DNAs were blended to have a series methylation level of 80%, 60%, 40%, 20%, and 10%. By using the same qPCR system and the above cycling program, standard curve was created for each DMG by plotting Tm against methylation levels. The effectiveness of the standard curve was verified using P value (<0.01) and R2 (>0.95). Loci with P and R2 values lower than the set criteria were discarded.
2.5
Statistical analysis
The Kruskal–Wallis test was used to compare the methylation rates of each DMG in different skeletal muscles. Since multiple comparisons were conducted, the Bonferroni correction was applied. This involved adjusting the significance level (α’) by dividing the original α (0.05) by the number of pairwise comparisons (m = 10) conducted (α’ = 0.005). Independent samples t-test in Origin 2018 software was used to compare the methylation rates of each DMG in each skeletal muscle between wild and captive groups (α = 0.05). The discriminant power of each DMG was evaluated individually and in combination using K-fold cross-validation and multiple K-fold cross-validation in R.
2.6
Repeatability and sensitivity testing
Seven samples from the wild-captured and seven samples from the captive-bred individuals were randomly chosen to test the repeatability and sensitivity of the MS-HRM system across five focal muscle types. For repeatability testing, MS-HRM analysis was performed for three replicates for each sample using previously established reaction conditions and procedures. The mean and standard deviation of the Tm value for each DMG was computed to evaluate repeatability. For sensitivity testing, the template concentration of qPCR system of each DMG was set in series 2.5, 0.2 and 0.05 ng/μL. The readability of Tm values was used to evaluate the sensitivity.
2.7
Species specificity testing
Muscle DNA of six mammals and nine birds were used to test the specificity of each MS-HRM system, including Serotine Bat (Eptesicus serotinus), Alashanian Pipistrelle (Hypsugo alaschanicus), Raccoon Dog (Nyctereutes procyonoides), Mongolian Gazelle (Procapra gutturosa), Manchurian Hare (Lepus mandshuricus), Black Bear (Ursus thibetanus), Little Ringed Plover (Charadrius dubius), Two-barred Warbler (Phylloscopus plumbeitarsus), Barn Swallow (Hirundo rustica), Brown Shrike (Lanius cristatus), Western Yellow Wagtail (Motacilla flava), Pin-tailed Snipe (Gallinago stenura), Northern Pintail (Anas acuta), Mallard (Anas platyrhynchos) and Eastern Spot-billed Duck (Anas zonorhyncha). The readability of Tm values was used to evaluate the specificity.
2.8
Reproducibility testing
Seven samples from the wild-captured and seven samples from the captive-bred individuals were randomly chosen for each focal muscle type to test reproducibility of the five primer sets by performing replicate qPCRs on two separate qPCR devices, LightCycler 96 instrument (Roche, USA) and FQD-96A (Bioer Technology, China).
2.9
Influence of different kits on the accuracy of MS-HRM
We tested the influence of different kits on the accuracy of MS-HRM, Bisulfite-converted DNA from 50 pectoral major muscle samples were amplified using HRM analysis kit with EvaGreen (Tiangen Biotech (Beijing) Co., LTD.) and PowerUpTM SYBRTM Green Master Mix (Thermal Fisher Scientific, USA). All experiments followed the same protocol as above while melting curve quality was used to determine the efficiency of each kit for our panel.
3.
Results
3.1
Genome-wide DNA methylation of the wild-captured and captive-bred Common Pheasant
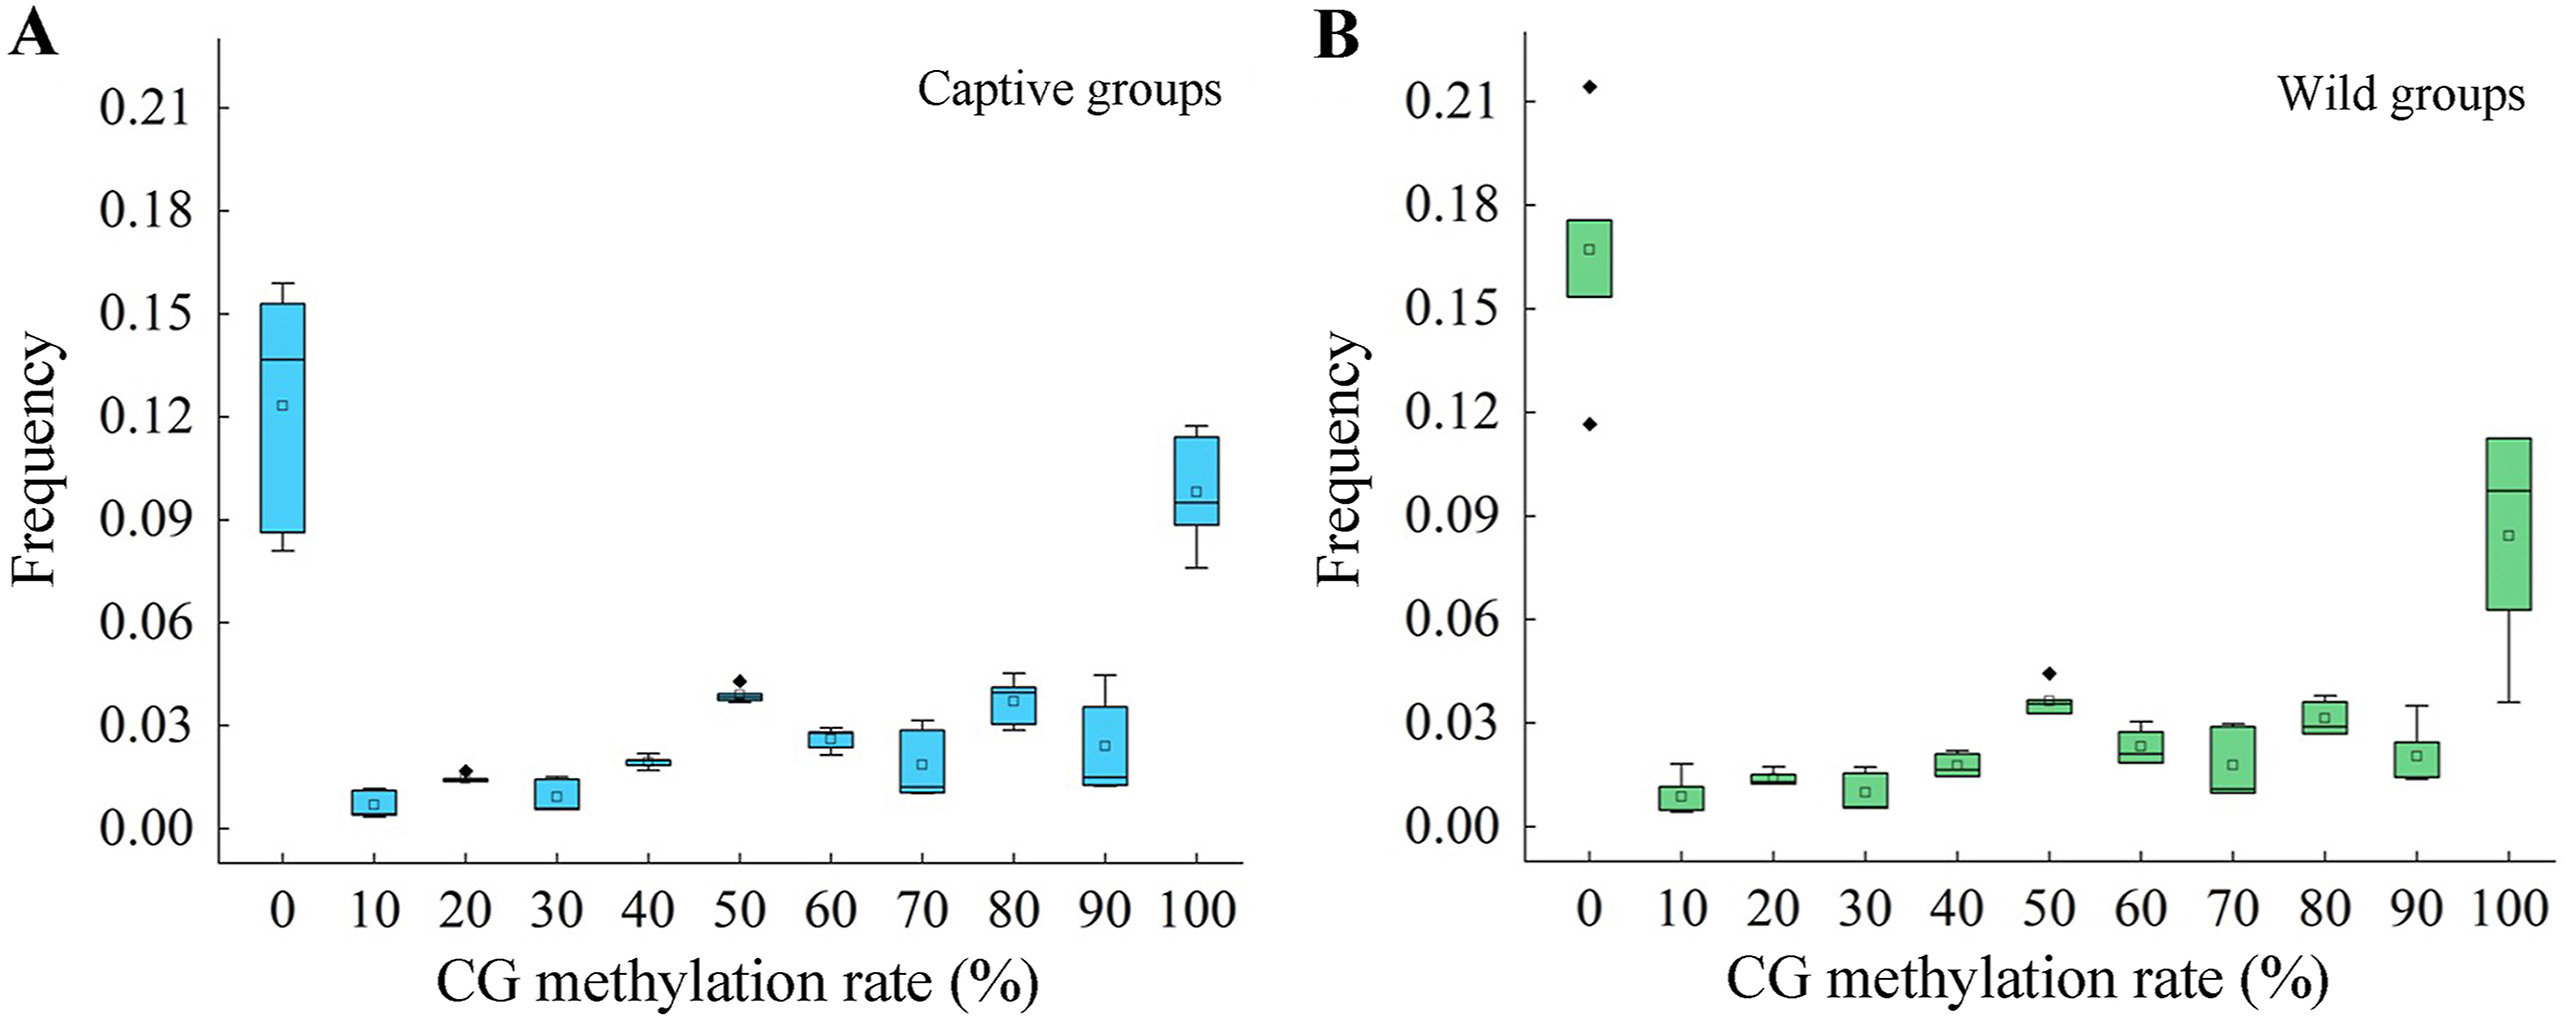
WGBS was successfully performed for all 10 samples of pectoralis major muscle. On average, each sample generated 2.29×10⁸ clean reads with range from 1.02×10⁸ to 3.14×10⁸. The average base call accuracy was 95.41% at Q20 (94.55% to 96.30%) and 87.66% at Q30 (85.55% to 89.41%). The average effective read length ratio was 98.52%, ranging from 95.99% to 99.72% (Appendix Table S1). Globally, cytosine methylation at CG sites was dominant along the whole genome, while methylation at CHG and CHH sites was very rare (Appendix Table S1). The methylation pattern of all 10 pectoralis major muscle DNAs were similar, with no significant differential signatures between the captive and wild Common Pheasant except for slight individuality of each sample (Fig. 1). On average, 14.51% CpG sites were non-methylated (0%) with a range from 8.10% to 21.43% for all 10 samples. The average proportion of completely methylated (100%) CpG sites were 9.12% with a range between 3.60% and 11.73%. The proportion of partially methylated (0–100%) sites varied from 0.35% to 11.73%, showing a slight increasing trend as the methylation rate increased (Fig. 1 and Appendix Table S3).
Figure
1.
The frequency distribution of methylation sites in pectoralis major muscle DNA of (A) captive-bred and (B) wild-captured Common Pheasant.
3.2
Differential methylation between captive and wild pheasants
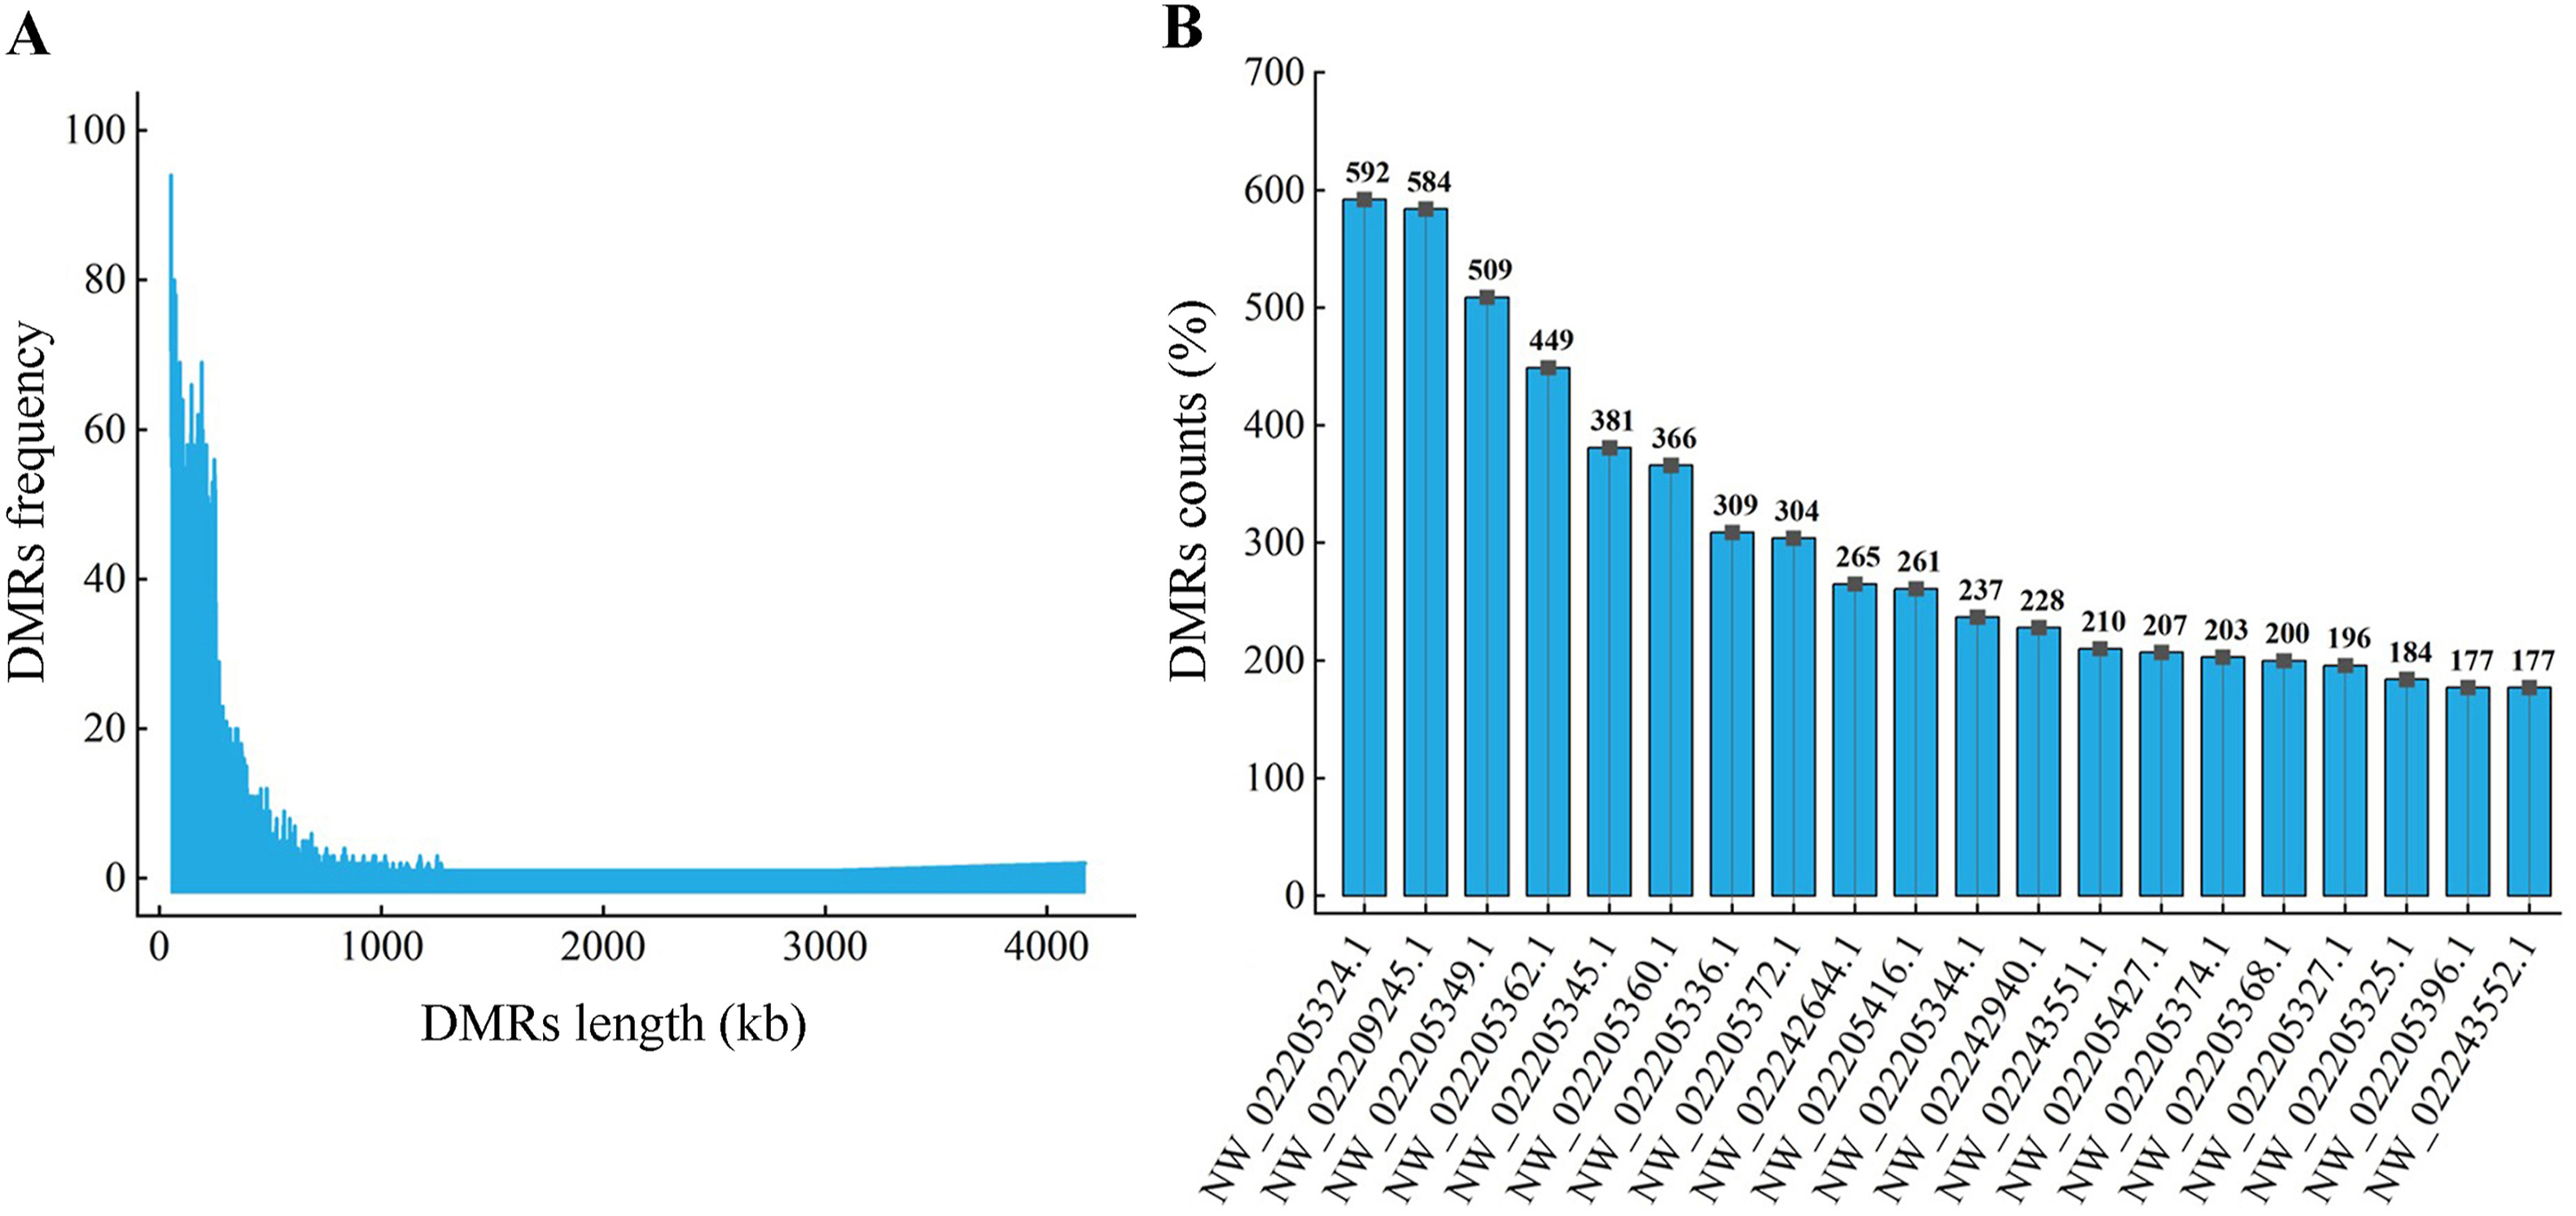
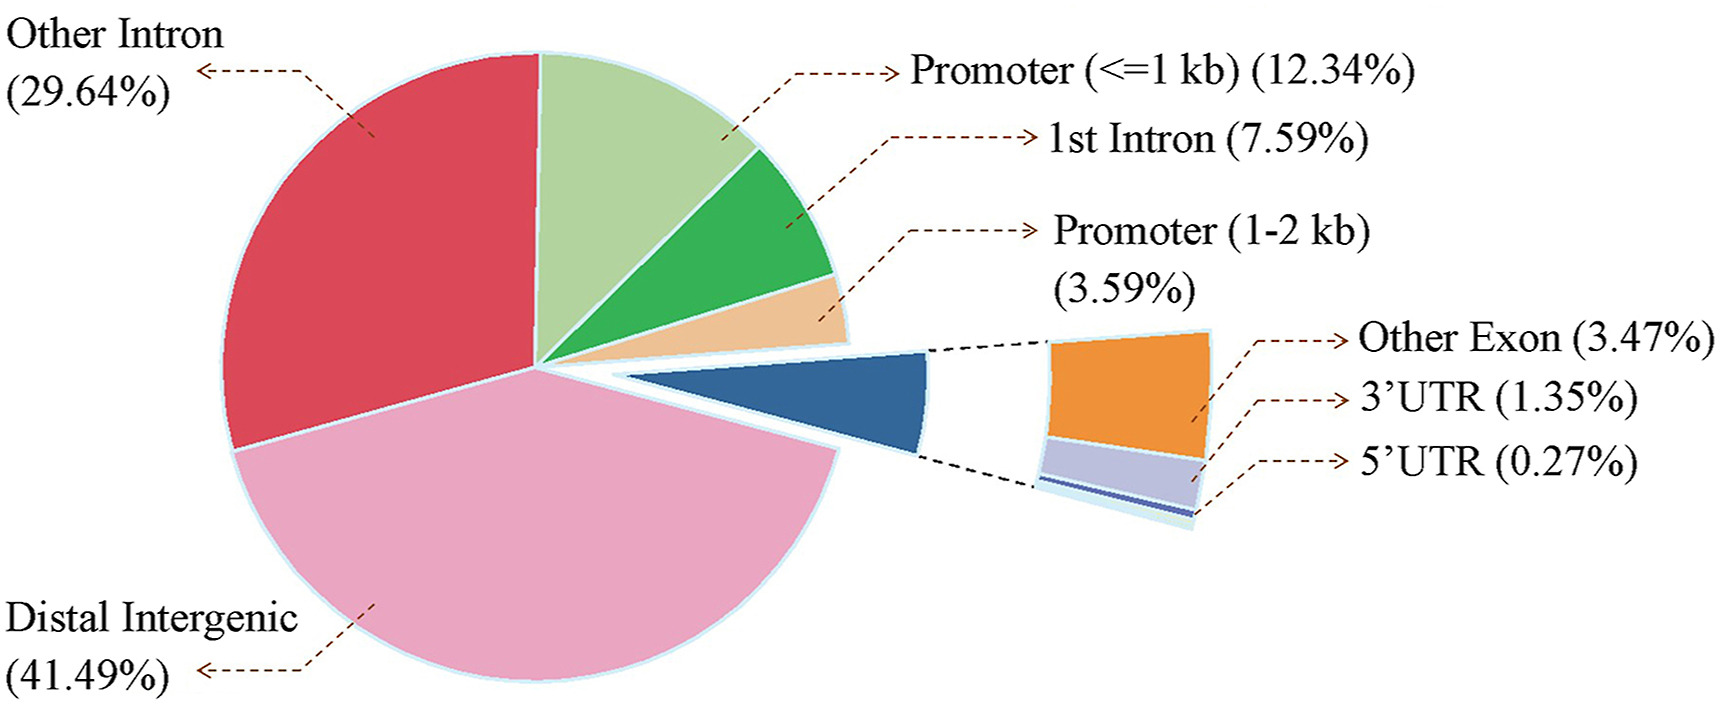
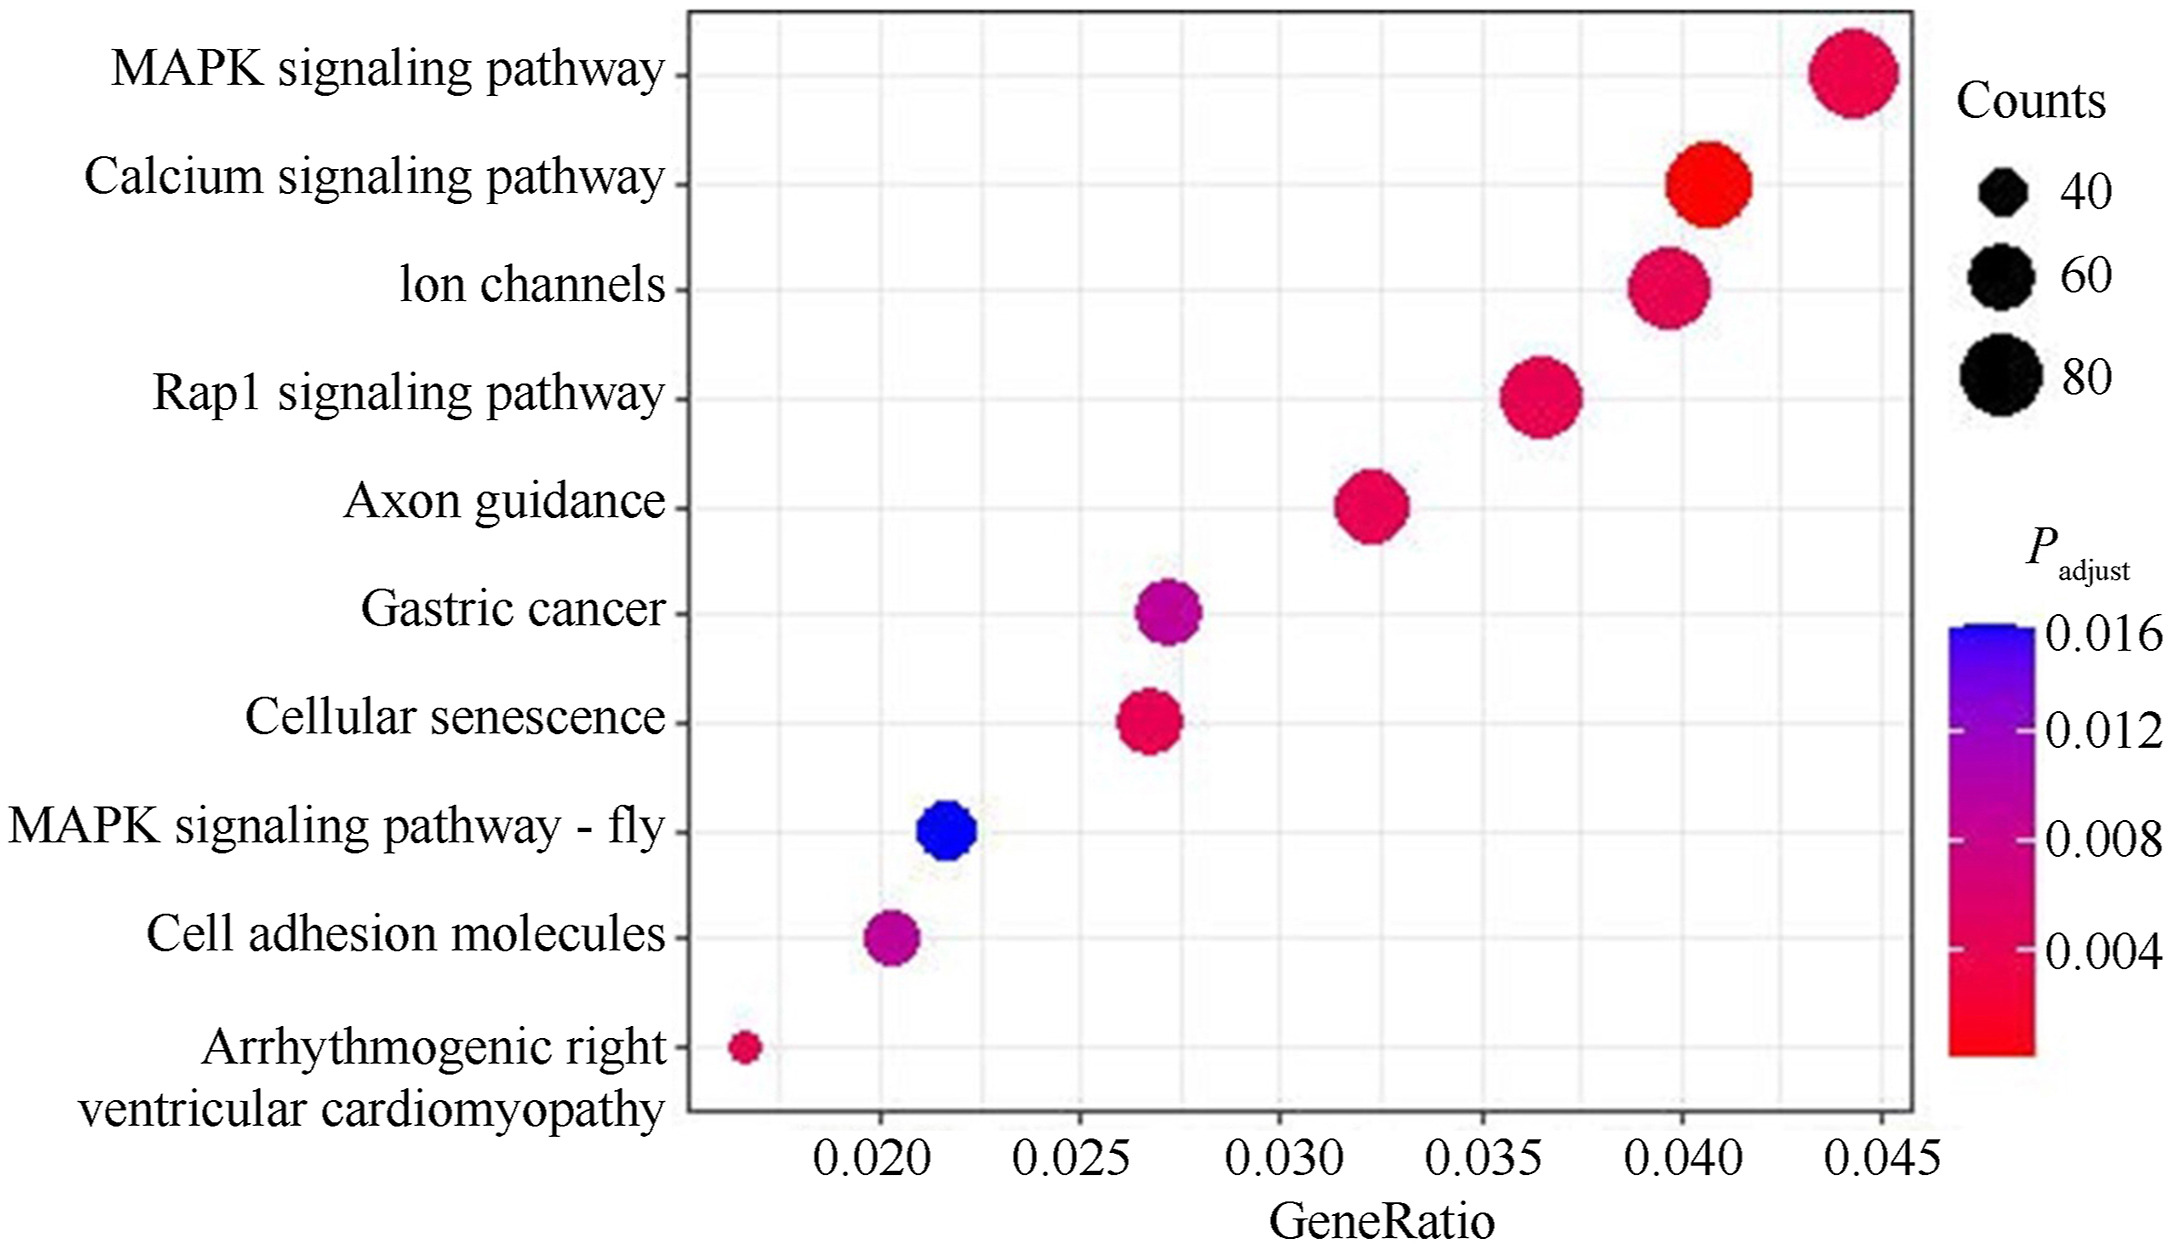
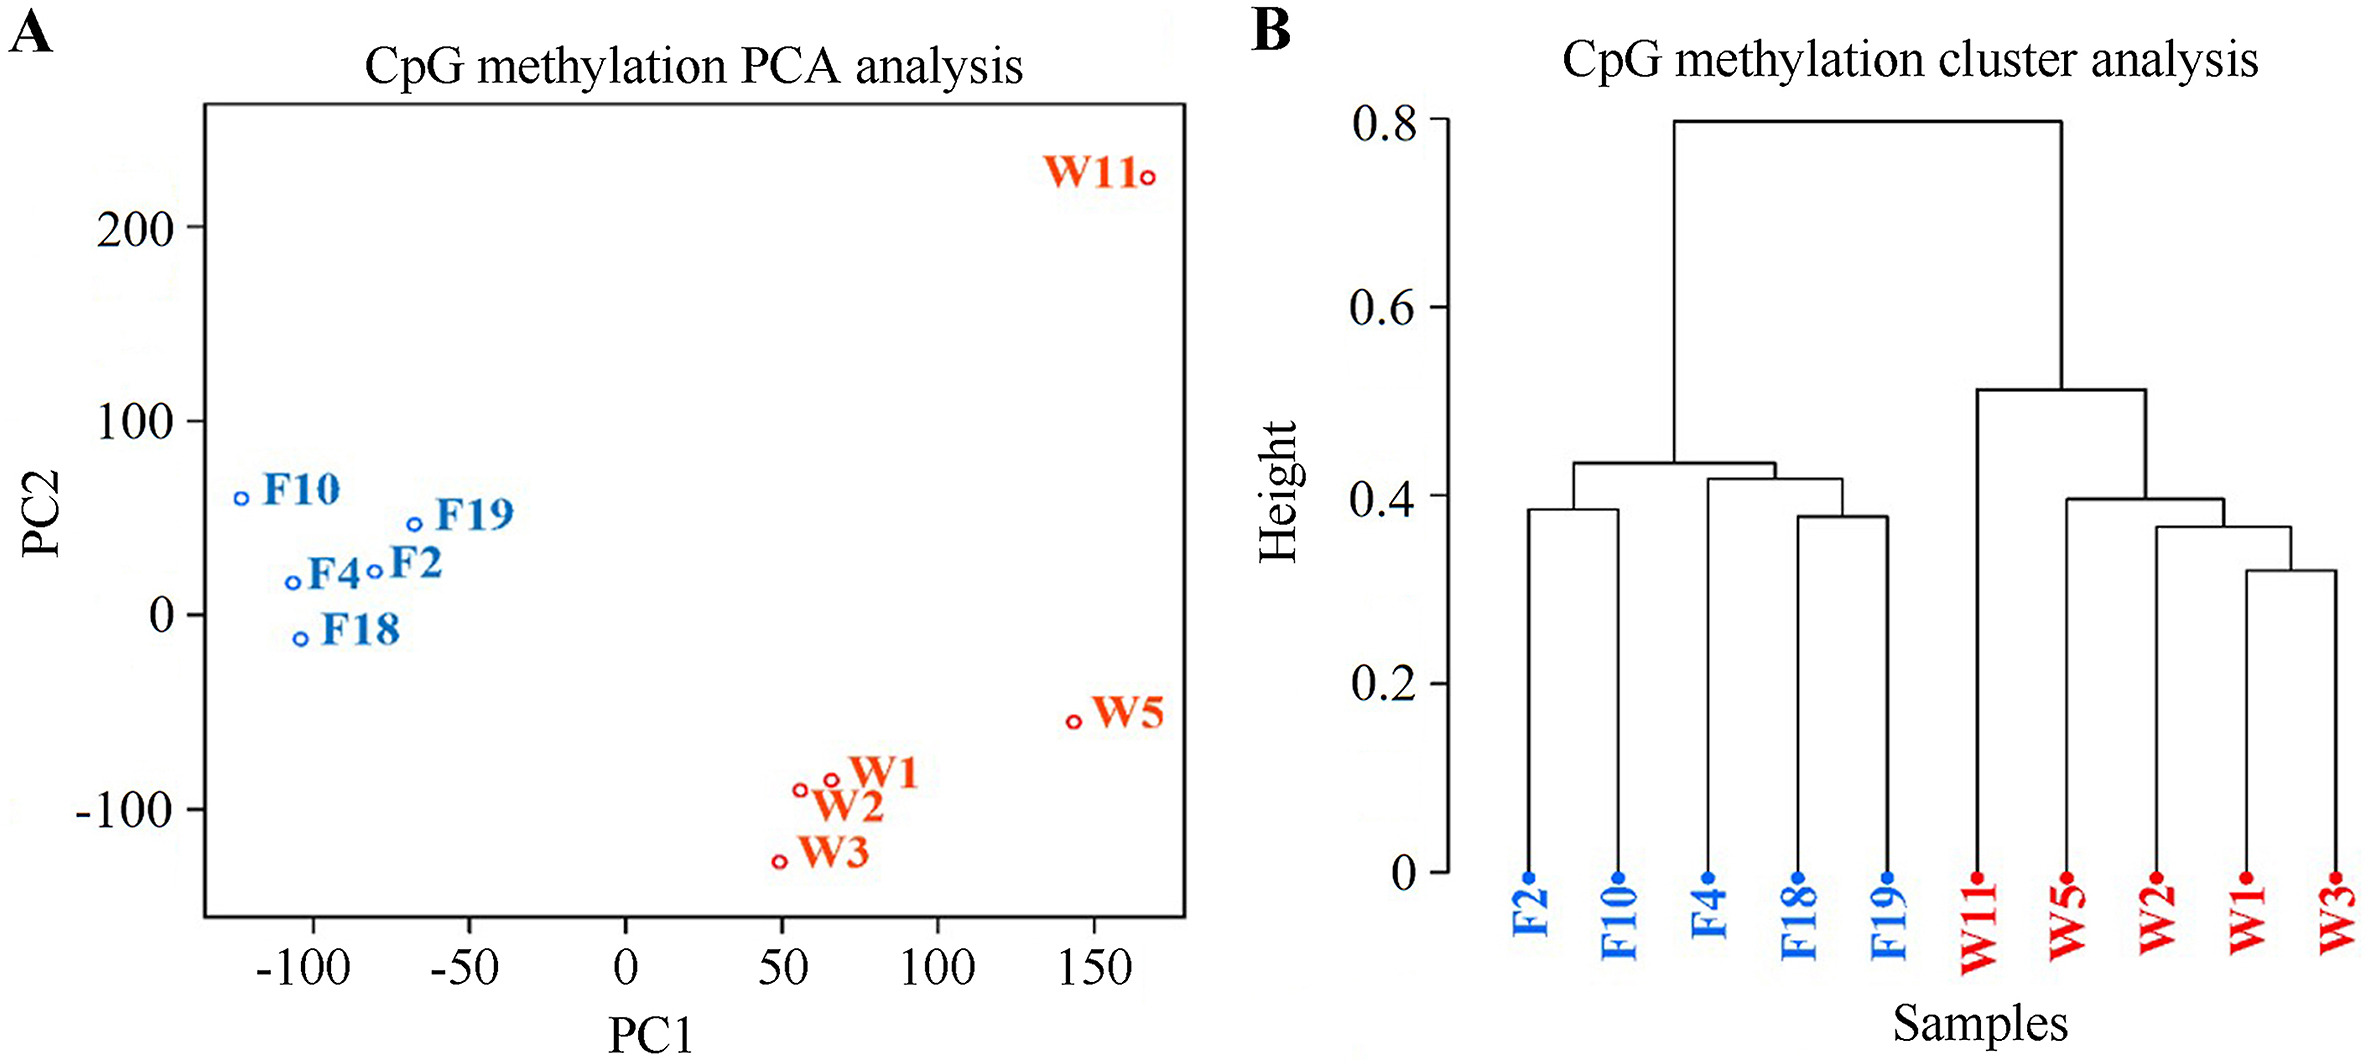
There was no significant difference between methylation for all levels between captive-bred and wild-captured groups (Fig. 1, |t| = 0.438–3.654, P = 0.0890–0.0684). However, the class of 80%-methylated was greater in captive pheasants (Fig. 1, |t| = 3.654, P = 0.022). Moreover, a total of 13,507 differentially methylated regions (DMRs) were identified between the wild and captive group. The lengths of the DMRs varied from 51 to 4174 bp and 93.15% of which were less than 500 bp (Fig. 2A). The number of DMRs also varied greatly from chromosome to chromosome. The top 20 chromosomes took 44.1% the total DMRs, among which, chromosome NW022205324.1 carried the greatest number (598) of DMRs (Fig. 2B). Approximately 41.5% DMRs were located in genomic regulatory elements, 15.9% in distal intergenic area, and 15.9% in promoters (Fig. 3). We identified a total 6722 differentially methylated genes (DMGs) on DMRs. KEGG enrichment showed the top two significantly enriched DMGs are related to MAPK signaling pathway and calcium signaling pathway (Fig. 4), which are all associated with exercise. Importantly, the principal component analysis (PCA) and cluster analysis (CA) clearly sorted the wild and captive pheasants based on the whole genome methylation rate data (Fig. 5).
Figure
2.
Frequency distribution of DMR length (A) and number (B) on top 20 chromosomes.
Figure
3.
Distribution of DMRs on genomic functional elements. Approximately 41.5% DMRs were located in genomic regulatory elements, 15.9% in distal intergenic regions and 15.9% in promoters.
Figure
4.
The pattern of methylation levels of KEGG enrichment of genes for top 10 functional groups. The bubble’s size is proportional to the number of genes enriched, and the color indicates the degree of enrichment significance.
Figure
5.
Principal component analysis (A) and cluster analysis (B) of the whole genome methylation data of wild and captive pheasants. Captive samples are depicted in blue and wild ones are in red. The distance method “correlation” and the clustering method “ward” were used for clustering analysis.
3.3
Panel setup for differentiating captive from wild pheasant
A total of 73 CG sites were tested for the methylation rate using MS-HRM approach, 16 of which were perfectly amplified and generated clear Tm signals. Standard curves were then set up for these sites, with a mean R2 values of 0.9730 (ranging from 0.882 to 1) and a mean P value of 0.003 (0.000 to 0.032) (Appendix Fig. S1), suggesting their accuracy to measure the methylation rate.
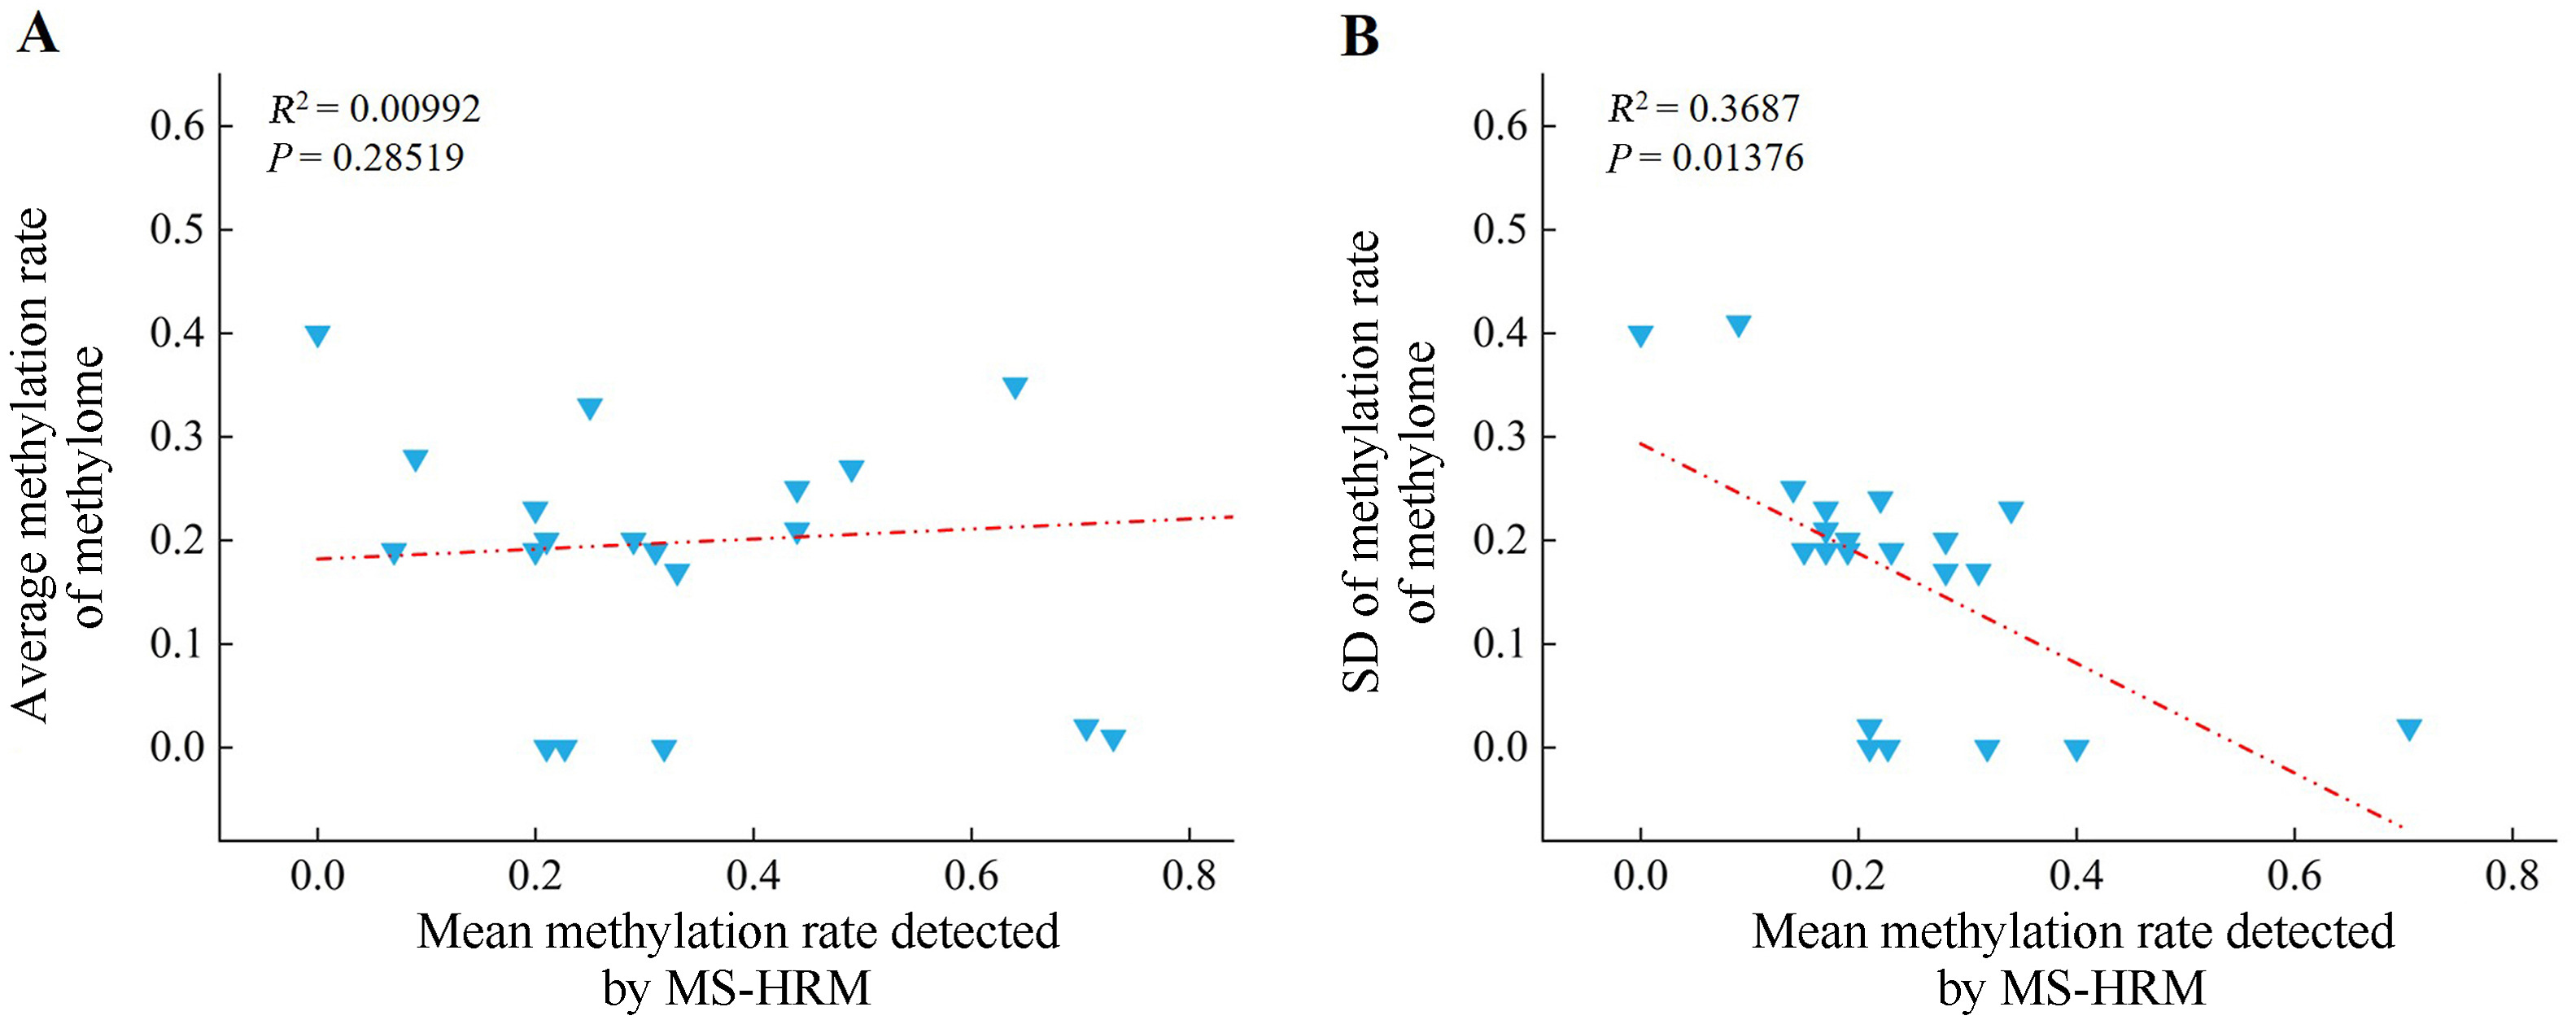
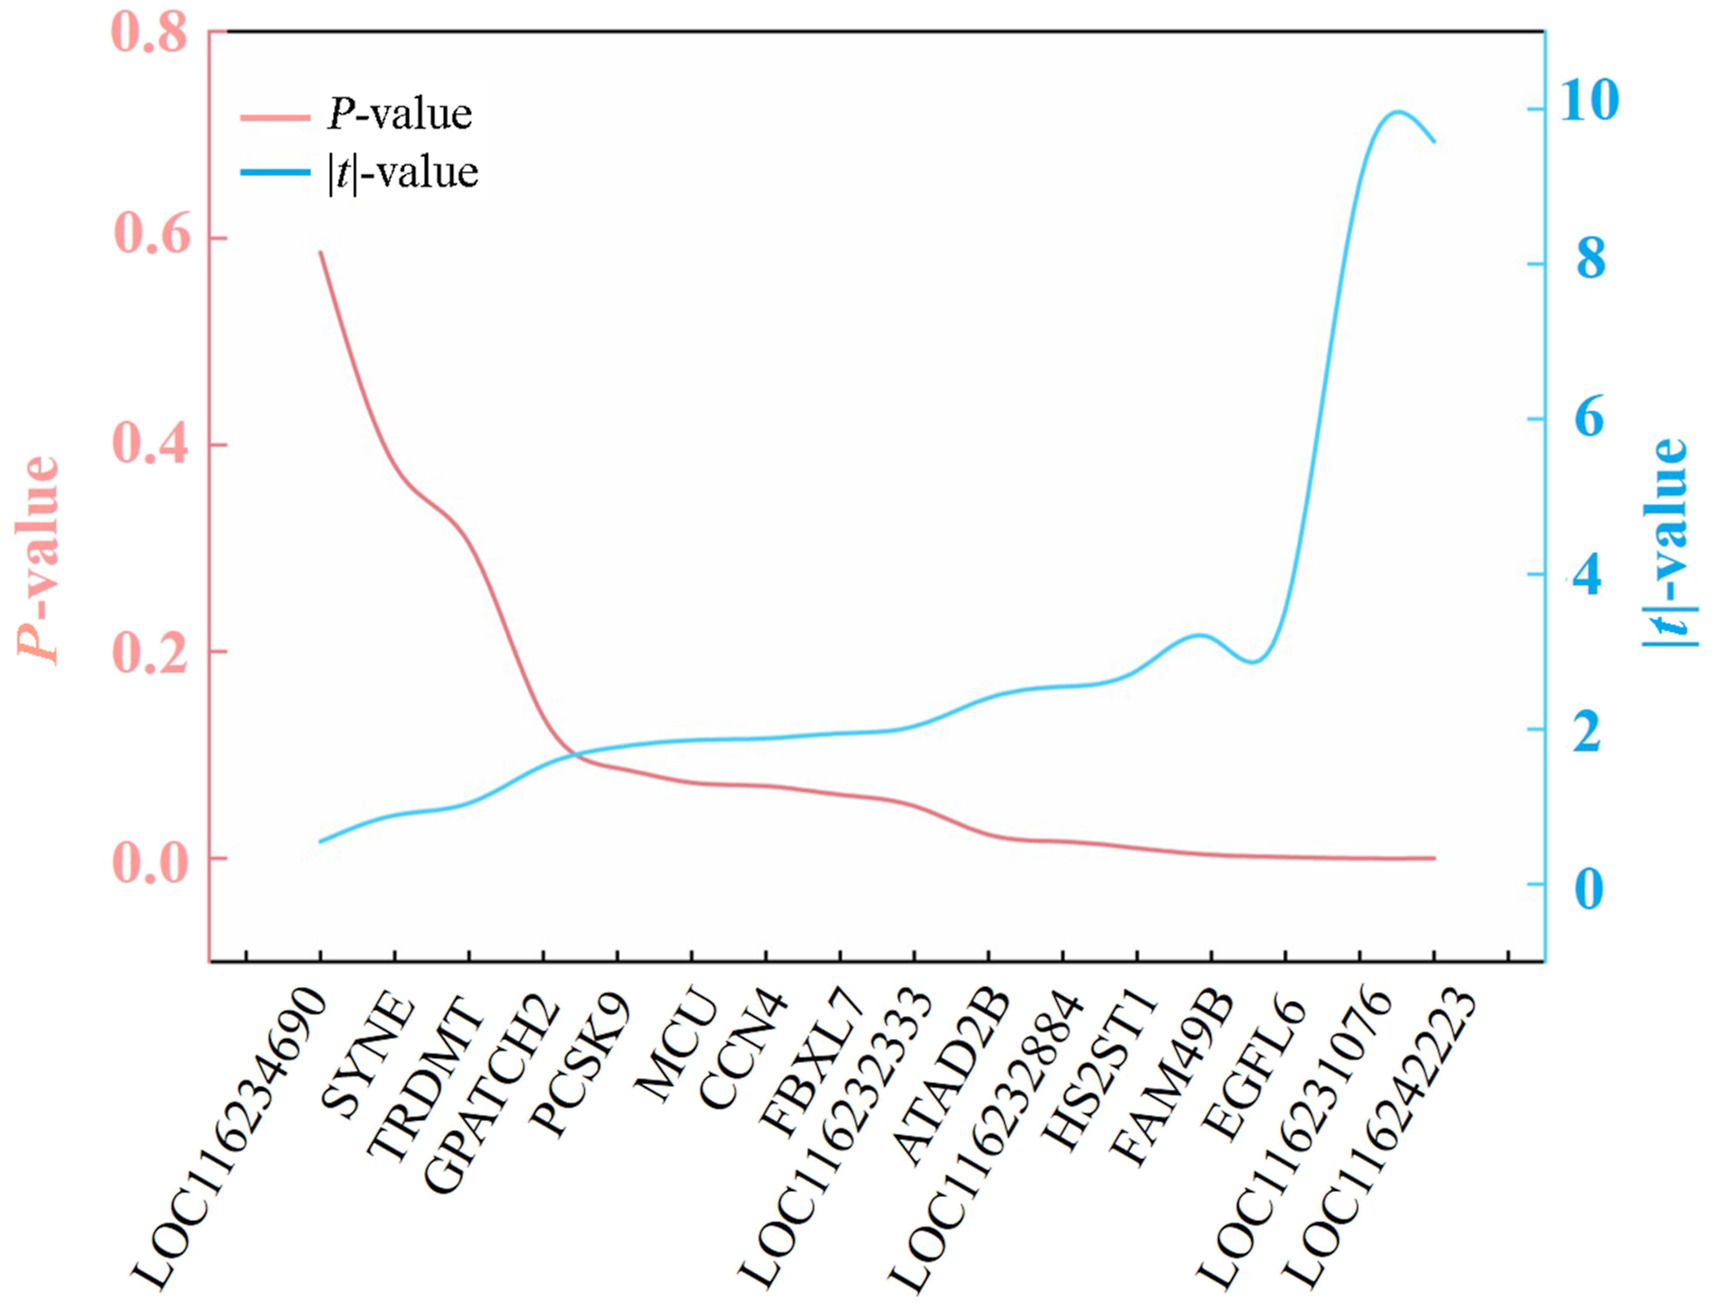
By using the DNA of pectoralis major of 30 wild-captured and 30 captive-bred pheasants, we firstly examined the concordance of the methylation rate between WGBS analysis and MS-HRM tests for the 16 loci. Regression showed no significant correlation for both methylation rate and standard deviation (Fig. 6). These suggest that methylome data only provides a rough differential trend, and the MS-HRM approach is reliable. Secondly, we made comparison of the methylation rate between wild (n = 30) and captive (n = 30) Common Pheasant based on the MS-HRM data. Figure 7 shows the variation of P and |t| values across the 16 loci, five of which, namely LOC116231076, LOC116242223, ATAD2B, EGFL6 and HS2ST, being involved in the MAPK and calcium signaling pathways, had high |t| values and low P values, indicating high discriminant power. They were then chosen to set up the panel.
Figure
6.
Linear regression analysis of the mean value (A) and standard deviation (SD) (B) between the methylation rate of the methylome and the methylation rate detected by MS-HRM across 16 sites.
Figure
7.
The variation of P and |t| values across the 16 loci for the comparison of pectoralis major DNA methylation rate between wild and captive pheasants.
The panel was further tested for other four muscles. All together, the methylation rate ranges in five major muscles were all broader in captive group than in wild group, and the difference between the two groups varied from muscle to muscle (Fig. 8). The locus ATAD2B and LOC116242223 were significantly higher in captive pheasants than in wild ones for all five muscles (P = 0.000–0.023). Locus LOC116231076 significantly differed for all muscles (P = 0.000) but the neck muscle (P = 0.503) (Fig. 8E), and EGFL6 significantly differed for all muscles (P = 0.000–0.003) and triceps brachii (P = 0.342) (Fig. 8B). The differences on locus HS2ST were only significant in pectoralis major (P = 0.010, Fig. 8A) and biceps femoris (P = 0.042, Fig. 8D), but not in triceps brachii (P = 0.372, Fig. 8B), gastrocnemius (P = 0.342) and neck muscle (P = 0.083, Fig. 8E). Finally, the within-group variation tests demonstrated that the methylation rate on the same loci vary among different muscles in the same group (Table 2).
Figure
8.
Methylation rate of five loci in wild-captured and captive-bred Common Pheasant. A, B, C, D and E are pectoralis major, triceps brachii, gastrocnemius, biceps femoris and neck muscle, respectively.
Cross-validation showed that the power to differentiate captive from wild pheasants of a locus varied from muscle to muscle (Table 1). For instance, the discriminant accuracy of locus LOC116231076 was 90.01% in pectoral major, but as low as 64.98% and 67.42% in gastrocnemius and neck muscle, respectively. Locus LOC116242223 reached accuracy 96.67% to 100.00% in pectoral major, gastrocnemius and biceps femoris, but only 68.06% in neck muscle. Locus EGFL6 and HS2ST had a low discriminant accuracy, generally ranging from 63.70% to 74.05%. However, the combined discriminant accuracy of the whole panel could reach 91.63% in neck muscle, 93.96% in triceps brachii, 97.52% in pectoral major, 99.78% in biceps femoris, and even 100.00% in gastrocnemius.
3.5
Repeatability, reproducibility, sensitivity and species specificity
We randomly chose 14 samples to perform triplicated MS-HRM detection for each locus. The standard deviation of Tm of each triplicate varied from 0 to 0.094 for different muscle (Appendix Tables S7–1 to Tables S7–5). The variation coefficient of each triplicate ranged between 0 to 0.009. These results suggest excellent repeatability of MS-HRM system for the panel.
To test the reproducibility, a total of 14 replicates of MS-HRM were performed in parallel on a Roche LightCycler 96 and a BIOER FQD-96A qPCR devices. The variation coefficient of Tm of the same sample between the two devices ranged from 0.000 to 0.012 across five loci (Appendix Tables S8–1 to Tables S8–5), falling in the ranges of reproducibility. This suggests the reproducibility of MS-HRM on different devices are acceptable.
We used series concentrations of bisulfite converted DNAs from pectoral major of seven wild and seven captive pheasants to test the sensitivity. Results showed that all MS-HRM tests were able to read melting temperature correctly when template was greater than 0.2 ng/μL (Table 3).
Cross-species amplification showed that the MS-HRM system for the whole panel amplified all 15 species including 6 mammals and 9 birds. This suggests the system are potentially applicable to broad range of species given the they also significantly differ between captive and wild animals (Table 4).
3.6
Influence of different kits on the precision of MS-HRM
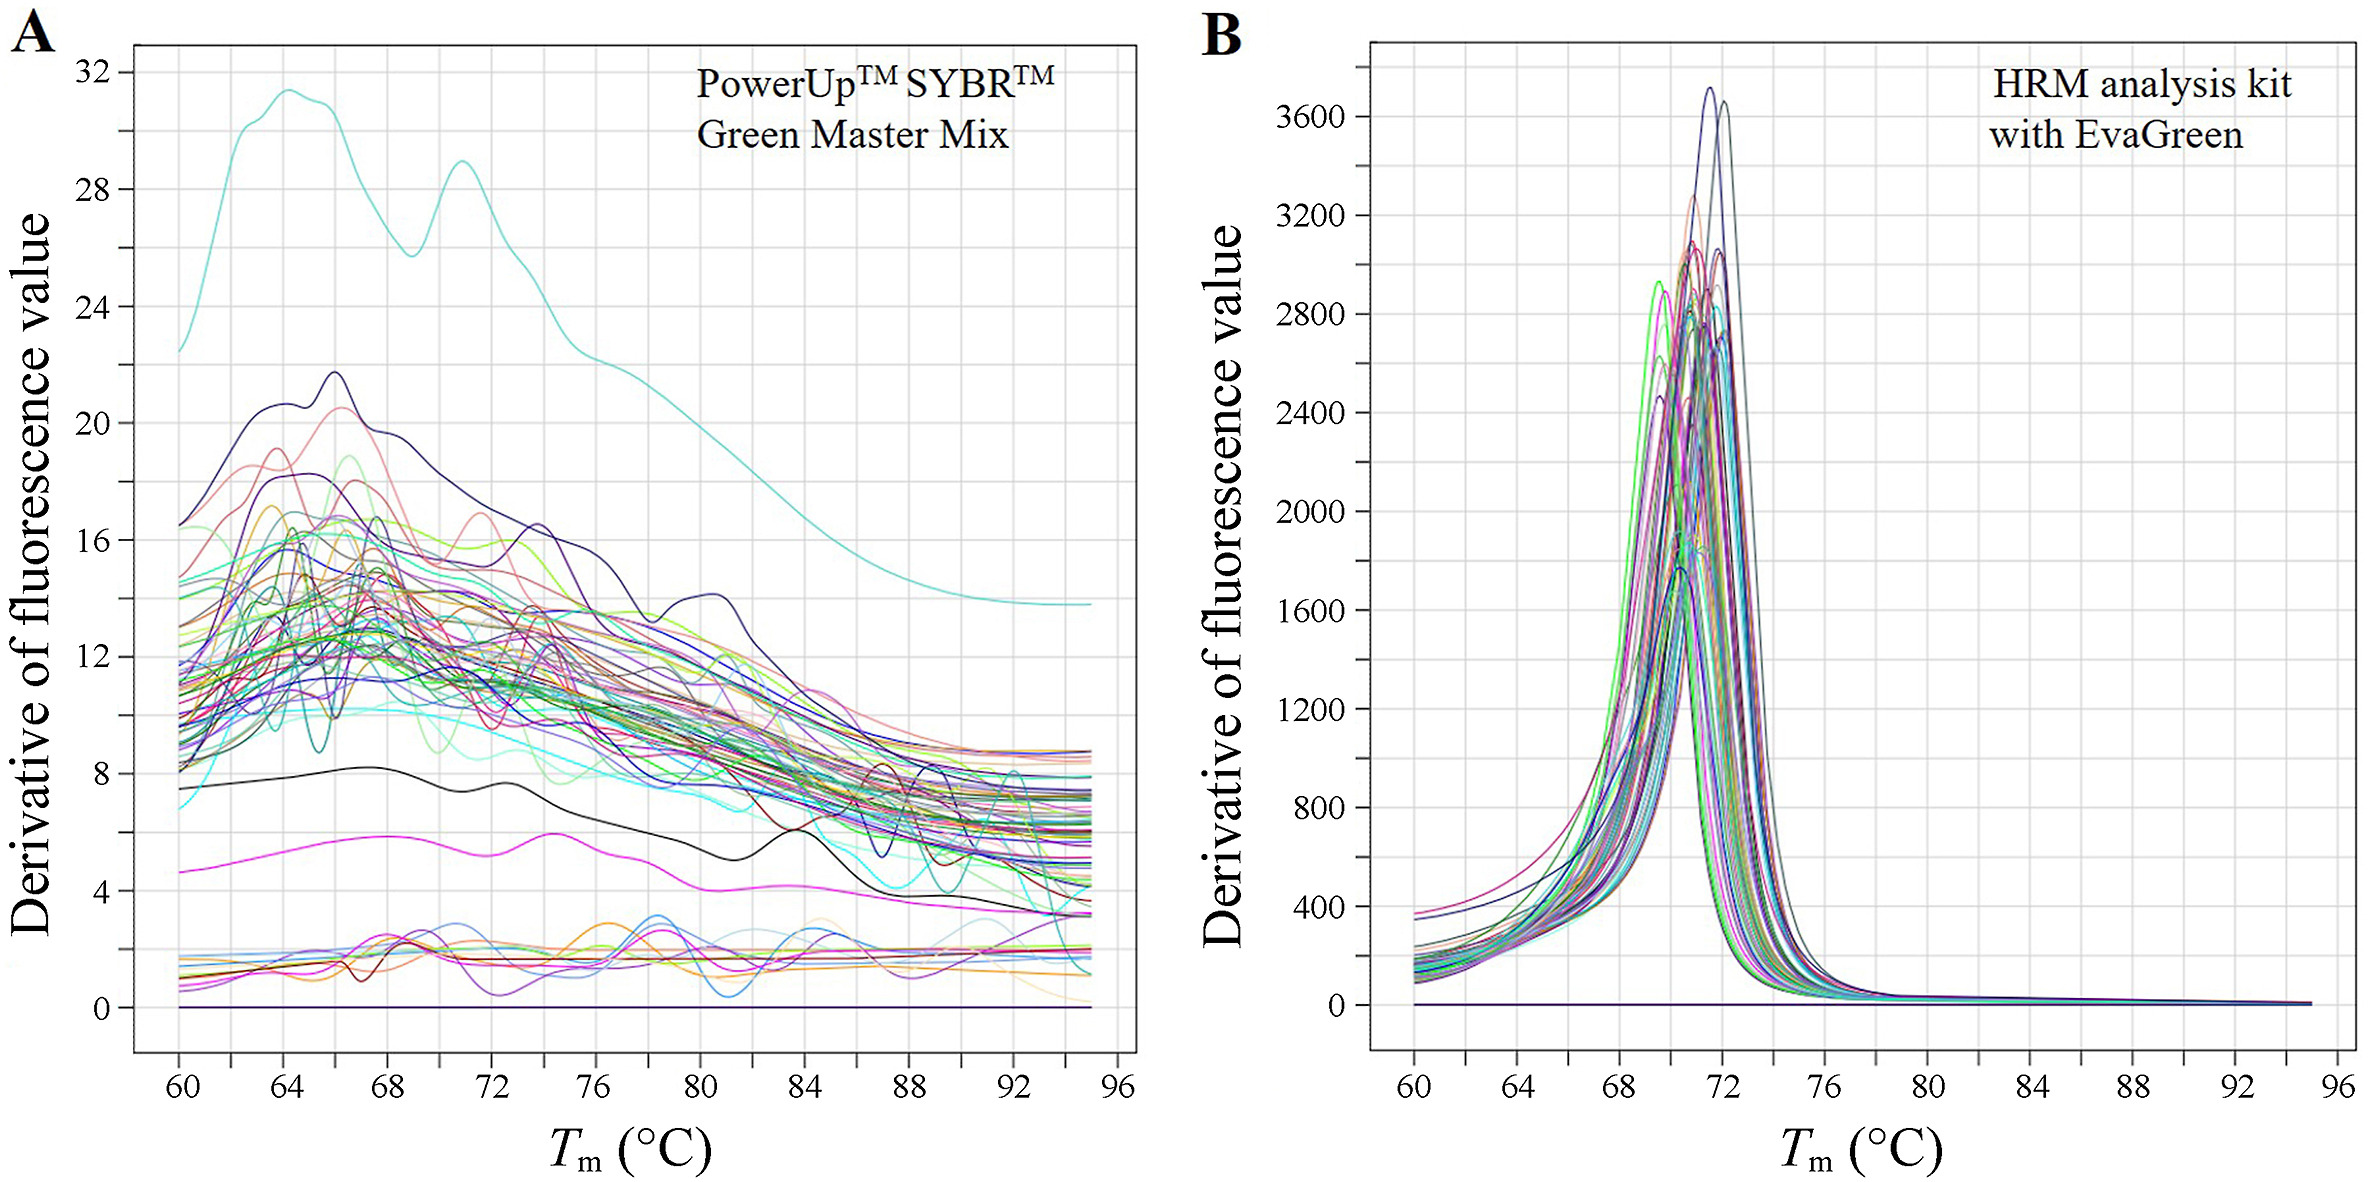
We used 50 Bisulfite-converted pectoral major DNA to test the influence of different kit on the precision of Tm. As shown in Fig. 9, PowerUpTM SYBRTM Green Master Mix (Thermal Fisher Scientific, USA) did not generate any definite Tm signal under the standard MS-HRM system for the panel, while the HRM analysis kit with EvaGreen (Tiangen Biotech (Beijing) Co., LTD, China) generate clear, narrow and high intensity Tm signals for all samples.
Figure
9.
The melting curve of the MS-HRM system of the panel generated using PowerUpTM SYBRTM Green Master Mix (Thermal Fisher Scientific, USA) (A) and the HRM analysis kit with EvaGreen (Tiangen Biotech (Beijing) Co., LTD, China) (B). The template was Bisulfite-converted DNA from 50 pectoral major muscle samples.
4.1
Applicability of genomic methylation to origin discrimination
Epigenetic modifications influence the response of the organisms to environmental change through the variation in the gene expression (McCaw et al., 2020). Molecular identification of source population of the animal whether wild-captured or captive-bred requires biomarkers that reveal definite signals of gene-environment interaction that differ among heterogeneous environment factors. Accumulating studies show that the environmental signals can be transducted into local tissues and cells to trigger up and/or down regulation of signaling pathways to produce a responsive gene expression profile. This responsive protocol can be recorded on the genome through epigenetic modifications, including DNA methylation, histone modification and non-coding RNAs (Wu and Eckhardt, 2023). Because DNA methylation is a covalent modification and chemically stable (Miller and Sweatt, 2007; Singer, 2019), methylation profile could largely persist even the biological material is under degradation in an environment (Staunstrup et al., 2016; Groen et al., 2018). Therefore, DNA methylation provides informative and easy-to-profile approach to differentiate between captive and wild animals.
In terms of skeletal muscle, the apparent difference between wild and captive animals is the intensity of utilization, more vigorous in the wild than in captivity. This resembles the skeletal muscles of humans and mice before and after exercise that methylation patterns of genes alter dramatically (Diefenbach et al., 2000; Kokoszynski et al., 2012). Our results showed differential methylation patterns in Common Pheasant, including 13,507 DMRs throughout the whole genome (Fig. 1). However, we noticed that, for most of DMGs, the methylation rate may vary greatly within the same group, greater among captive pheasants than wild ones (Fig. 8). This is likely the results of environment pressure whereas the animal is more relaxed in captivity than in the wild (Musil and Connelly, 2009). Therefore, the discriminant power of such loci would be limited though the means differ significantly (Fig. 8). It is not easy to find ideal locus with extreme inter-group difference and very little intra-group variation. For this reason, we had to choose multiple loci for our panel to achieve satisfied overall discriminant power by combining the limited contribution of each one.
Studies have shown that exercise may induce the elevation in MAPK signal activity and improve the adaptation and/or flexible reaction of skeletal muscle to recurring sessions of exercise (Kramer and Goodyear, 2007). Calcium acts as the second messenger in the skeletal muscle during exercise, transforming neuromuscular activity into changes in relevant gene transcription (Koulmann and Bigard, 2006) and promoting mitochondria biogenesis (Wright et al., 2007). KEGG analysis in this study proposed a few notable DMGs in the two pathways showing extreme inter-group difference (Fig. 4), five of which were selected to set up our panel additionally due to their effective MS-HRM system (Table 1 and Fig. 8). Of course, there are numerous such candidate loci in other pathways or regions not enriched by KEGG that may outperform this panel. However, the mechanism of differential response to different exercise (including other factors) may also be applicable to most taxa, at least of endotherms. We believe the methylation-based strategy has broad applicability to differentiate captive from wild animals.
4.2
Performance and influencing factor of the panel
All our five panel loci revealed significant difference in methylation rate between captive and wild pheasants (Fig. 8). The discriminant power of each varied from the least 63.70% to the highest 100.00% (Table 1). The overall discriminant power of the whole panel reached 91.63% and even to 100.00% (Table 2), suggesting extraordinary ability to differentiate captive from wild pheasants.
However, our data also showed that the discriminant power varied depending on the skeletal muscles. On one hand, the discriminant power of one locus varied from muscle to muscle, and on the other hand, different locus had different discriminant power for the same muscle (Table 1). It seemed that small muscles, like the neck muscle which is responsible for adjusting neck and head positions and Triceps brachii responsible for extension of the forearm, had lower discriminant accuracy than large muscles that exert great contraction force, like pectoral major, gastrocnemius and biceps femoris (Table 1). These suggest that methylation of selected loci accurately reflects functional requirement of each muscle, and large muscles should be given priority in forensic practice.
We chose to use MS-HRM approach to test the methylation rate for the panel. The amplified fragment size we designed for this panel were between 70 and 150 bp. This range has great tolerance to DNA degradation when samples are not preserved well. The variation coefficient of triplicate experiments across all loci ranged from 0 to 0.097, suggesting excellent repeatability (Appendix Tables S7–1 to Tables S7–5). Our test also showed that MS-HRM systems were compatible to different qPCR devices, could reliably detect methylation rate signal (Tm) from DNA as little as 0.2 ng/μL (Table 3) with total cost of US$ 6.22 per sample. Lastly, the MS-HRM system for all five loci seems universal to mammals and birds (Table 4). This provides an extending imagination that the validity of this panel deserves testing for broad range of taxa, if we do not consider the scenario of cross-species DNA contamination.
However, our comparative test also revealed that PowerUpTM SYBRTM Green Master Mix failed to generate any qualified Tm signal under the standard MS-HRM system, suggesting the precision can be greatly impacted by components of reaction system. The SYBRTM Green dye in this kit intercalates between double-stranded DNA providing very strong fluorescent signal (Cao and Shockey, 2012). However, it has been shown to inhibit the PCR reaction and has a narrow dynamic range and lower reproducibility than other detection chemistries (Gudnason et al., 2007). Meanwhile, it affects melting temperature of amplicons and redistributes during melting leading to complicated melting curve (Ririe et al., 1997). In contrast, the EvaGreen dye in HRM analysis kit is less inhibitory to PCR than SYBR Green (Mao et al., 2007). It binds to double-stranded DNA under a release-as-required mechanism, reducing PCR hindrance and enabling HRM analysis to spot single-base differences even at saturated dye concentrations (Eischeid, 2011). The intensity of derived fluorescent signal of generated using PowerUpTM SYBRTM Green Master Mix were below 22 and indefinite (Fig. 9), suggesting PCR amplification was inhibited. This proposed a caution that commercial kits, not limited to the SYBR Green Master Mix here, should be validated for the panel prior to application.
However, our study still faces several limitations that warrant careful consideration. Although our findings suggest that the overall methylation marks remain largely stable, tissue degradation and environmental variability pose significant challenges. Muscle tissue is susceptible to physical degradation due to temperature fluctuations, microbial contamination, and prolonged post-mortem intervals. While the DNA methyltransferases (DNMTs) responsible for establishing methylation marks become inactive after death—thereby preventing further enzymatic alterations—the physical degradation of the tissue may still compromise the quality and integrity of the extracted DNA. Despite our protocols aiming to minimize these effects, the inherent variability of field conditions remains a notable limitation. Future studies employing more controlled experimental designs and standardized sample handling procedures will be essential to mitigate these interference factors.
5.
Conclusions
This study takes the Common Pheasant as an example to presents a strategy to differentiate captive-bred from wild-captured animals using differential methylation rate of skeletal muscle DNA. The global methylation patterns are able to discriminate reliably, but restricted to experimental cost for whole genome methylation sequencing and the requirement of high quality reference genome. The large number of DMGs across the whole genome provide valuable resource of epigenetic markers, but most show great intra-group variation and limited discriminant power. We selected five loci to set up a panel and MS-HRM systems to quantify the methylation rate. The panel reached 91.63% to 100.00% discriminant accuracy and revealed excellent repeatability, reproducibility, sensitivity and universality to mammals and avian species. We also show significant variability of discriminant power among different muscles and propose priority to use large muscles in forensic practice.
The filtered deduplicated reads have been deposited to the NCBI Short Read Archive (SRA), bioproject PRJNA1071272.
Ethics statement
This study was approved by the Ethics Committee of Northeast Forestry University (No. 2022081 on Mar. 5, 2022). All procedures were performed in accordance with the ethical guidelines of the 1975 Declaration of Helsinki. Written informed consent was obtained from all participants included in the study.
Declaration of competing interest
The authors declare that they have no known competing financial interests or personal relationships that could have appeared to influence the work reported in this paper.
Acknowledgments
The authors are grateful to the Lesser Xing’an Mountains Wildlife Rescue and Breeding Center of Heilongjiang Province, and Qinhuangdao Wildlife Park for their kind sample donation. Special thanks go to Prof. Wei Zhang, Associate Prof. Su Ying Bai and Bo Li at College of Wildlife and Protected Area, Northeast Forestry University for their technical assistance, support of lab facilities and valuable comments on experiment design and the manuscript.
Argamjav, B., Morioka, K., Rosyadi, I., Yunus, M., Sato, H., 2023. Eimerian and capillariid infection in farmed ring-necked pheasant (Phasianus colchicus karpowi) in Ehime, Japan, with special reference to their phylogenetic relationships with congeners. Parasitol. Res. 122, 3189–3203.
Aronson, D., Violan, M.A., Dufresne, S.D., Zangen, D., Fielding, R.A., Goodyear, L.J., 1997. Exercise stimulates the mitogen-activated protein kinase pathway in human skeletal muscle. J. Clin. Investig. 99, 1251–1257.
Balfour, M.J., 2022. The ring-necked pheasant (Phasianus colchicus) industry within the United Kingdom and the threat posed by Mycoplasma gallisepticum: a review. Vet. Sci. 9, 391.
Barrès, R., Yan, J., Egan, B., Treebak, J.T., Rasmussen, M., Fritz, T., et al., 2012. Acute exercise remodels promoter methylation in human skeletal muscle. Cell Metab. 15, 405–411.
Benziane, B., Burton, T.J., Scanlan, B., Galuska, D., Canny, B.J., Chibalin, A.V., et al., 2008. Divergent cell signaling after short-term intensified endurance training in human skeletal muscle. Am. J. Physiol. Endocrinol. Metab. 295, E1427-E1438.
Blanchet, C., Lucas, M., Julien, P., Morin, R., Gingras, S., Dewailly, É., 2005. Fatty acid composition of wild and farmed Atlantic salmon (Salmo salar) and rainbow trout (Oncorhynchus mykiss). Lipids 40, 529–531.
Brown, W.M., 2015. Exercise-associated DNA methylation change in skeletal muscle and the importance of imprinted genes: a bioinformatics meta-analysis. Br. J. Sports Med. 49, 1567–1578.
Butchart, S.H.M., Lowe, S., Martin, R., Symes, A., Westrip, J.R.S., Wheatley, H., 2018. Which bird species have gone extinct? A novel quantitative classification approach. Biol. Conserv. 227, 9–18.
Cao, H.P., Shockey, J.M., 2012. Comparison of TaqMan and SYBR Green qPCR methods for quantitative gene expression in tung tree tissues. J. Agric. Food Chem. 60, 12296–12303.
Challender, D., MacMillan, D.C., 2014. Poaching is more than an enforcement problem. Conserv. Lett. 7, 484–494.
Chen, L., Huang, S.L., Si, P., 2007. Special mark and management information system for utilization and management of wildlife resources in China. J. North-East For. Univ. 35, 69–70.
Coals, P., Loveridge, A., Kurian, D., Williams, V.L., Ogden, R., 2021. DART mass spectrometry as a potential tool for the differentiation of captive-bred and wild lion bones. Biodivers. Conserv. 30, 1825–1854.
Diefenbach, D.R., Hardisky, R.T.S., 2000. Harvest and reporting rates of game-farm ring-necked pheasant. Wildl. Soc. Bull. 28, 1050–1059.
Eischeid, A.C., 2011. SYTO dyes and EvaGreen outperform SYBR Green in real-time PCR. BMC Res. Notes 4, 263.
Feng, H., Conneely, K.N., Wu, H., 2014. A Bayesian hierarchical model to detect differentially methylated loci from single nucleotide resolution sequencing data. Nucleic Acids Res. 42, e69.
Fromentin, J.M., Emery, M.R., Donaldson, J., Balachander, G., Barron, E.S., Chaudhary, R.P., et al., 2023. Challenges and pathways to the sustainable use of wild species. Glob. Environ. Change 81, 102692.
Gomez, I., Janardhanan, R., Ibanez, F.C., Beriain, M.J., 2020. The effects of processing and preservation technologies on meat quality: sensory and nutritional aspects. Foods 9, 1416.
Groen, K., Lea, R.A., Maltby, V.E., Scott, R.J., Lechner-Scott, J., 2018. Letter to the editor: blood processing and sample storage have negligible effects on methylation. Clin. Epigenet. 10, 22.
Harrison, R.D., 2011. Emptying the forest: hunting and the extirpation of wildlife from tropical nature reserves. Bioscience 61, 919–924.
Hinsley, A., King, E., Sinovas, P., 2016. Tackling illegal wildlife trade by improving traceability: a case study of the potential for stable isotope analysis. In: Potter, G., Nurse, A., Hall, M. (Eds.), The Geography of Environmental Crime, Palgrave Studies in Green Criminology. Palgrave Macmillan, London, pp. 91–119.
Hutchinson, A., Roberts, D.L., 2020. Differentiating captive and wild African lion (Panthera leo) populations in South Africa, using stable carbon and nitrogen isotope analysis. Biodivers. Conserv. 29, 2255–2273.
Kanzleiter, T., Jaehnert, M., Schulze, G., Selbig, J., Hallahan, N., Schwenk, R.W., et al., 2015. Exercise training alters DNA methylation patterns in genes related to muscle growth and differentiation in mice. Am. J. Physiol. Endocrinol. Metab. 308, E912-E920.
Kechin, A., Boyarskikh, U., Kel, A., Filipenko, M., 2017. CutPrimers: a new tool for accurate cutting of primers from reads of targeted next generation sequencing. J. Comput. Biol. 24, 1138–1143.
Kokoszynski, D., Bernacki, Z., Duszynski, L., 2012. Body conformation, carcass composition and physicochemical and sensory properties of meat from pheasants of different origin. Czech J. Anim. Sci. 57, 115–124.
Koulmann, N., Bigard, A.-X., 2006. Interaction between signalling pathways involved in skeletal muscle responses to endurance exercise. Eur. J. Physiol. 452, 125–139.
Kramer, H.F., Goodyear, L.J., 2007. Exercise, MAPK, and NF-kappa B signaling in skeletal muscle. J. Appl. Physiol. 103, 388–395.
Krueger, F., Andrews, S.R., 2011. Bismark: a flexible aligner and methylation caller for Bisulfite-Seq applications. Bioinformatics 27, 1571–1572.
Liang, D., Giam, X., Hu, S., Ma, L., Wilcove, D.S., 2023. Assessing the illegal hunting of native wildlife in China. Nature 623, 100.
Li, Q.J., Song, C., Xing, X.M., Ning, H.R., Xu, C., Gao, B., et al., 2017. Status of pheasant farming in China. China Poultry 39, 62–65 (in Chinese).
Li, Y., 2018. Effectiveness of Liver Mass Indices and Skeletal Muscle DNA Copy Number to Segregate Wild from Farmed King Rat Snake. Northeast Forestry University.
Liu, Y., Liu, S., Zhang, N., Chen, D., Que, P., Liu, N., et al., 2019. Genome assembly of the common pheasant Phasianus colchicus: a model for speciation and ecological genomics. Genome Biol. Evolut. 11, 3326–3331.
Long, Y.C., Widegren, U., Zierath, J.R., 2004. Exercise-induced mitogen-activated protein kinase signalling in skeletal muscle. Proc. Nutr. Soc. 63, 227–332.
Mao, F., Leung, W.-Y., Xin, X., 2007. Characterization of EvaGreen and the implication of its physicochemical properties for qPCR applications. BMC Biotechnol. 7, 76.
Mason, R.A.B., 2013. Wild mammals in captivity: principles and techniques for zoo management, 2nd edition. Austral Ecol. 38, e26.
McCaw, B.A., Stevenson, T.J., Lancaster, L.T., 2020. Epigenetic responses to temperature and climate. Integr. Comp. Biol. 60, 1469–1480.
McRae, L., Freeman, R., Geldmann, J., Moss, G.B., Kjær-Hansen, L., Burgess, N.D., 2022. A global indicator of utilized wildlife populations: regional trends and the impact of management. One Earth 5, 422–433.
Meng, Q.B., 2016. Use of Mandible Morphology to Discriminate Wild and Farmed American Minks. Northeast Forestry University.
Miller, C.A., Sweatt, J.D., 2007. Covalent modification of DNA regulates memory formation. Neuron 53, 857–869.
Moore, L.D., Le, T., Fan, G., 2012. DNA methylation and its basic function. Neuropsychopharmacology 38, 23–38.
Musil, D.D., Connelly, J.W., 2009. Survival and reproduction of pen-reared vs translocated wild pheasants Phasianus colchicus. Wildl. Biol. 15, 80–88.
Qi, Y.L., 2015. Assessment of the Effectiveness of Skull Morphometric Indices for Discrimination of Wild and Farmed American Minks. Northeast Forestry University.
Quaresma, M.A.G., Pimentel, F.B., Ribeiro, A.P., Ferreira, J.D., Alves, S.P., Rocha, I., et al., 2016. Lipid and protein quality of ring-necked pheasant (Phasianus colchicus) reared in semi-extensive conditions. J. Food Compos. Anal. 46, 88–95.
Ririe, K.M., Rasmussen, R.P., Wittwer, C.T., 1997. Product differentiation by analysis of DNA melting curves during the polymerase chain reaction. Anal. Biochem. 245, 154–160.
Rose, A.J., Hargreaves, M., 2003. Exercise increases Ca2+-calmodulin-dependent protein kinase Ⅱ activity in human skeletal muscle. J. Physiol. 553, 303–309.
Rose, A.J., Kiens, B., Richter, E.A., 2006. Ca2+-calmodulin-dependent protein kinase expression and signaling in skeletal muscle during exercise. J. Physiol. 574, 889–903.
Sharma, A.P., Kumar, V., Sinha, A.K., Ranjan, J., Kithsiri, H.M.P., Gudipati, V., 2010. Comparative fatty acid profiles of wild and farmed tropical freshwater fish rohu (Labeo rohita). Fish Physiol. Biochem. 36, 411–417.
Singer, B.D., 2019. A practical guide to the measurement and analysis of DNA methylation. Am. J. Respir. Cell Mol. Biol. 61, 417–428.
Staunstrup, N.H., Starnawska, A., Nyegaard, M., Christiansen, L., Nielsen, A.L., Børglum, A., et al., 2016. Genome-wide DNA methylation profiling with MeDIP-seq using archived dried blood spots. Clin. Epigenet. 8, 81.
Sun, J., Zhou, X., Xu, Y., Hua, Y., Dahmer, T.D., Yang, S., 2021. Morphological differences of hindlimb levers between wild and farmed American mink (Neovison vison) and implications for reintroduction of mustelids. J. For. Res. 32, 867–875.
Tensen, L., 2016. Under what circumstances can wildlife farming benefit species conservation? Glob. Ecol. Conserv. 6, 286–298.
Van, T.N., Newman, S., Padungtod, P., 2023. Captive wildlife management survey in Vietnam, 2015-2021. One Health 16, 100543.
Wang, B.X., Ma, Y., Hua, A., Xu, A.C., Yang, S.H., 2020. Wild or farmed? A pilot study on determining origin of wildlife meat using methylation rate of ACTN3 gene and American mink. Mammal Res. 65, 599–605.
Wang, W.X., Yang, L.L., Hu, Y.J., Chen, S.Z., Huang, S.L., 2019. A study of the influencing mechanism of wildlife captive breeding on their population conservation. World For. Res. 32, 54–60.
Wright, D.C., Geiger, P.C., Han, D.H., Jones, T.E., Holloszy, J.O., 2007. Calcium induces increases in peroxisome proliferator-activated receptor γ coactivator-1α and mitochondrial biogenesis by a pathway leading to p38 mitogen-activated protein kinase activation. J. Biol. Chem. 282, 18793–18799.
Wu, H., Eckhardt, C.M., 2023. Molecular mechanisms of environmental exposures and human disease. Nat. Rev. Genet. 24, 332–344.
Xia, R., Huang, X.M., Yang, S.H., Xu, Y.C., Dahmer, T.D., 2011. Morphometric discrimination of wild from farmed Dybowski’s frog (Rana dybowskii) based on hindlimb length. J. For. Res. 22, 269–274.
Yang, S.H., Huang, X.M., Xia, R., Xu, Y.C., Dahmer, T.D., 2011. Use of femur bone density to segregate wild from farmed Dybowski’s frog (Rana dybowskii). Forensic Sci. Int. 207, 61–65.
Zhou, X.L., Xu, Y.C., Yang, S.H., Hua, Y., Stott, P., 2015. Effectiveness of femur bone indexes to segregate wild from captive minks, Mustela vison, and forensic implications for small mammals. J. Forensic Sci. 60, 72–75.

 DownLoad:


 Email Alerts
 RSS Feeds