School of Ecology and Nature Conservation, Beijing Forestry University, Beijing, 100083, China
b.
Center for East Asian-Australasian Flyway Studies, Beijing Forestry University, Beijing, 100083, China
c.
Shenzhen Mangrove Wetlands Conservation Foundation, Shenzhen, 518040, China
d.
Qingdao Birding Association, Qingdao, 266100, China
Funds: This research was funded by the National Natural Science Foundation of China (No. 31971400), the “Saving Spoon-billed Sandpiper” of Shenzhen Mangrove Wetlands Conservation Foundation (MCF) and the Fundamental Research Funds for the Central Universities (No. BLX202144)
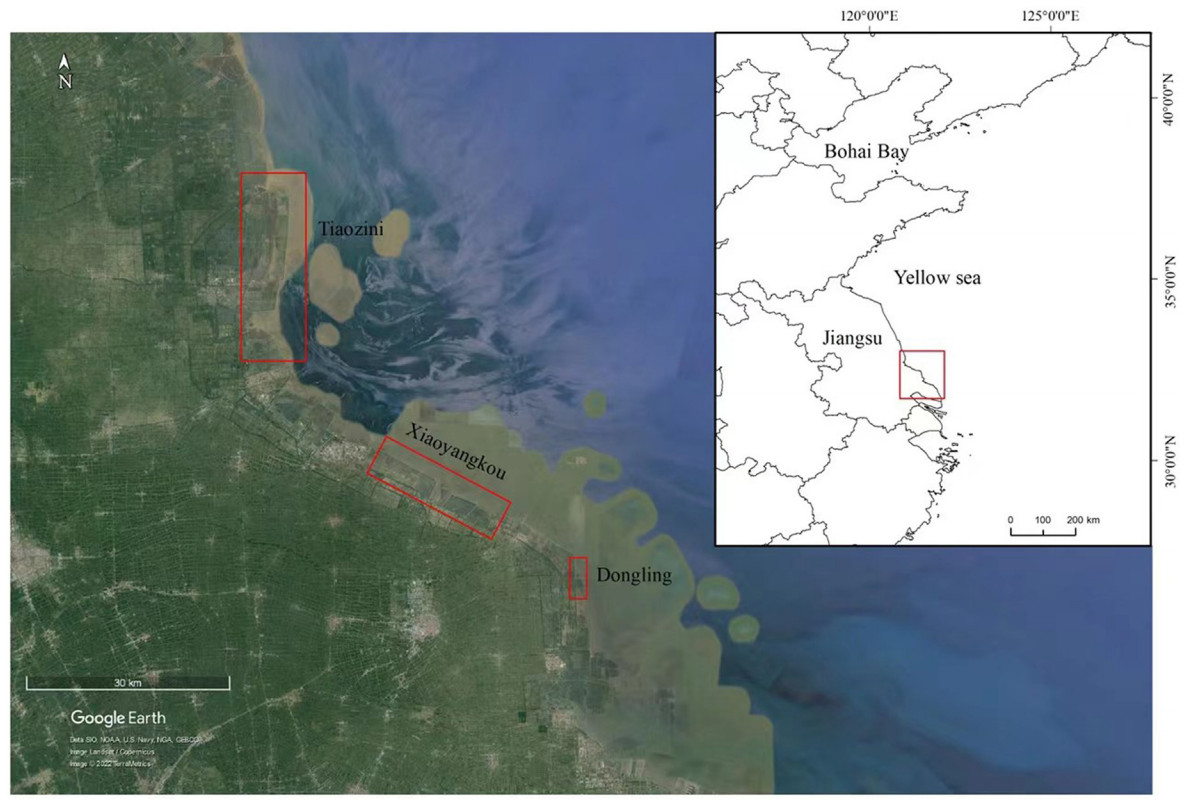
Nordmann's Greenshank (Tringa guttifer) is a globally endangered species that has received little research attention. It is threatened by rapid habitat loss, an incomplete network of protected sites, and lack of long-term data on population dynamics. Citizen science data can be combined with survey data to support population estimation and conservation gap analysis. From 2020 to 2021, Nordmann's Greenshank was surveyed in Tiaozini, Xiaoyangkou, and Dongling on the southern coast of Jiangsu Province, China, and the global population of the species was re-evaluated using the data obtained. We integrated citizen science data from eBird and the China Bird Report from 2000 to 2020 with the survey results to identify important habitats harboring over 1% of its total population, and compared this data with existing protected areas to identify gaps in its global conservation. Our survey found that Tiaozini supported at least 1194 individuals. Consequently, its global population was re-estimated to be 1500-2000. Moreover, 45 important habitats were identified based on citizen data and survey results. Although 44.4% and 50.0% of the priority sites in the world and China, respectively, are located outside protected areas, the Conservation Effectiveness Index (C) is 68.4% and 71.1%, respectively, showing that the current coverage of protected areas for this part of its range is reasonable. This study presents the most complete and recent population data to date. Tiaozini is the most important migration stopover site for Nordmann's Greenshanks. The species is under threat in terms of breeding, wintering, and stopover sites. Therefore, we suggest improving monitoring, establishing new protected sites to complete the habitat protection network, and improving the effectiveness of existing habitat protection strategies, including further developing high tide roosting sites.
Physiological processes have distinctive sequences and intensities to allow efficient responses to the organism needs over time (e.g., muscle contraction, testosterone secretion and photoperiod; Randall et al., 2001; Wingfield et al., 2001). Bird moult, the periodic process of plumage renewal, has also characteristic sequences and intensities that largely depend on species size, flight habits, and ability to lose flight-capacity (Pyle, 2005; Zuberogoitia et al., 2018). Thus, wing-moult intensity correlates to two main wing-moult sequence strategies: sequential in bird species that retain flight during moult and simultaneous in species that stop flying during remex moult. While sequential moult of remiges is heterogeneous across non-passerines (i.e., show multiple combinations of direction of replacement and number of focal remiges; Edwards and Rohwer, 2005; Rohwer and Broms, 2013), it is quite homogenous in passerines (see exceptions in Williamson, 1972; Pyle et al., 2016; Kiat, 2017).
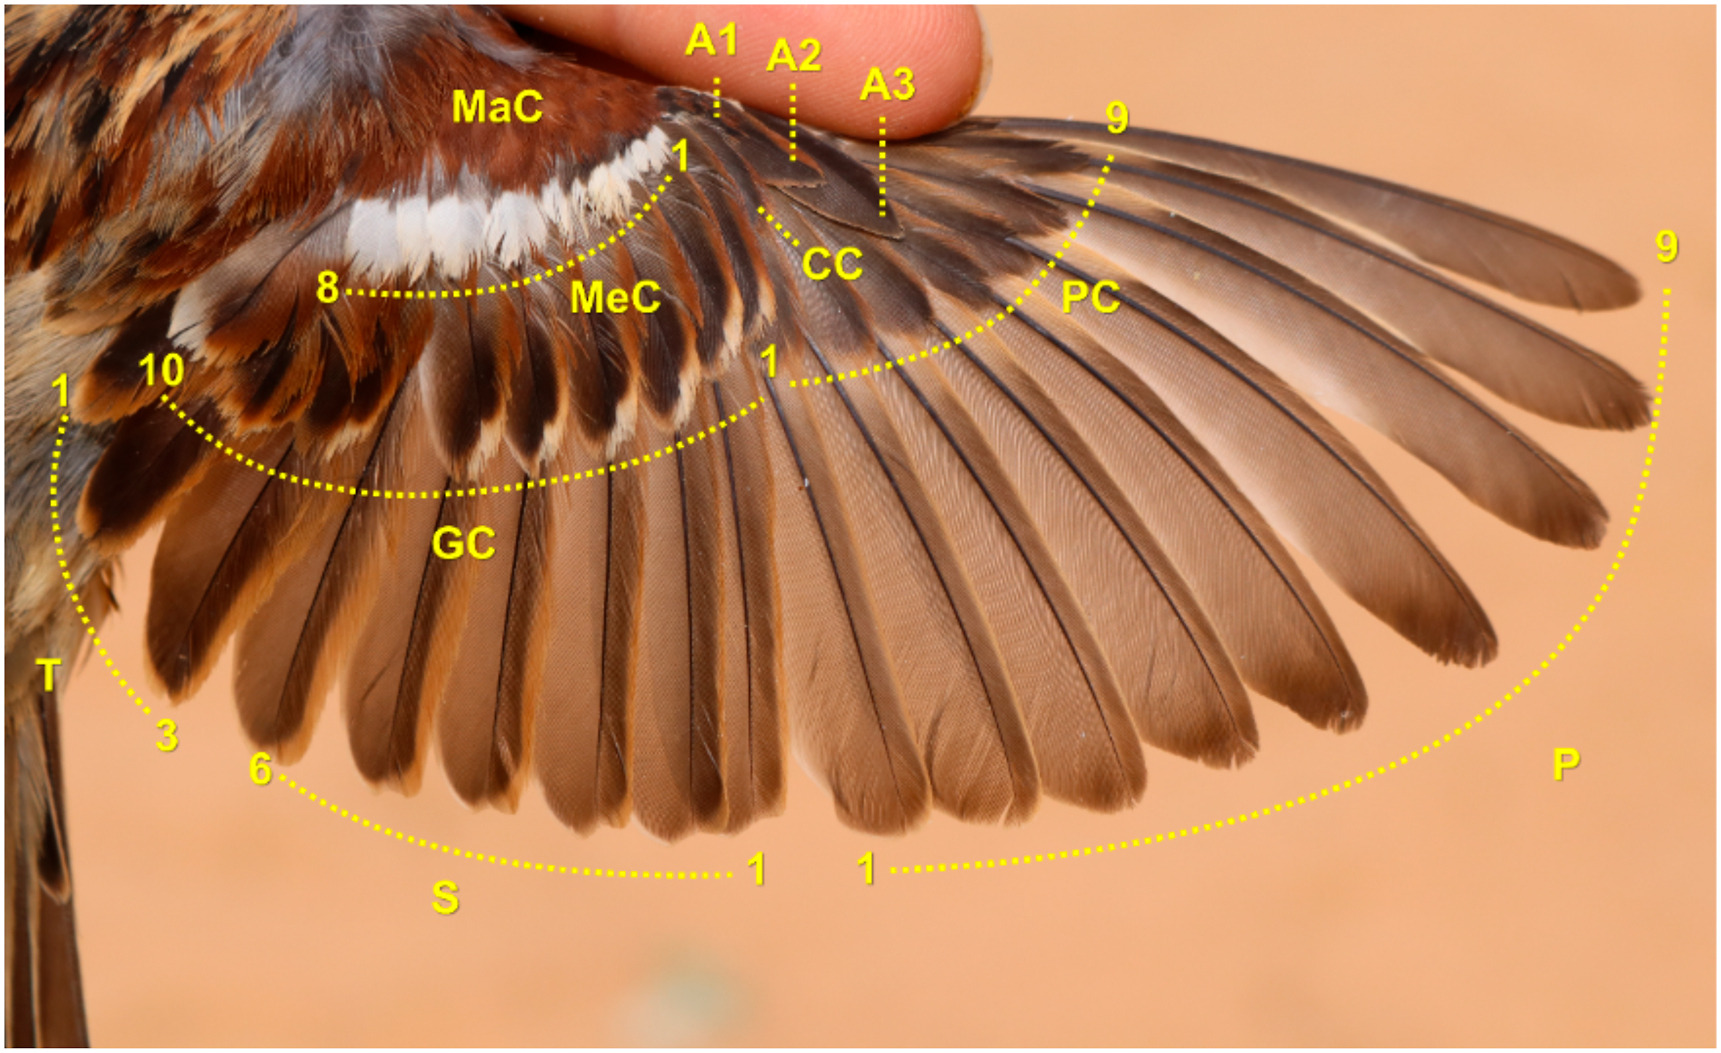
The complete-moult sequence of passerines is characterised by primaries being shed consecutively from the innermost outwards (P1 to P10; Fig. 1), the secondaries from the outermost inwards (S1 to S6), while the central tertial is shed first, followed by the inner and then the outer (Dwight, 1900; Newton, 1966; Rohwer, 2008). The moult-sequence of wing coverts is not as well defined, save for the primary coverts, each one being shed with its corresponding primary. In the Eurasian Bullfinch (Pyrrhula pyrrhula), the greater coverts are usually shed more or less simultaneously or in quick succession from the innermost outwards, the median-coverts are moulted almost simultaneously, whereas the carpal covert and the alula feathers are moulted together (Newton, 1966). In the Reed Bunting (Emberiza schoeniclus), the greater coverts are not moulted synchronously, but proceed from a central feather towards both directions. The carpal covert is moulted along with the greater coverts; however, the innermost greater covert GC10 is moulted later (Kasparek, 1979; Fig. 1). Body moult in the Eurasian Bullfinch starts by dorsal, ventral, and scapular feathers shortly after the onset of primary moult, with the remaining tracts, including the underwing, showing some delay (Newton, 1966). Body moult finishes approximately by the time remex moult finishes (Newton, 1966; Zeidler, 1966).
Figure
1.
Wing feather tracts and numbering used in this article. PC9 and P10 are reduced and not visible in the photograph. We followed numbering by Jenni and Winkler (2020b) save for the tertials, whose moult clearly differs from that of the secondaries. Adult male House Sparrow in NE Iberia on May 1, 2019.
Here, we first provide a quantitative characterisation of the moult-sequence of the House Sparrow (Passer domesticus) that allows its statistical treatment, unfeasible using previous descriptions (Zeidler, 1966). This species is a medium-small sized non-migratory passerine of flapping flight that undergoes one annual moult, already complete since its first year of life (Cramp and Perrins, 1994). To understand the implications of moult sequence it is paramount to determine the order of replacement of wing and tail feathers within tracts and the order of activation among feather tracts; therefore, we provide within-tract wing- and tail-moult sequences and among-tract moult sequences. We also provide a featherwise wing- and tail-moult sequence in an attempt to integrate moult sequence within and between wing- and tail-feather tracts.
Secondly, we examined the relationship between moult sequence and moult intensity. Their interaction in the wing should allow the control of the aerodynamic loss and the spatiotemporal regulation of the production of feather material without compromising the protection of the growing feathers. Testing the association between wing-moult sequence and the aerodynamic function can be done indirectly by comparing moult gaps of empirical and simulated sequence data. Since detrimental effects of moult gaps vary in intensity across remiges (Hedenström and Sunada, 1999), we expect that remex-moult intensity deviates from uniformity for empirical sequences.
1.2
Protection and constraint hypotheses
Growing feathers are highly vascularised and easily broken when hit or rubbed. Blood loss, growth abnormalities and function loss may follow (van Zeeland and Schoemaker, 2014). Zeidler (1966) already hypothesised that moult sequence among wing-feather tracts may have evolved to avoid feather pins from being exposed. Function of moult-sequence within wing-feather tracts is not apparent, although the outward moult-sequence of primaries could prevent growing primaries from being bent upward by lift forces during flight (Noordhuis, 1989). The lack of clear moult-sequences within wing-covert tracts makes difficult to associate them with any particular function. On the other hand, moult-sequence among wing-feather tracts could also be related to protection reasons. For example, greater coverts grow before secondaries so that the fragile bases of the latter will not be exposed when they grow (Zeidler, 1966; Jenni and Winkler, 2020a). We tested this protection function among feather tracts by examining the order of moult activation between adjacent wing-feather tracts along the longitudinal axis (e.g., median and greater coverts are longitudinally adjacent, whereas greater and primary coverts are laterally adjacent; Fig. 1). This hypothesis predicts that adjacent wing feathers (from different tracts) along the longitudinal axis will not grow simultaneously.
Regardless of wing-moult sequence functions, moult certainly affects aerodynamics and flight ability while it is underway (Chai et al., 1999). In general, detrimental effects of moult are small, and birds seem to be able to make biomechanical adjustments to compensate for the loss of wing area (Bridge, 2003, 2008). For example, the Eurasian Curlew (Numenius arquata) increases wingstroke-frequency from about 240 to about 280 strokes/min at the initial stages of moult (Sach, 1968). In the Common Starling (Sturnus vulgaris), reduced take-off performance occurs at mid primary-moult (Swaddle and Witter, 1997). However, when wing-moult intensity is very high causes flight impairment. Thus, some passerine species in northern latitudes present large wing gaps during moult and become nearly flightless due to strong time constraints that force them to moult as fast as possible (Haukioja, 1971; Hegelbach, 2014). But not only gap size has a detrimental effect on aerodynamic performance, also gap position and aspect ratio influence on the effect's magnitude (Hedenström and Sunada, 1999; Williams and Swaddle, 2003). In high aspect-ratio wings, flight performance decreases when the gap is at the wing tip (Chai, 1997). Theoretical studies also conclude that flight performance is most negatively affected when the moult gap occurs beyond the wingtip (Hedenström and Sunada, 1999).
However, reduction of aerodynamic performance may not be the only factor driving moult intensity. Physiological limitations on synthesis or deposition of feather material may play an important role too. Although some studies have shown a peak of overall feather-mass production at mid moult (Seel, 1976; Wijnandts, 1984), the rate of growth of primaries is constant except at the beginning and end, which could be interpreted as the by-product of physiological limitations (Dawson, 2003). The rate of feather production is likely limited by competition with other processes for energy and resources, but it may also be locally limited by trade-offs with, for example, aerodynamic constraints (Jenni and Winkler, 2020b). The latter could explain why the Eurasian Bullfinch sheds its longest primaries (P5 to P8) at longer intervals than the rest while shedding its secondaries at progressively shorter intervals (Newton, 1967): remex-mass production would interact with the aerodynamic effect of wing gaps so that it could be relaxed or tightened to control gap size.
Our third objective is to test two hypotheses on constraints of moult intensity. Since magnitude of aerodynamic performance correlates to moult gap position and size (Hedenström and Sunada, 1999), it can be hypothesised that moult has evolved to reduce its detrimental effects while it is underway. Thus, our first hypothesis states that to reduce magnitude of its negative effects on flight performance, moult gaps (and hence moult intensity) will be smaller when the wing feathers that cause larger aerodynamic losses are being moulted, whereas shedding lags will be longer between the remiges that make these gaps. Accordingly, we expect lower remex-moult intensity and longer shedding lags for the innermost primaries and outermost secondaries, as well as the primaries beyond the wingtip (Hedenström and Sunada, 1999). Furthermore, anatomical constraints pose additional limits to the synthesis and deposition of feather material (Rohwer et al., 2009). The theoretical upper physiological limits may be further lowered by competition for the use of energy and materials among feather tracts or with other physiological processes (e.g., immune system; Cornelius et al., 2011). Our second hypothesis regarding moult intensity constraints states that moult will be limited by physiological constraints. In accordance, we expect moult intensity to level off as moult progresses, and therefore moult speed will show a plateau not a peak.
2.
Materials and methods
2.1
Dataset
As part of the PASSERCAT project (Covas et al., 2017), we set up two study sites in Parc de la Ciutadella, a 17.5-ha park in Barcelona (41°23′21″ N, 2°11′6″ E). Both sites had six funnel traps with freely accessible peanut feeders and ad libitum feeding for small-size birds. During eight weeks, from mid-August to early October from 2018 until 2022 (i.e., coinciding with the moulting season of the local House Sparrow population), the traps were deployed one morning per site per week, approximately from 08.00 until 14.00 h. Traps were checked hourly and captured birds were ringed and processed following PASSERCAT protocols (Covas et al., 2017). In September 2022, we also mist-netted and processed House Sparrows following the same protocols in two farms north of Barcelona: Cal Porta in Sant Fruitós de Bages (41°44′19″ N, 1°52′24″ E) and the Animal Health Research Center at the Universitat Autònoma de Barcelona campus (41°30′18″ N, 2°05′46″ E).
2.2
Moult sequence
Our dataset contained 313 House Sparrows in active moult, from all which we gathered wing and tail moult data. We only gathered body moult data from 171 of them (Guallar and Quesada, 2023). One of us (SG) scored separately the growth stage of seven body feather-tracts, the left rectrices, and eight feather tracts on the left wing of the bird: scapulars, dorsal (including neck), ventral (including throat and legs), under wing-, under tail-, and upper tail-coverts, head, six rectrices, 19 remiges, and all upper wing feathers (Fig. 1). The marginal coverts were scored as a percentage of the feathers growing in the whole feather tract (details in Guallar et al., 2021). Three fractions of each body-feather tract were scored as a percentage: growing, new, and old feathers. To account for the differences in moult progress within and among wing- and tail-feather tracts, the growth stage of each feather was scored on a continuous scale: 0 for old feathers, 0.5 for shed feathers which had not broken the skin yet, 100 for fully grown feathers, while intermediate stages of feather growth were scored based on the fact that feather length increases linearly (Winkler et al., 1988). For example, a feather grown up to 50% of its full length was scored 50. Since final feather length varies among feathers and individuals, scoring length is a method that relies on the observer's experience to estimate the length of the growing feather in relation to its final length when this is fully grown. We found this method was highly repeatable (see Appendix A).
Moult sequence has been largely referenced to moult onset or to time of year (Williamson, 1961; Newton, 1966, 1967). Alternatively, it has been referenced to primary P1 (the feather most frequently shed first at the onset of moult; Zeidler, 1966; Morton and Welton, 1973). Here, we use moult progress as reference, measured as the percentage of new and growing feathers in a moulting bird of the total feather mass or score (for mass gap and raggedness, respectively). This method avoids issues related to diversity of sequence (e.g., individuals that start moult by feathers other than primary P1) and to protracted moult start periods. We defined three moult sequences using our dataset: i) within each of the nine wing- and tail-feather tracts, ii) among feather tracts, and iii) featherwise for wing and tail feathers (the marginal coverts were treated and scored as a single feather; see above). We estimated mean moult order and 95% intervals using Bayesian bootstrapping (applying 4000 iterations), as implemented in the library bayesboot of the R environment (Bååth, 2016; R Core Team, 2022). We applied polynomial regression to show activation of feather tracts throughout moult progress (span = 0.75).
2.3
Moult intensity
Moult intensity can be defined as the amount of plumage growing at any given stage of the moult progress (i.e., the plumage growth observed in a given snapshot). Since moult intensity relates to several functions and factors, we chose adequate metrics to each purpose. Thus, the raggedness index is a proxy that quantifies the effect of wing-surface loss on flight capability (Bensch and Grahn, 1993; Hedenström, 1998). Raggedness was computed as the ∑i(100−scorei), where i = growing remex and score = % feather-growth defined above. To provide insight into how overall moult intensity builds up by the accumulation of feather tracts during the progress of moult, we derived an index from the raggedness index that could be applied to rectrices and to wing feathers other than remiges, the mass-gap index. Mass gap is the proportion of feather mass lacking to attain the final mass of each growing feather. The mass-gap index was computed as the ∑imassi(100−scorei), where i = growing feather. Both indexes have shortcomings. While the raggedness index does not take into account functional differences among remiges (i.e., it gives them the same value), the mass gap index is also dependent on feather size.
We weighed the six rectrices, the 19 remiges, and all upper wing feathers to the nearest 0.01 mg from four House Sparrows (left side feathers) collected from traffic collisions in north-eastern Iberia (Guallar and Quesada, 2023), and calculated mean feather mass for each feather. Because of their small mass, we weighed marginal and median coverts as full tracts. To estimate the weight of each median covert, we assumed that their weight relative to the weight of the full tract remains nearly constant across passerines. We used the weights of the median coverts from one Skylark (Alauda arvensis) and one Eurasian Jay (Garrulus glandarius), two larger species whose median coverts could be individually weighed (Guallar and Quesada, 2023). We imputed values for the 3.4% missing wing and tail feathers in our dataset using random forest predictions (Stekhoven and Buehlmann, 2012). We weighed the seven body feather tracts from another House Sparrow to the nearest 0.1 mg.
2.4
Protection and constraint hypotheses
We examined curves of moult progress for each wing-feather tract throughout the moult progress. Then, we calculated frequency at which at least one feather from each pair of overlapping feathers from longitudinally adjacent wing tracts is growing: tertials with greater covert GC10, secondaries with GC7 to GC2, and median coverts with GC1 to GC9 (Fig. 1). Tertials are largely arranged on top of each other presenting little lateral shift, whereby T1 protects the other two tertials and is protected by GC10. The role of GC8 and GC9 is deemed accessory since GC10 covers the insertion of T1 and the latter the insertion of the remaining tertials. For this reason, we first selected T1 growing simultaneously with another tertial, and then calculated frequency of T1 and GC10 growing simultaneously. We tested whether these frequencies deviated from both 0% and 50% simultaneous growth (i.e., nil and random, respectively), whereby non-significant differences from 0% combined with significant differences from 50% between feathers of adjacent tracts indicate support the protection hypothesis.
To test the aerodynamic-constraint hypothesis, we used the raggedness index as dependent variable. Since aerodynamic loss may be affected by the sheer number of growing remiges, and by the number of gaps within remiges, we also showed their relationship with moult progress using local polynomial regression. To investigate the influence of sequence on these three variables, we compared the empirical data (n = 293) with random moult sequences simulated from our dataset. For every case, we generated 10 simulations where moult intensity was kept constant while moult sequence was randomised, i.e., shuffling the values of every case (n = 2930). Since quantity of growing feathers and their size may potentially impose a limit on moult intensity, we also showed the relationship between percentage of growing feathers and moult progress. Then, we showed the moult intensity dynamics of each wing- and tail-feather tract and the lag between consecutive feathers within remex tracts. Lag was computed from the gap-size method of Rohwer and Broms (2013): gap between consecutive remiges multiplied by the length of the proximal feather and then divided by the average growth rate obtained from linear regression of primary elongation on rectrix elongation.
To test the second constraint hypothesis, we plotted the dynamics of both the mass of growing plumage and moult speed as moult progresses using local polynomial regression. We equated moult speed to the plumage mass gained by moulting birds recaptured in active moult at least once within a given year. Daily plumage mass was computed as (masst2−masst1)/(t2−t1), where t = date, and assigned to the mean value of moult progress.
3.
Results
3.1
Moult sequence
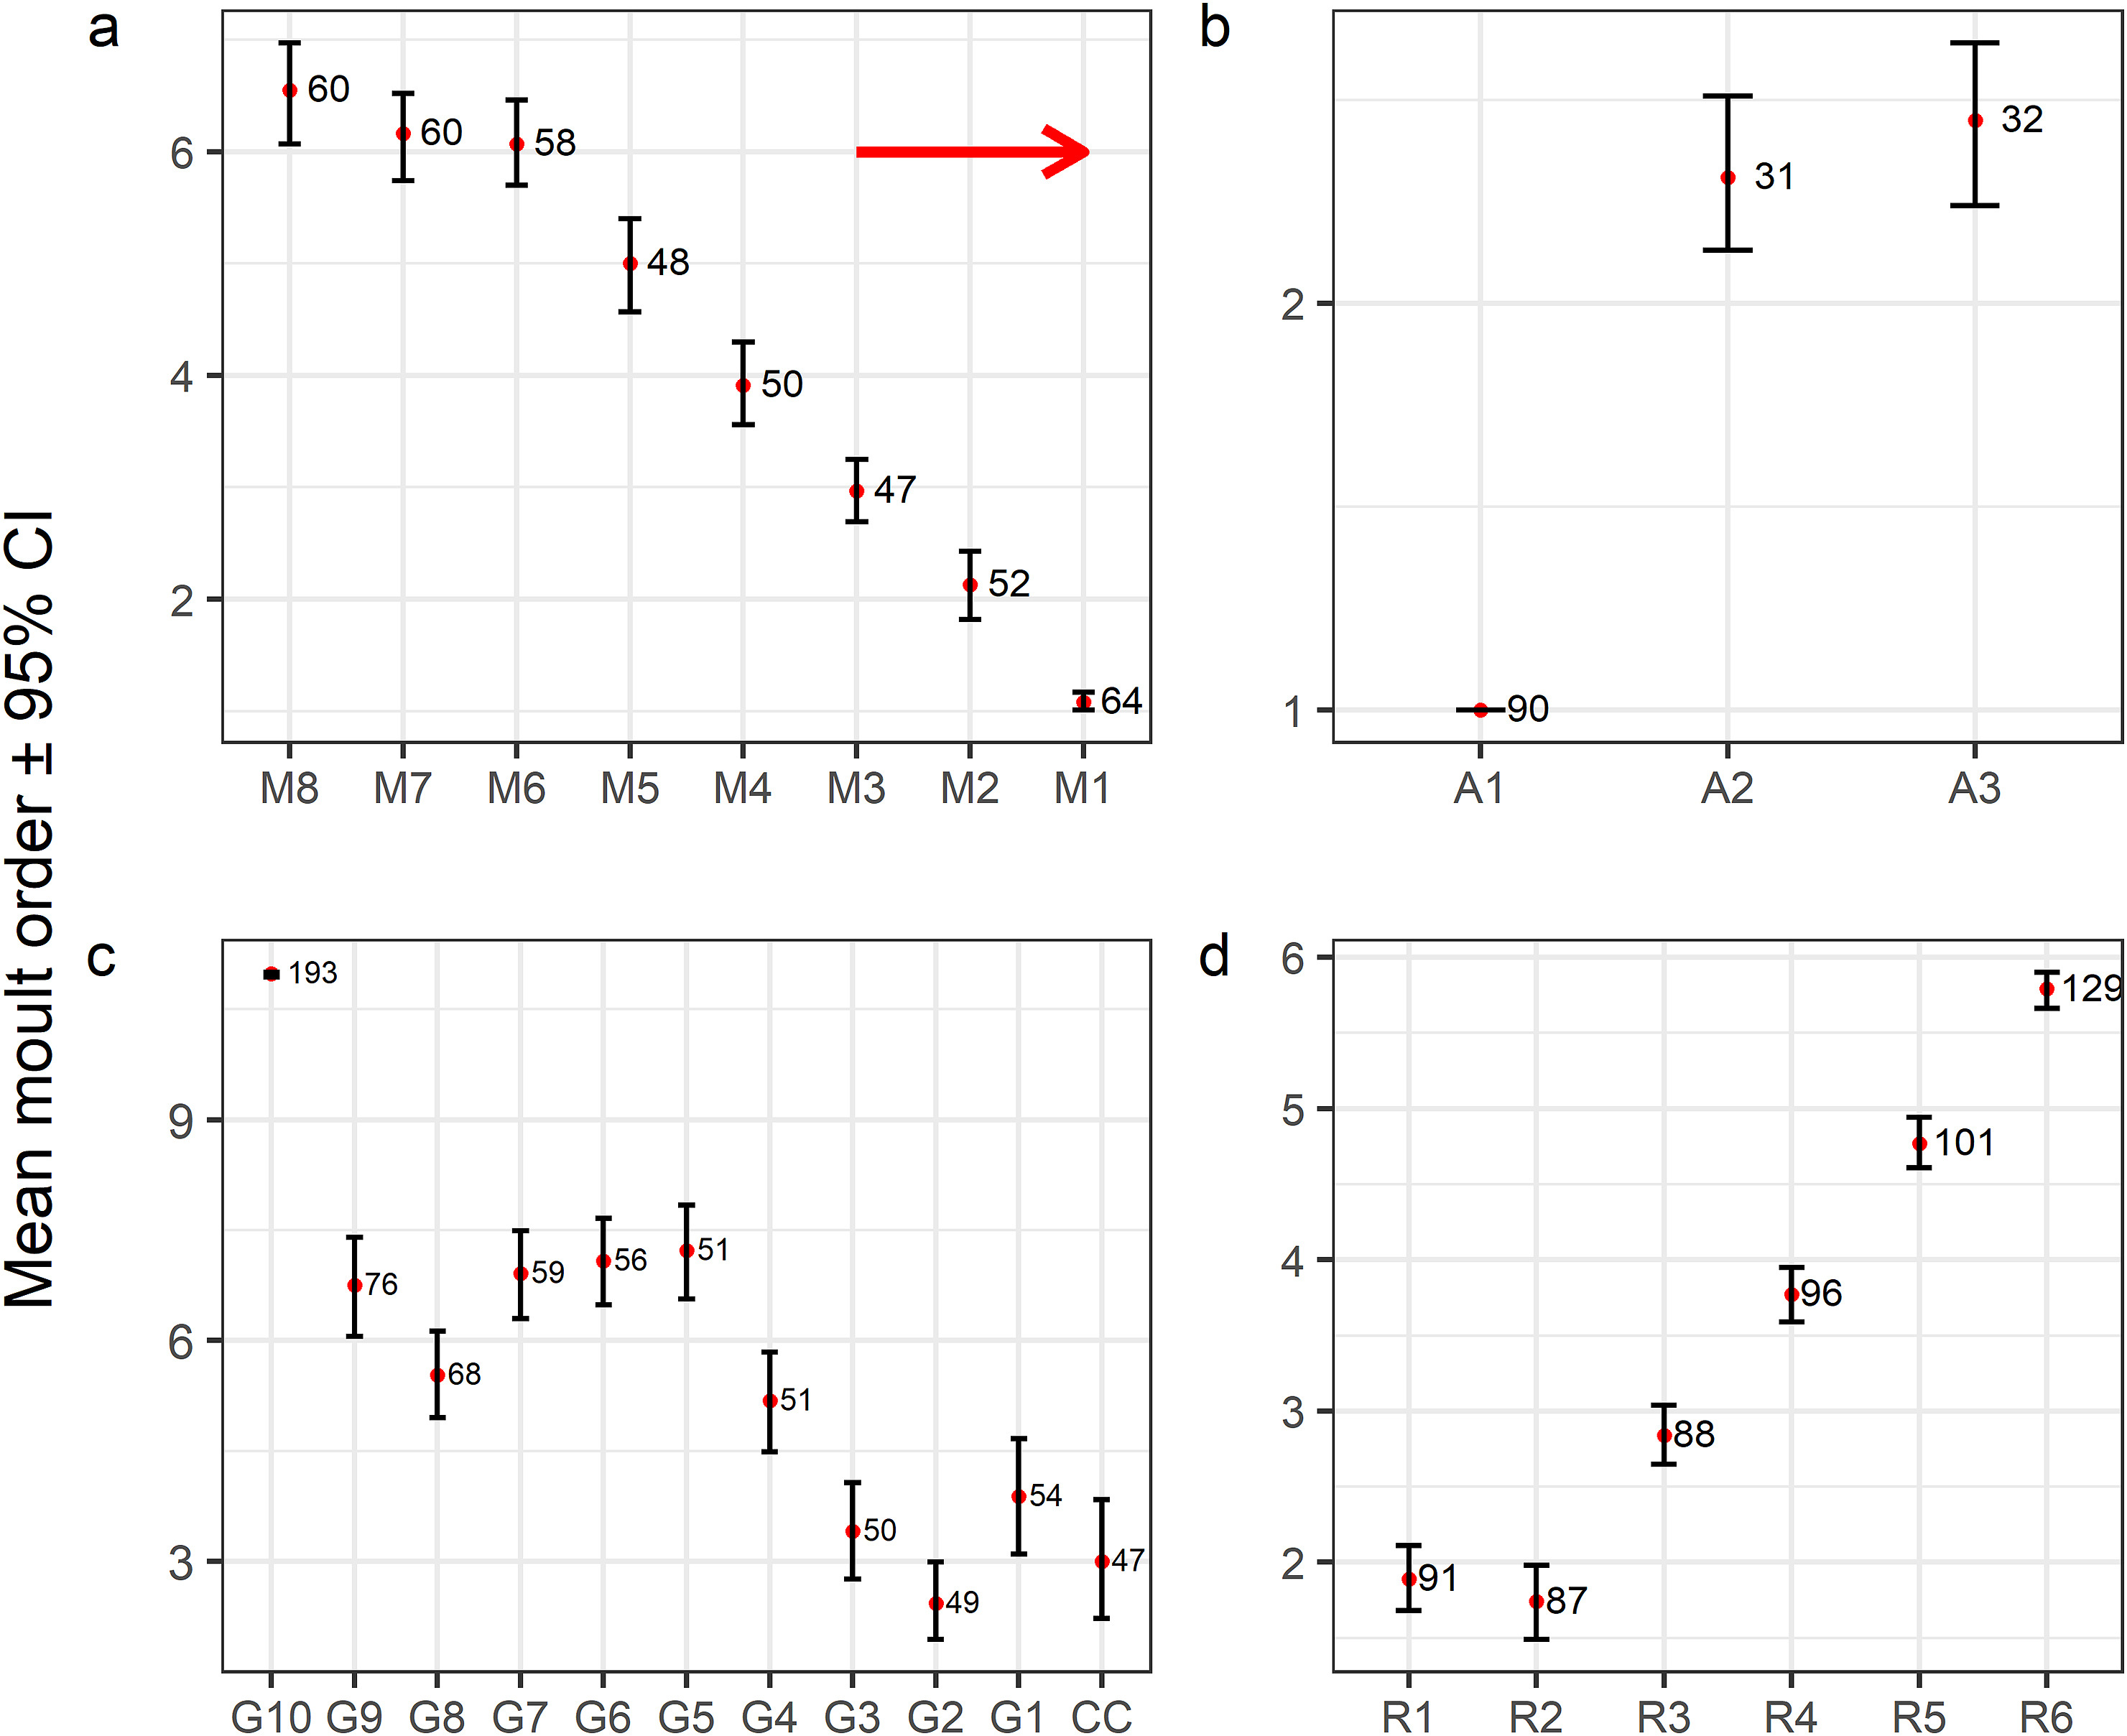
Within-tract moult-sequence matched literature descriptions for the remex and primary-covert tracts (e.g., Newton, 1966; Zeidler, 1966; Appendix Fig. S1). Within-tract moult-sequence was highly fixed in primaries and primary coverts (outward) and secondaries (inward), although P1 and S6 showed larger variation than the other primaries and secondaries, respectively, due to four cases of divergent moult within primaries (P1 was not the first primary to be shed) and two within secondaries (S6 was not the last secondary to be shed). The remaining feather tracts showed a greater amount of within-tract moult-sequence variation (highest in greater and median coverts). Median coverts tended to be moulted inwardly, usually finishing by the three inner ones in lax order (Fig. 2A). This average sequence tracked the replacement of the marginal coverts' trailing row (not shown; Guallar et al., 2021) which was present in only 43% cases (n = 63). Greater coverts tended to be moulted in four steps: the outermost three ones were shed almost in block (usually along with the carpal covert), followed by GC4 and GC8, then GC5 to GC7 plus GC9, with the innermost GC10 usually growing once the rest of the tract was fully grown (Fig. 2B). However, this average pattern was only present in 54% cases (n = 70). The inner alula feather was largely shed long before the other two alula feathers, which tended to be shed synchronously towards the end of the moult progress (Fig. 2C). Rectrices were moulted outwardly, although the shortest rectrix, R2, was generally shed briefly before the central one (Fig. 2D; Guallar and Quesada, 2023).
Figure
2.
Moult sequence within four feather tracts of the House Sparrow: median coverts (M), alula feathers (A), greater coverts (G), and rectrices (R). Red dots show mean order of moult activation (i.e., mean moult order) averaged across all the individuals with data available for each given feather. Sample sizes shown on the right of each segment. Wider confidence intervals indicate greater variation within the tract's sequence. Moult sequence of remaining feather tracts have been widely documented (Appendix Fig. S1).
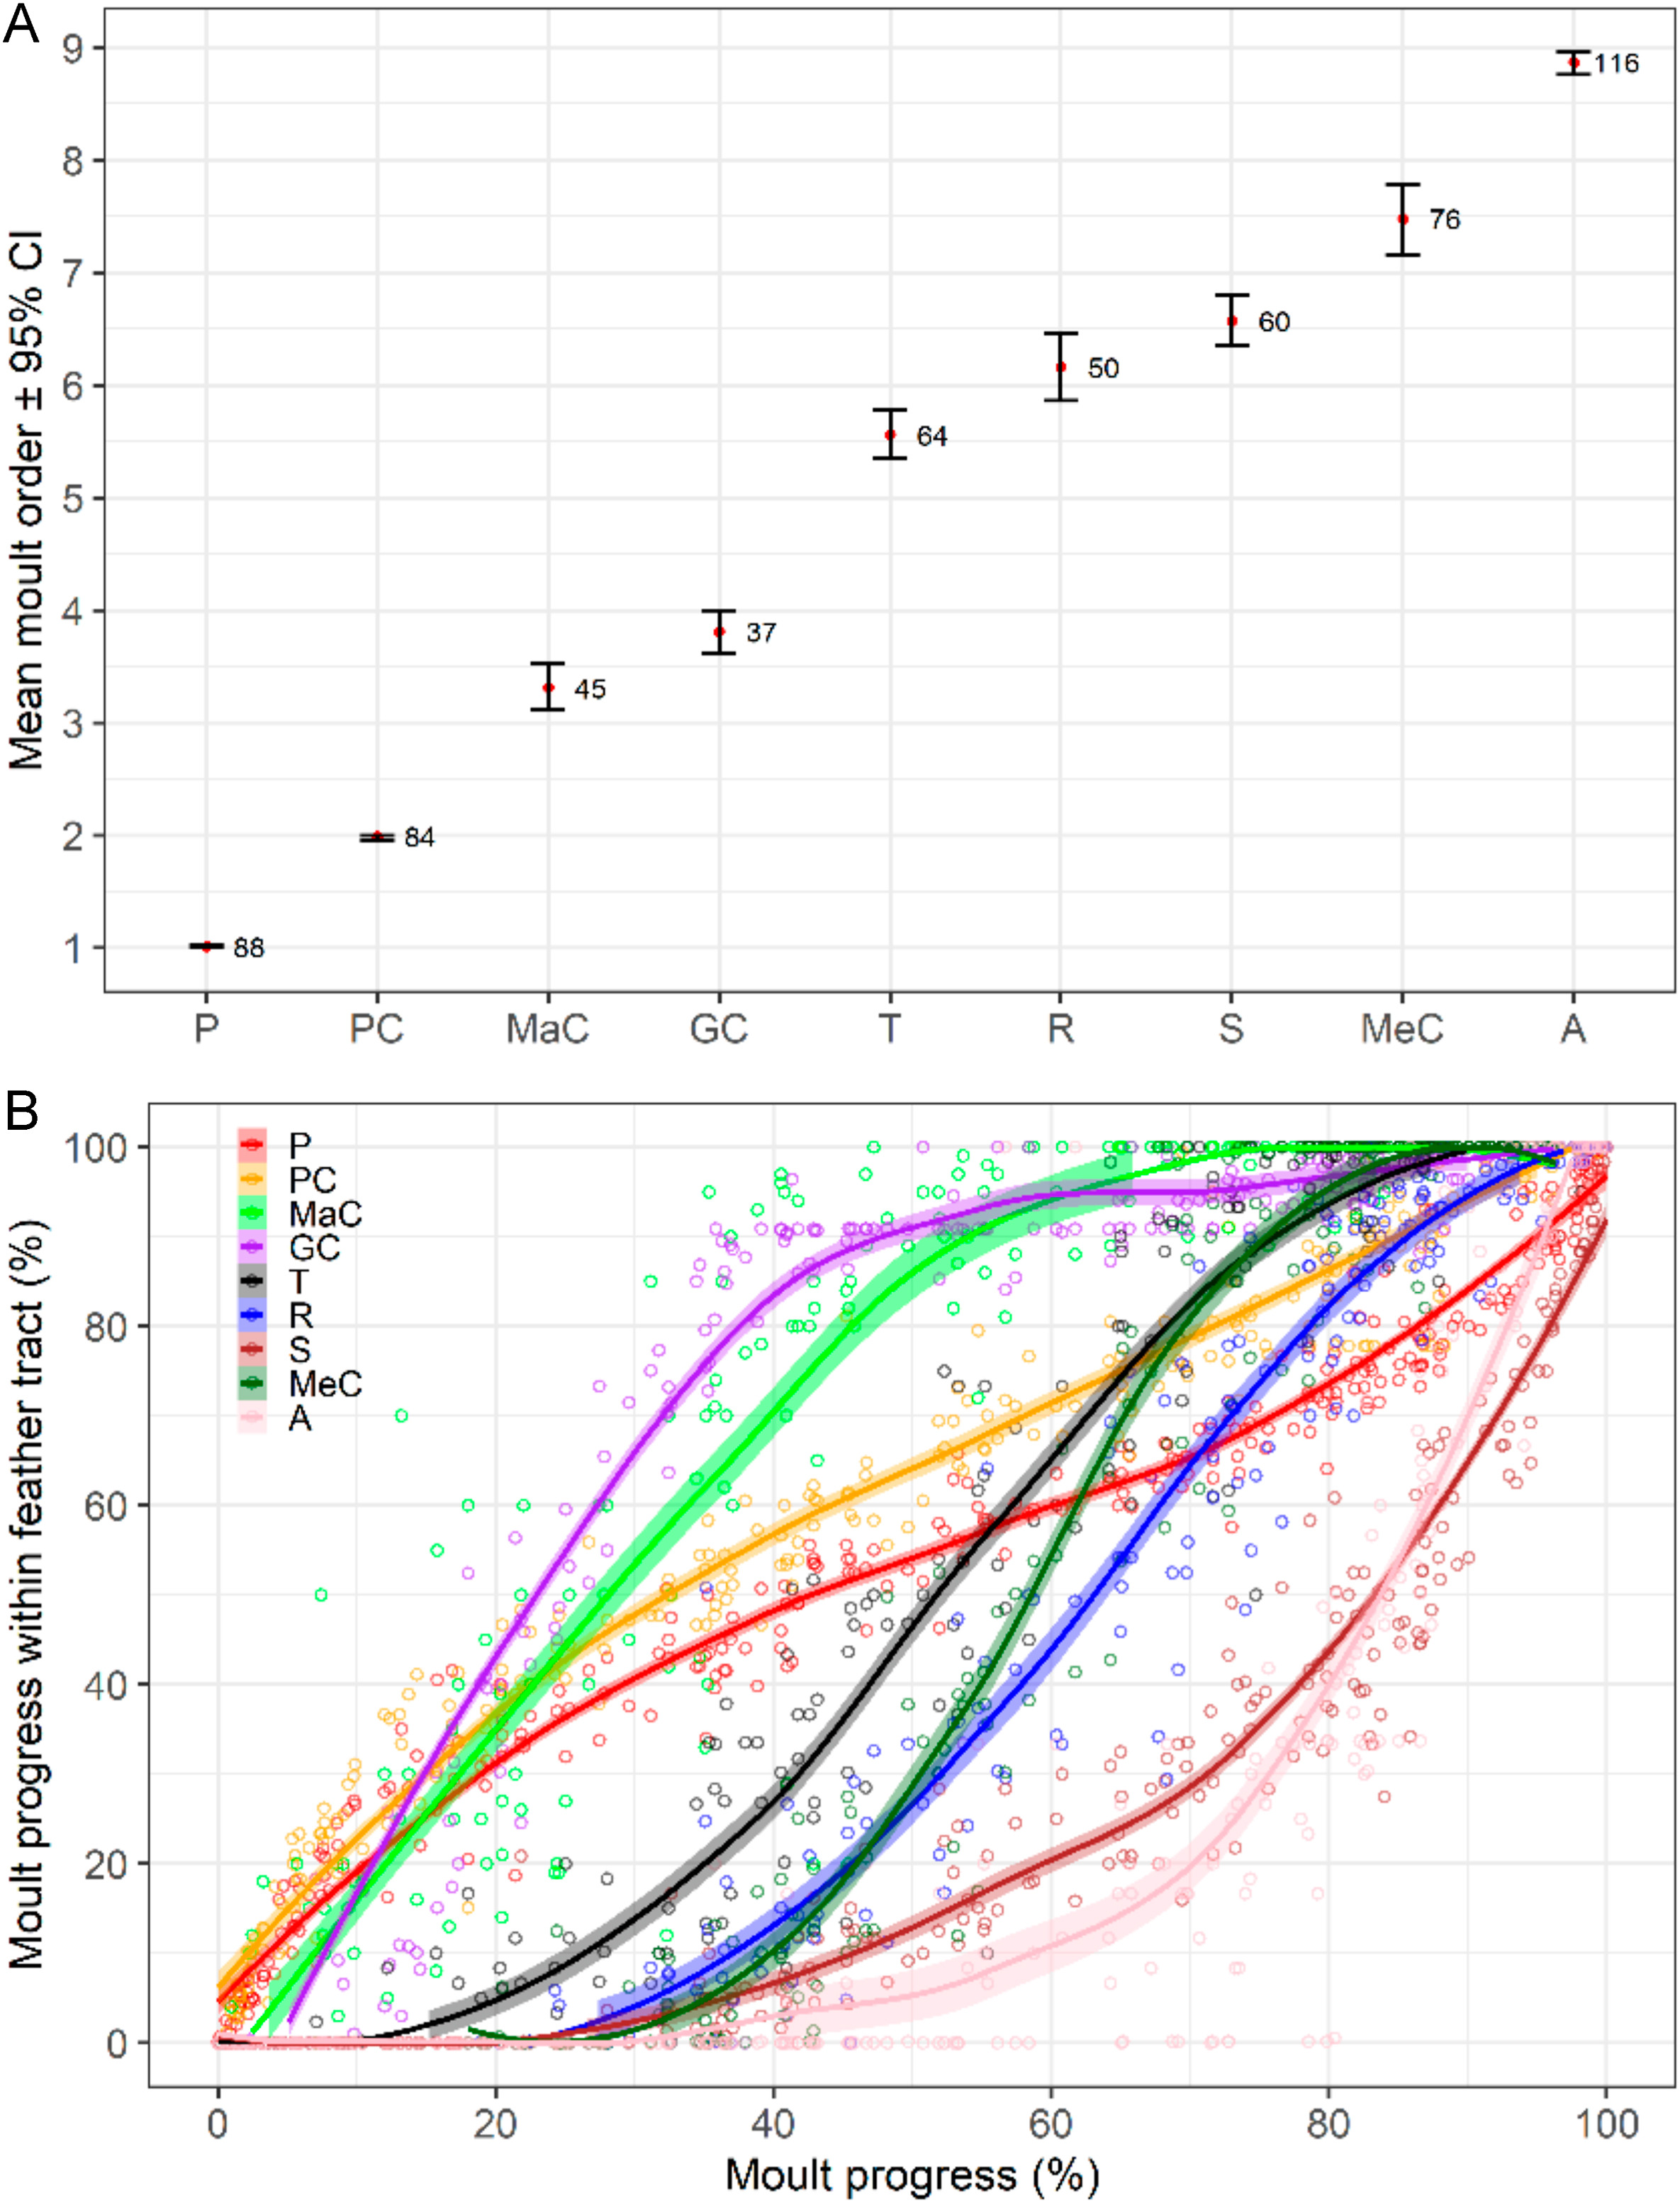
Moult sequence among feather tracts clearly started by the inner primaries and primary coverts, although from then on it was characterised by variation in the order of feather-tract activation (especially for the rectrices and median coverts; Fig. 3). On average, primaries and primary coverts were closely followed by some body feathers (scapulars, dorsal, ventral, and underwing coverts in no clear order). Within the wing, and shortly after the onset, moult sequence proceeded by marginal and greater coverts, then tertials, rectrices, and secondaries, although the latter three overlapped widely. Median coverts were usually penultimate, while activation of the alula was most frequently the last (Fig. 3A). Among body tracts, the head was consistently the last to be activated (Fig. 4A). The rate of moult progress varied within wing- and tail-feather tracts (shown as deviations from linearity), ranging from the smooth curves described by primaries and tertials to the abrupt change of slope of the greater coverts and alula, caused by one large break within these two feather tracts associated with shedding lag (see below; Fig. 3B). Also, the rate of moult progress varied among wing- and tail-feather tracts, from the slow rate of the primaries and primary coverts to the fast rate of the greater and median coverts (Fig. 3B).
Figure
3.
Moult sequence among nine feather tracts in the House Sparrow. Red dots show mean order of moult activation (i.e., mean moult order) averaged across all the individuals with data available for each given feather. (A) Reconstruction based on the average order of activation for every tract (obtained from the observed first feather shed; n = 293). Sample sizes shown on the right of each segment. Wider confidence intervals indicate greater variation among tract sequence. (B) Reconstruction based on the interval of the moult progress during which each feather tract grows (n = 2630 complete feather tracts) obtained from local polynomial regression. Slope shifts within-feather tracts associate with variation in shedding lags across their feathers (Guallar and Quesada, 2023).
Figure
4.
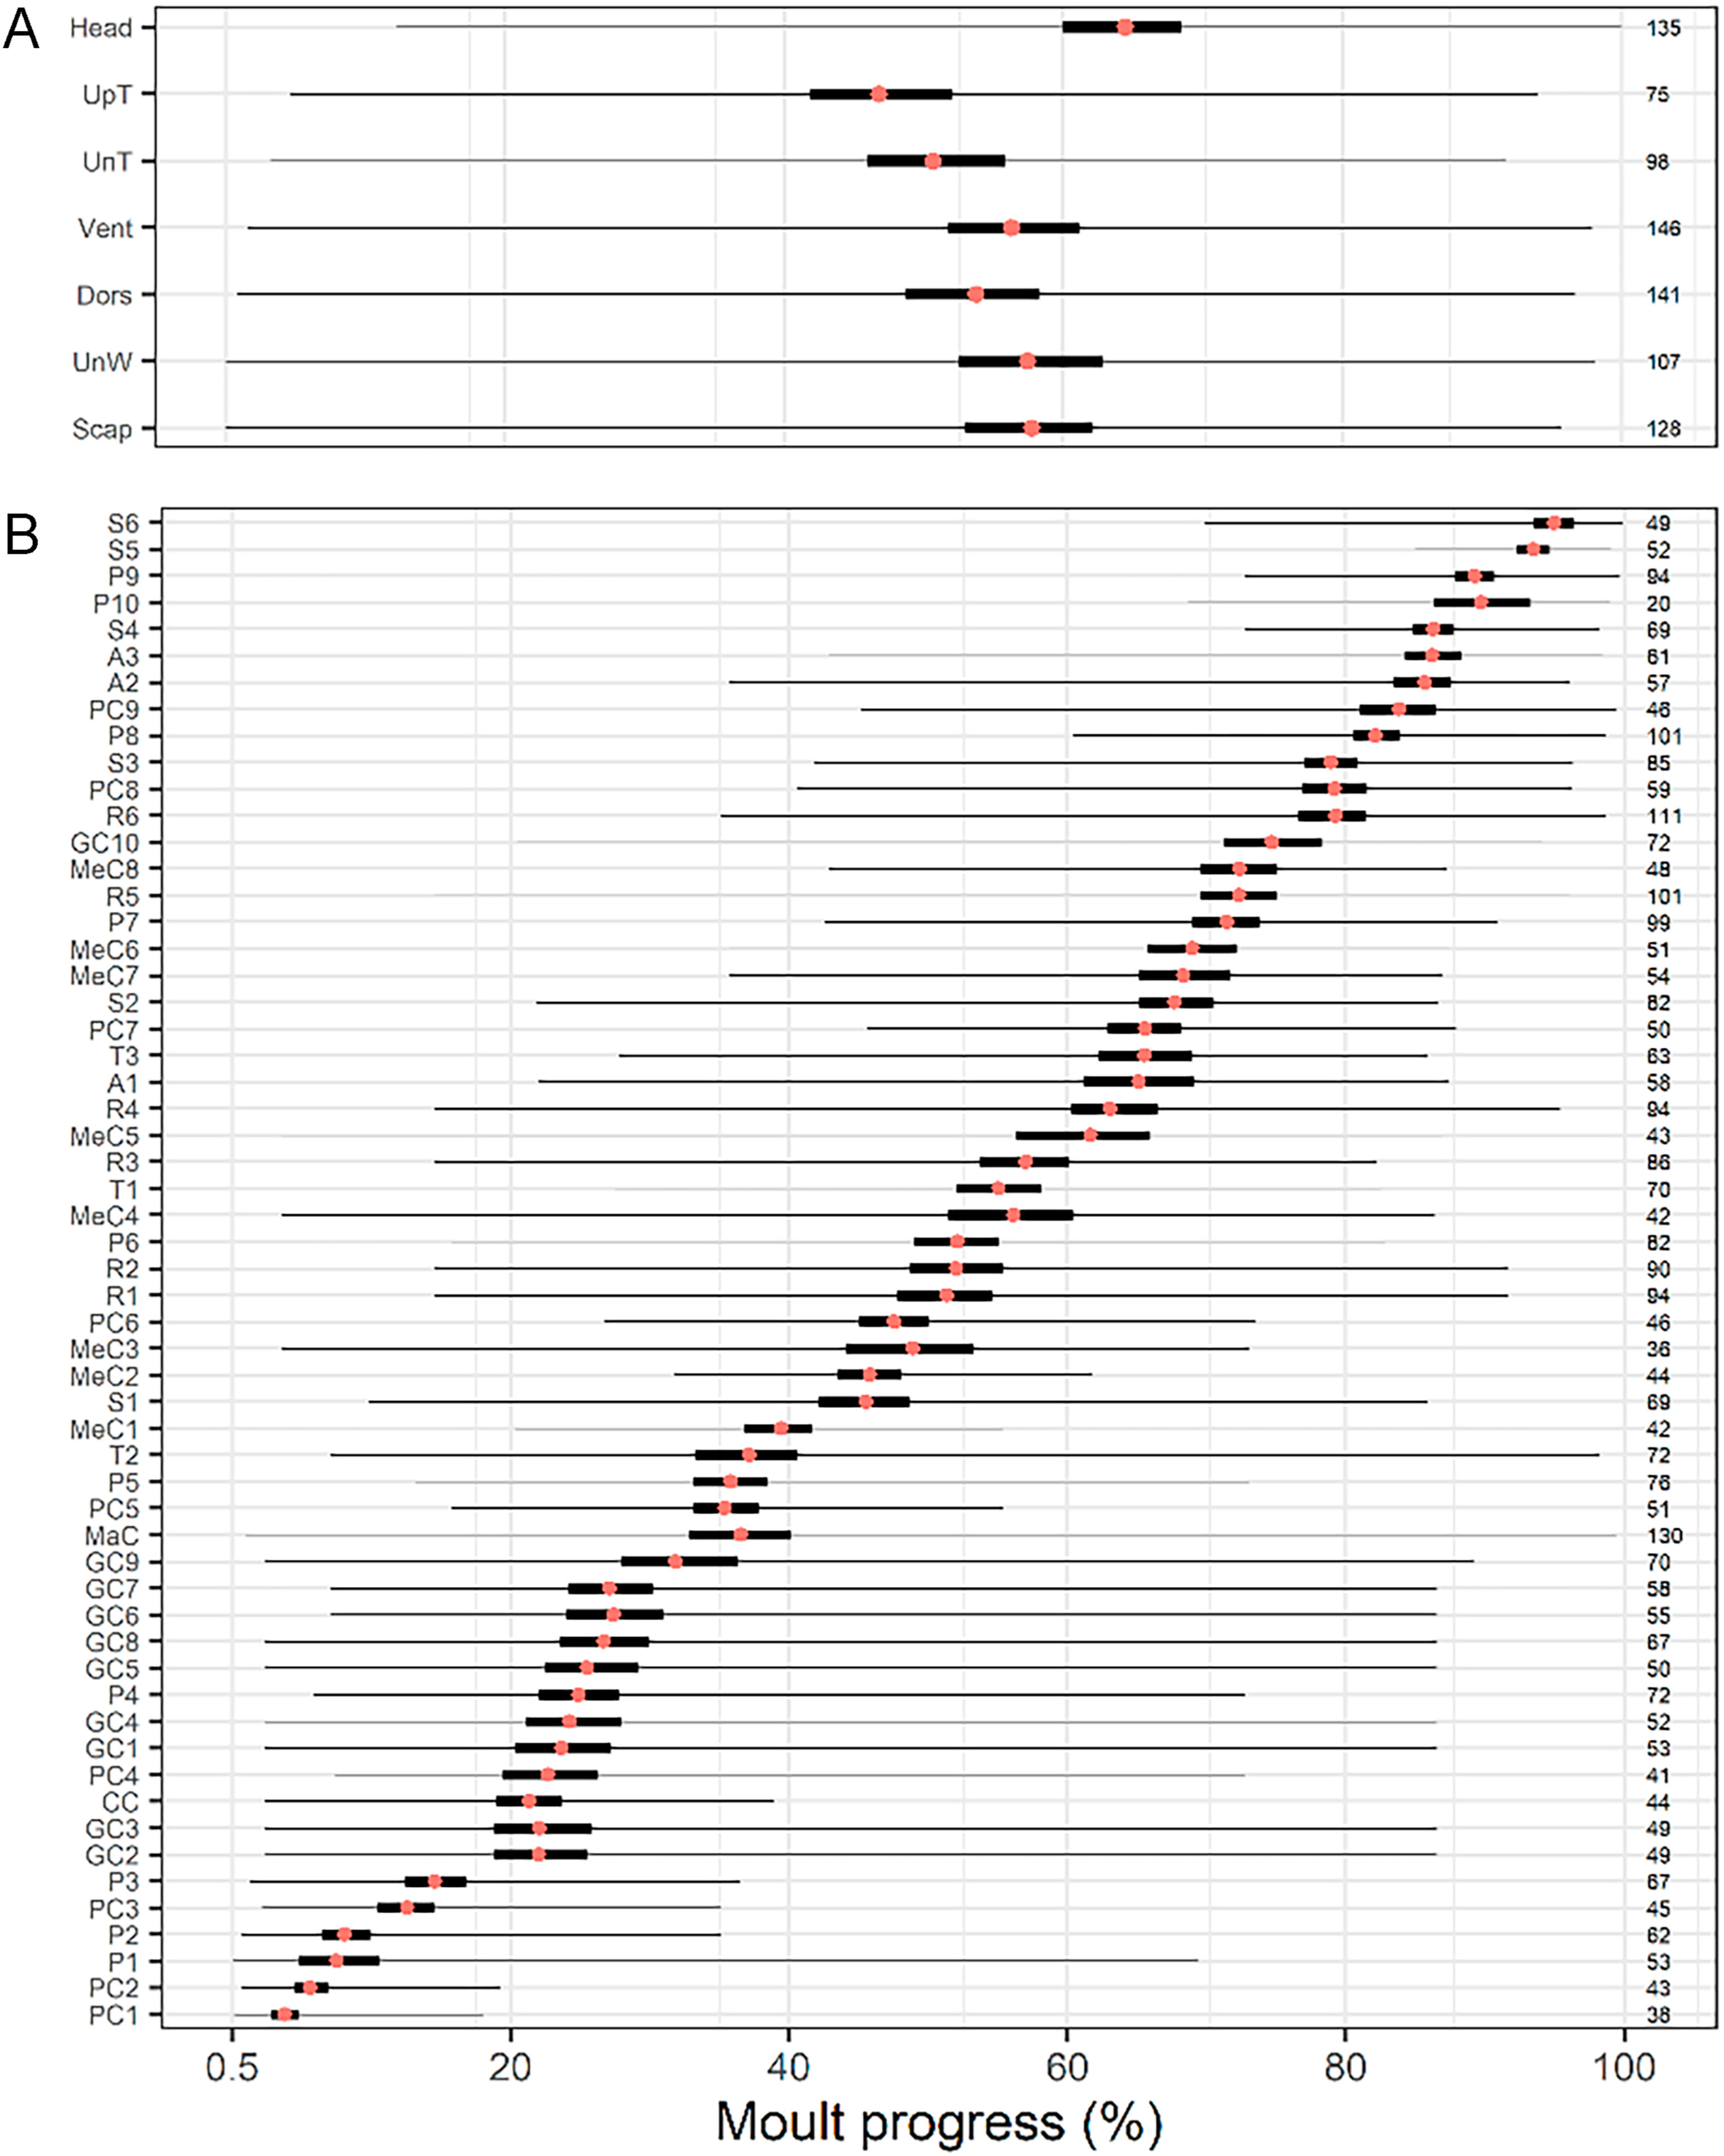
Moult sequence reconstruction. Mean (red point), 95% confidence interval (thick bar), and range (line) of the moult progress during which (A) body tracts or (B) individual flight feathers of the House Sparrow are actively growing. Sample sizes shown on the right column. Order based on low confidence-interval values (flight feathers) or minimum values (body tracts). Y-label colours match that of Fig. 3B (flight feathers) and Fig. 7B (body tracts). This reconstruction is imprecise because longer feathers and larger body tracts (which have longer growth periods) and greater variation in shed order (e.g., tertials and alula feathers; Figs. 2 and 3; Appendix Fig. S1) cause the mean to slide towards the right. For example, PC1 appears first in the featherwise sequence although we only found one case in which PC1 was shed before P1. This occurs because P1 is nearly three times longer than PC1 and finishes growth much later, thus its mean slides towards the right (Guallar and Quesada, 2023).
Large variation also characterised featherwise moult-sequence: we did not find two birds with identical featherwise-moult sequence after the first stages of the moult progress (Guallar and Quesada, 2023). Variation was huge among body tracts, ranging from 88% span of head up to 98% span of the under-wing coverts (Fig. 4A). Among wing- and tail-feather tracts, was smallest for feathers usually shed at the onset and end of moult progress. It ranged from the 14–19% span of secondary S5 and the innermost two primary coverts, up to the 84–99% span of the greater and marginal coverts (average span = 59%; Fig. 4B).
3.2
Moult intensity
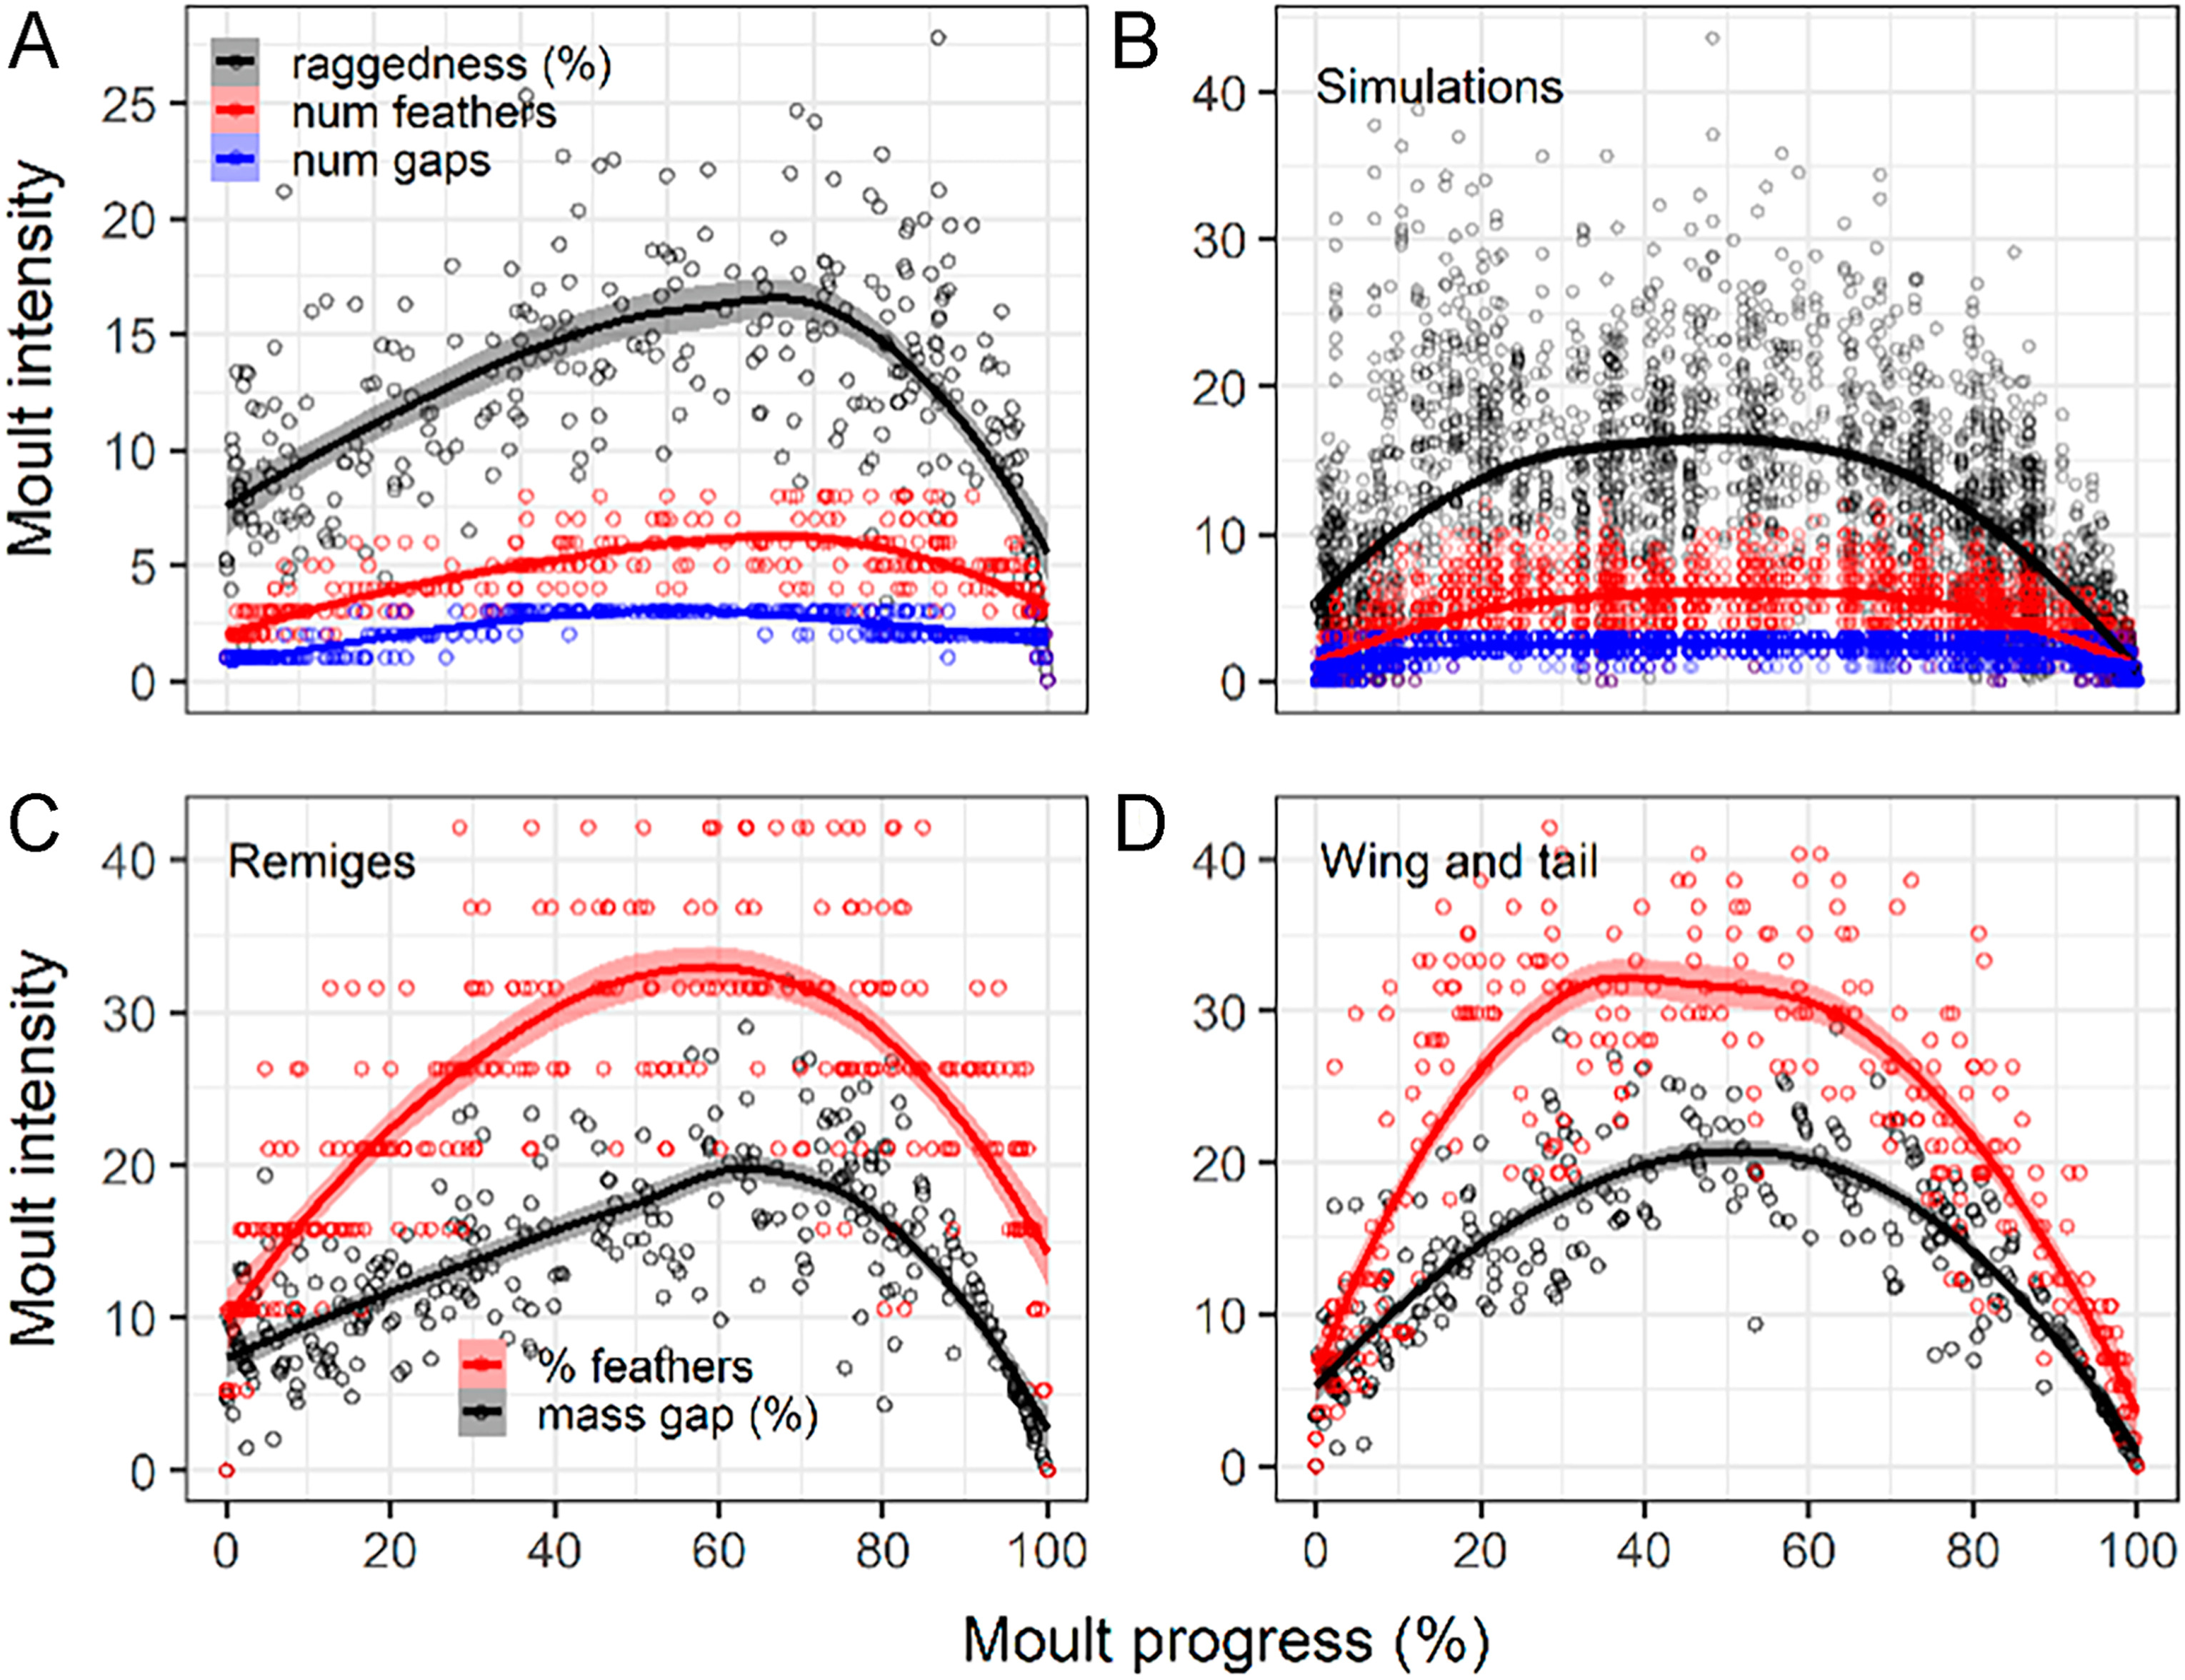
Empirical raggedness, mass gap, and quantity of growing remiges peaked at about 70% of the moult progress (Fig. 5A and C). However, when sequence was randomly shuffled moult intensity distribution became flat (Fig. 5B). On the other hand, number of remex wing-gaps, and mass gap of other wing-feather tracts and of rectrices peaked at central values of moult progress (Fig. 5A; Appendix Fig. S2). Mass gap of all wing- and tail-feather tracts combined approximately described a parabola, whereas percentage of wing and tail feathers plateaued for central values of moult progress suggesting a trade-off between quantity of growing feathers and overall deposition of feather material (Fig. 5D). However, contribution of each feather tract to moult intensity varied. For example, peak mass-gap of the rectrices was 2.51 times larger than that of the remiges and 1.75 times larger than that of the remaining wing-feather tracts (Figs. 5C and 6A; Appendix Fig. S2).
Figure
5.
Wing-moult intensity dynamics in the House Sparrow obtained from local polynomial regression (percentages refer to the feather tracts involved in each case). We evaluated the effect of moult sequence on the aerodynamics using remex raggedness, number of remiges, and number of wing gaps as surrogates. (A) Empirical raggedness (n = 293 birds), (B) simulations of raggedness from random shuffling of moult sequence (n = 2930 simulations). We used mass gap as an analogue of raggedness for other wing-feather tracts because of its similar behaviour, (C) shown by comparison of both indexes for remiges. (D) Overall mass gap is driven by the much heavier remiges (lower right).
Figure
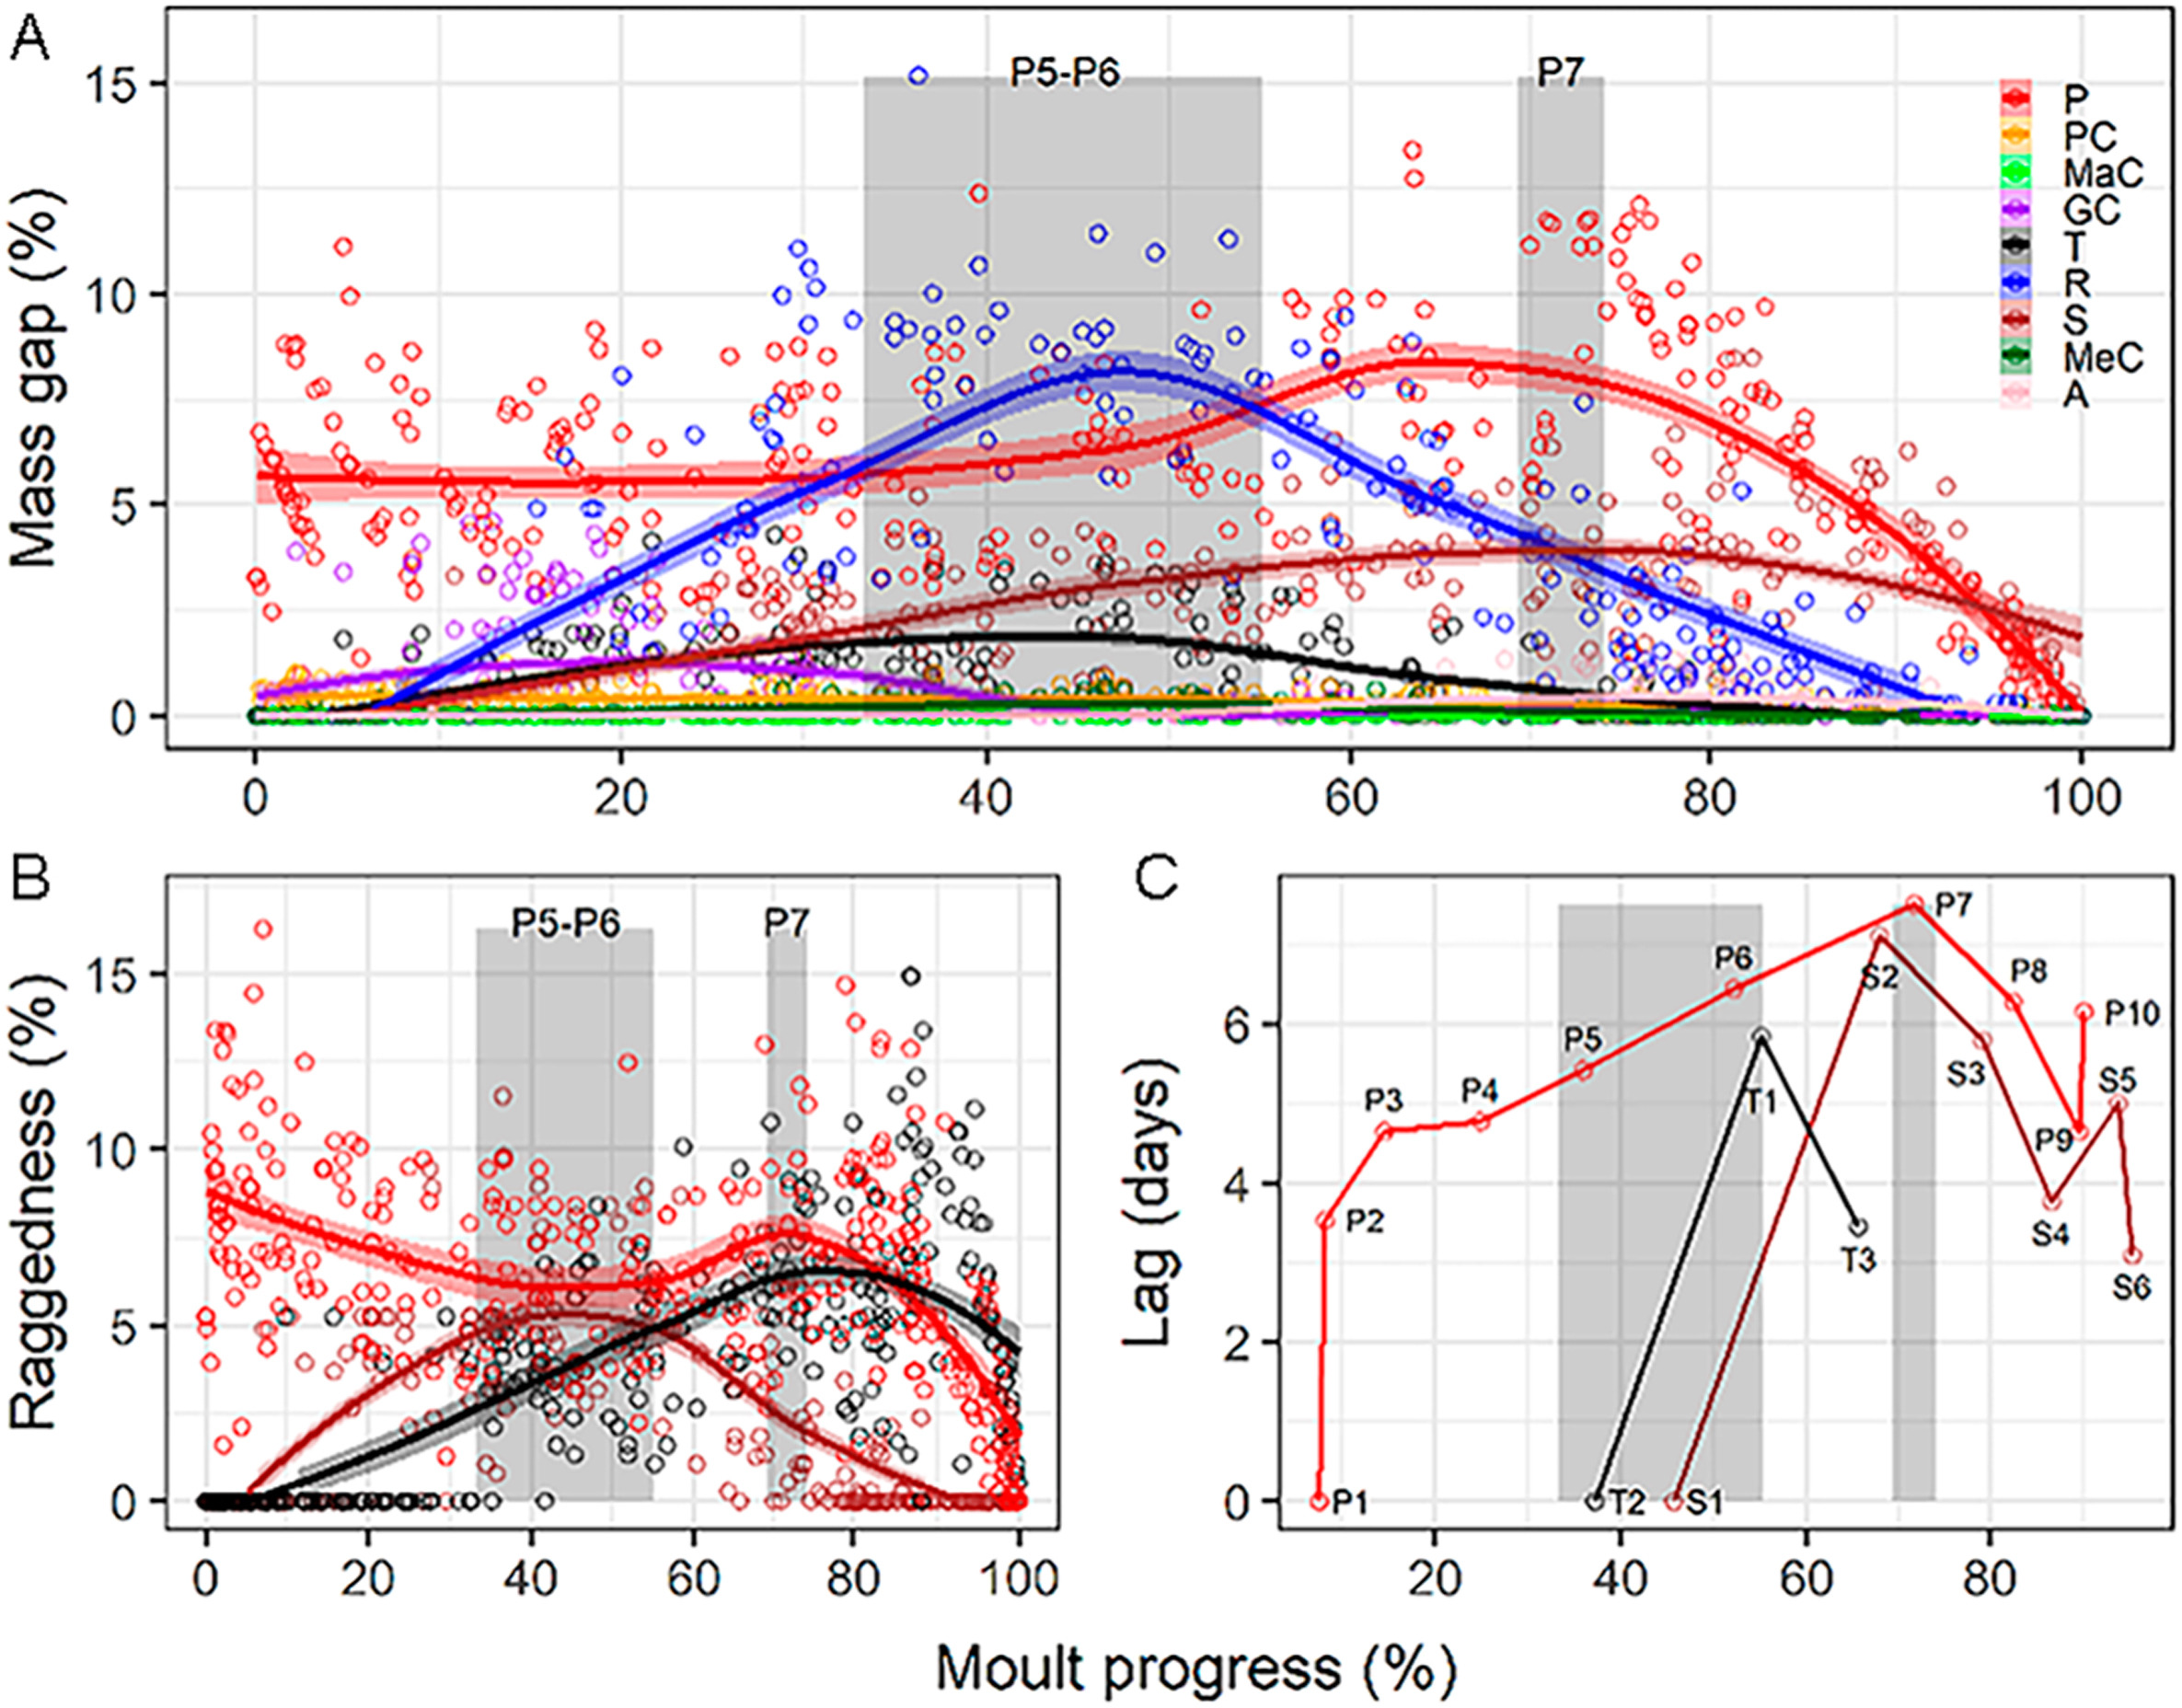
6.
Moult intensity dynamics in the wing tracts of the House Sparrow obtained from local polynomial regression (percentage refers to the accumulated value of all wing-feather tracts). (A) Mass gap of nine wing-feather tracts. (B) Raggedness of remex tracts. Raggedness of primaries is always larger than that of secondaries and tertials, save after P8 has grown. (C) Mean ± 95% bootstrapped confidence-intervals of shedding lag within primaries, secondaries, and tertials. P1, S1, and T2 taken as nodal feathers within primaries, secondaries, and tertials, respectively (Appendix Fig. S1). Grey columns show growth period of primaries PP5–6 and P7, the latter forms the wing tip.
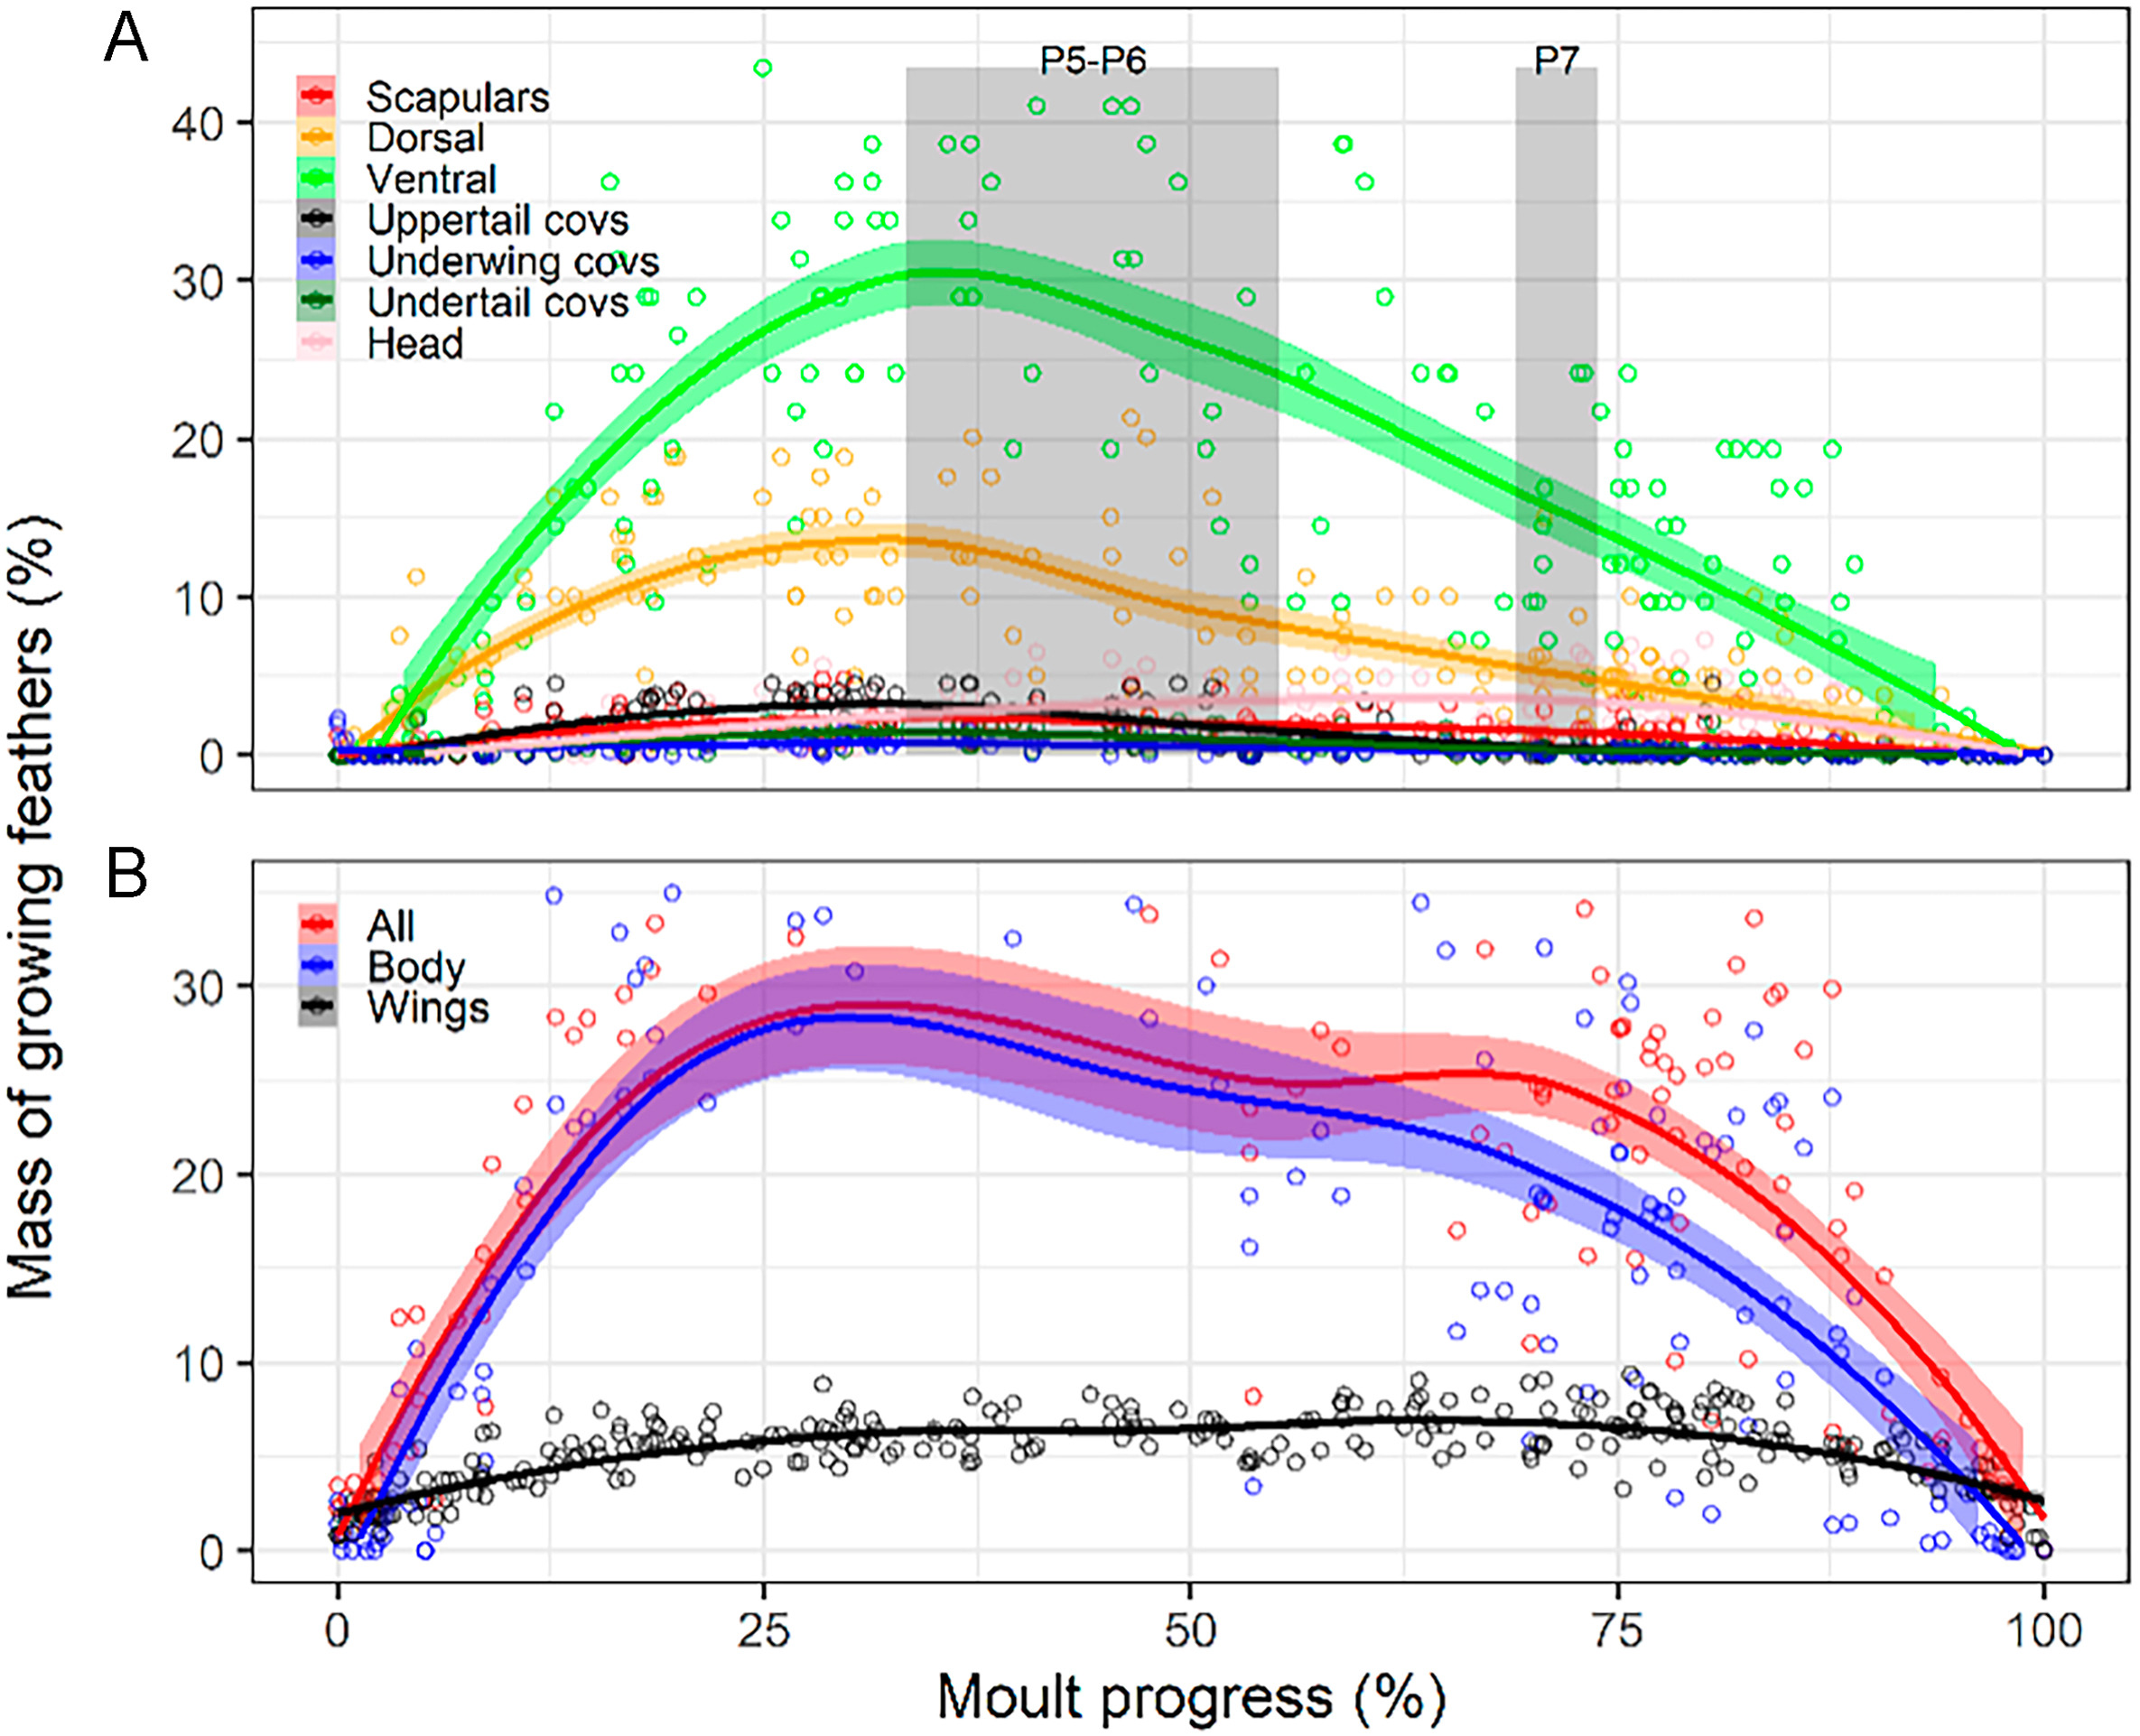
Break-down of remex raggedness revealed a succession of peaks among feather tracts (Fig. 6A). Primaries showed two peaks, an absolute maximum at the very onset of moult (inner primaries) and then for P7, the primary that most frequently forms the wing tip (Cramp and Perrins, 1994; Fig. 6B). Tertials peaked at mid moult progress coinciding with a local minimum of primary raggedness associated with the growth of the central primaries. Secondaries peaked last, at 75–90% of moult progress (Fig. 6B). Primaries showed increasing shedding lags up to primary P7, while there were large shedding lags between secondaries S1 and S2 and between the central and the inner tertials (Fig. 6C). Contrastingly, the heavier body tracts peaked during the first half of the moult progress, before the primaries that form the wing tip began to grow in (Fig. 7A).
Figure
7.
Moult intensity dynamics in the House Sparrow obtained from local polynomial regression (percentages refer to the plumage region involved in each case; n = 176). (A) Mass of plumage growing of seven body-feather tracts. Grey columns show growth period of primaries PP5–6 and P7, the latter forms the wing tip. (B) Mass of body plumage growing versus that of wing and tail feathers.
We found partial support for the protection function associated with moult sequence among wing feather-tracts: pairs of feathers of tracts adjacent along the longitudinal axis did not grow simultaneously on average (Fig. 3B). However, data scrutiny showed some degree of simultaneous growth in many individuals. On one hand, secondaries tended to deviate from 0% simultaneous growth with greater coverts, and were only marginally non-significant (Table 1). On the other hand, greater coverts deviated significantly from both 0% and 50% simultaneous growth with median coverts (8 of 184 individuals showed simultaneous median and greater covert growth; Table 1). Our simulations of random moult sequences from empirical raggedness evidenced that this is mediated via moult sequence.
Table
1.
Summary of the tests of the protection hypotheses between feathers of longitudinally adjacent tracts on the wing of the House Sparrow.
χ21
p
n
GC10 versus T (nil)
0
1
81
GC10 versus T (random)
5.23
0.022
81
GC 2–7 versus S (nil)
3.16
0.076
263
GC 2–7 versus S (random)
94.69
< 0.001
263
MeC versus GC 1–9 (nil)
5.96
0.015
184
MeC versus GC 1–9 (random)
55.61
< 0.001
184
In parenthesis type of hypothesis tested: deviation from nil simultaneous growth and from random occurrence of simultaneous growth. We only found one individual with T1 and T2 growing as pins simultaneously. This same individual also had shed GC10, which suggests a moulting error.
We found a close relationship between wing shape and moult intensity: peak of remex raggedness, remex mass-gap, and primary raggedness associated with the primaries forming the wing tip, and decreased afterwards (Figs. 5 and 6). These results are consistent with predictions from theoretical and experimental studies (Hedenström and Sunada, 1999; Williams and Swaddle, 2003), thus supporting the aerodynamic-constraint hypothesis. However, results for primary-shedding lags were opposite to our predictions.
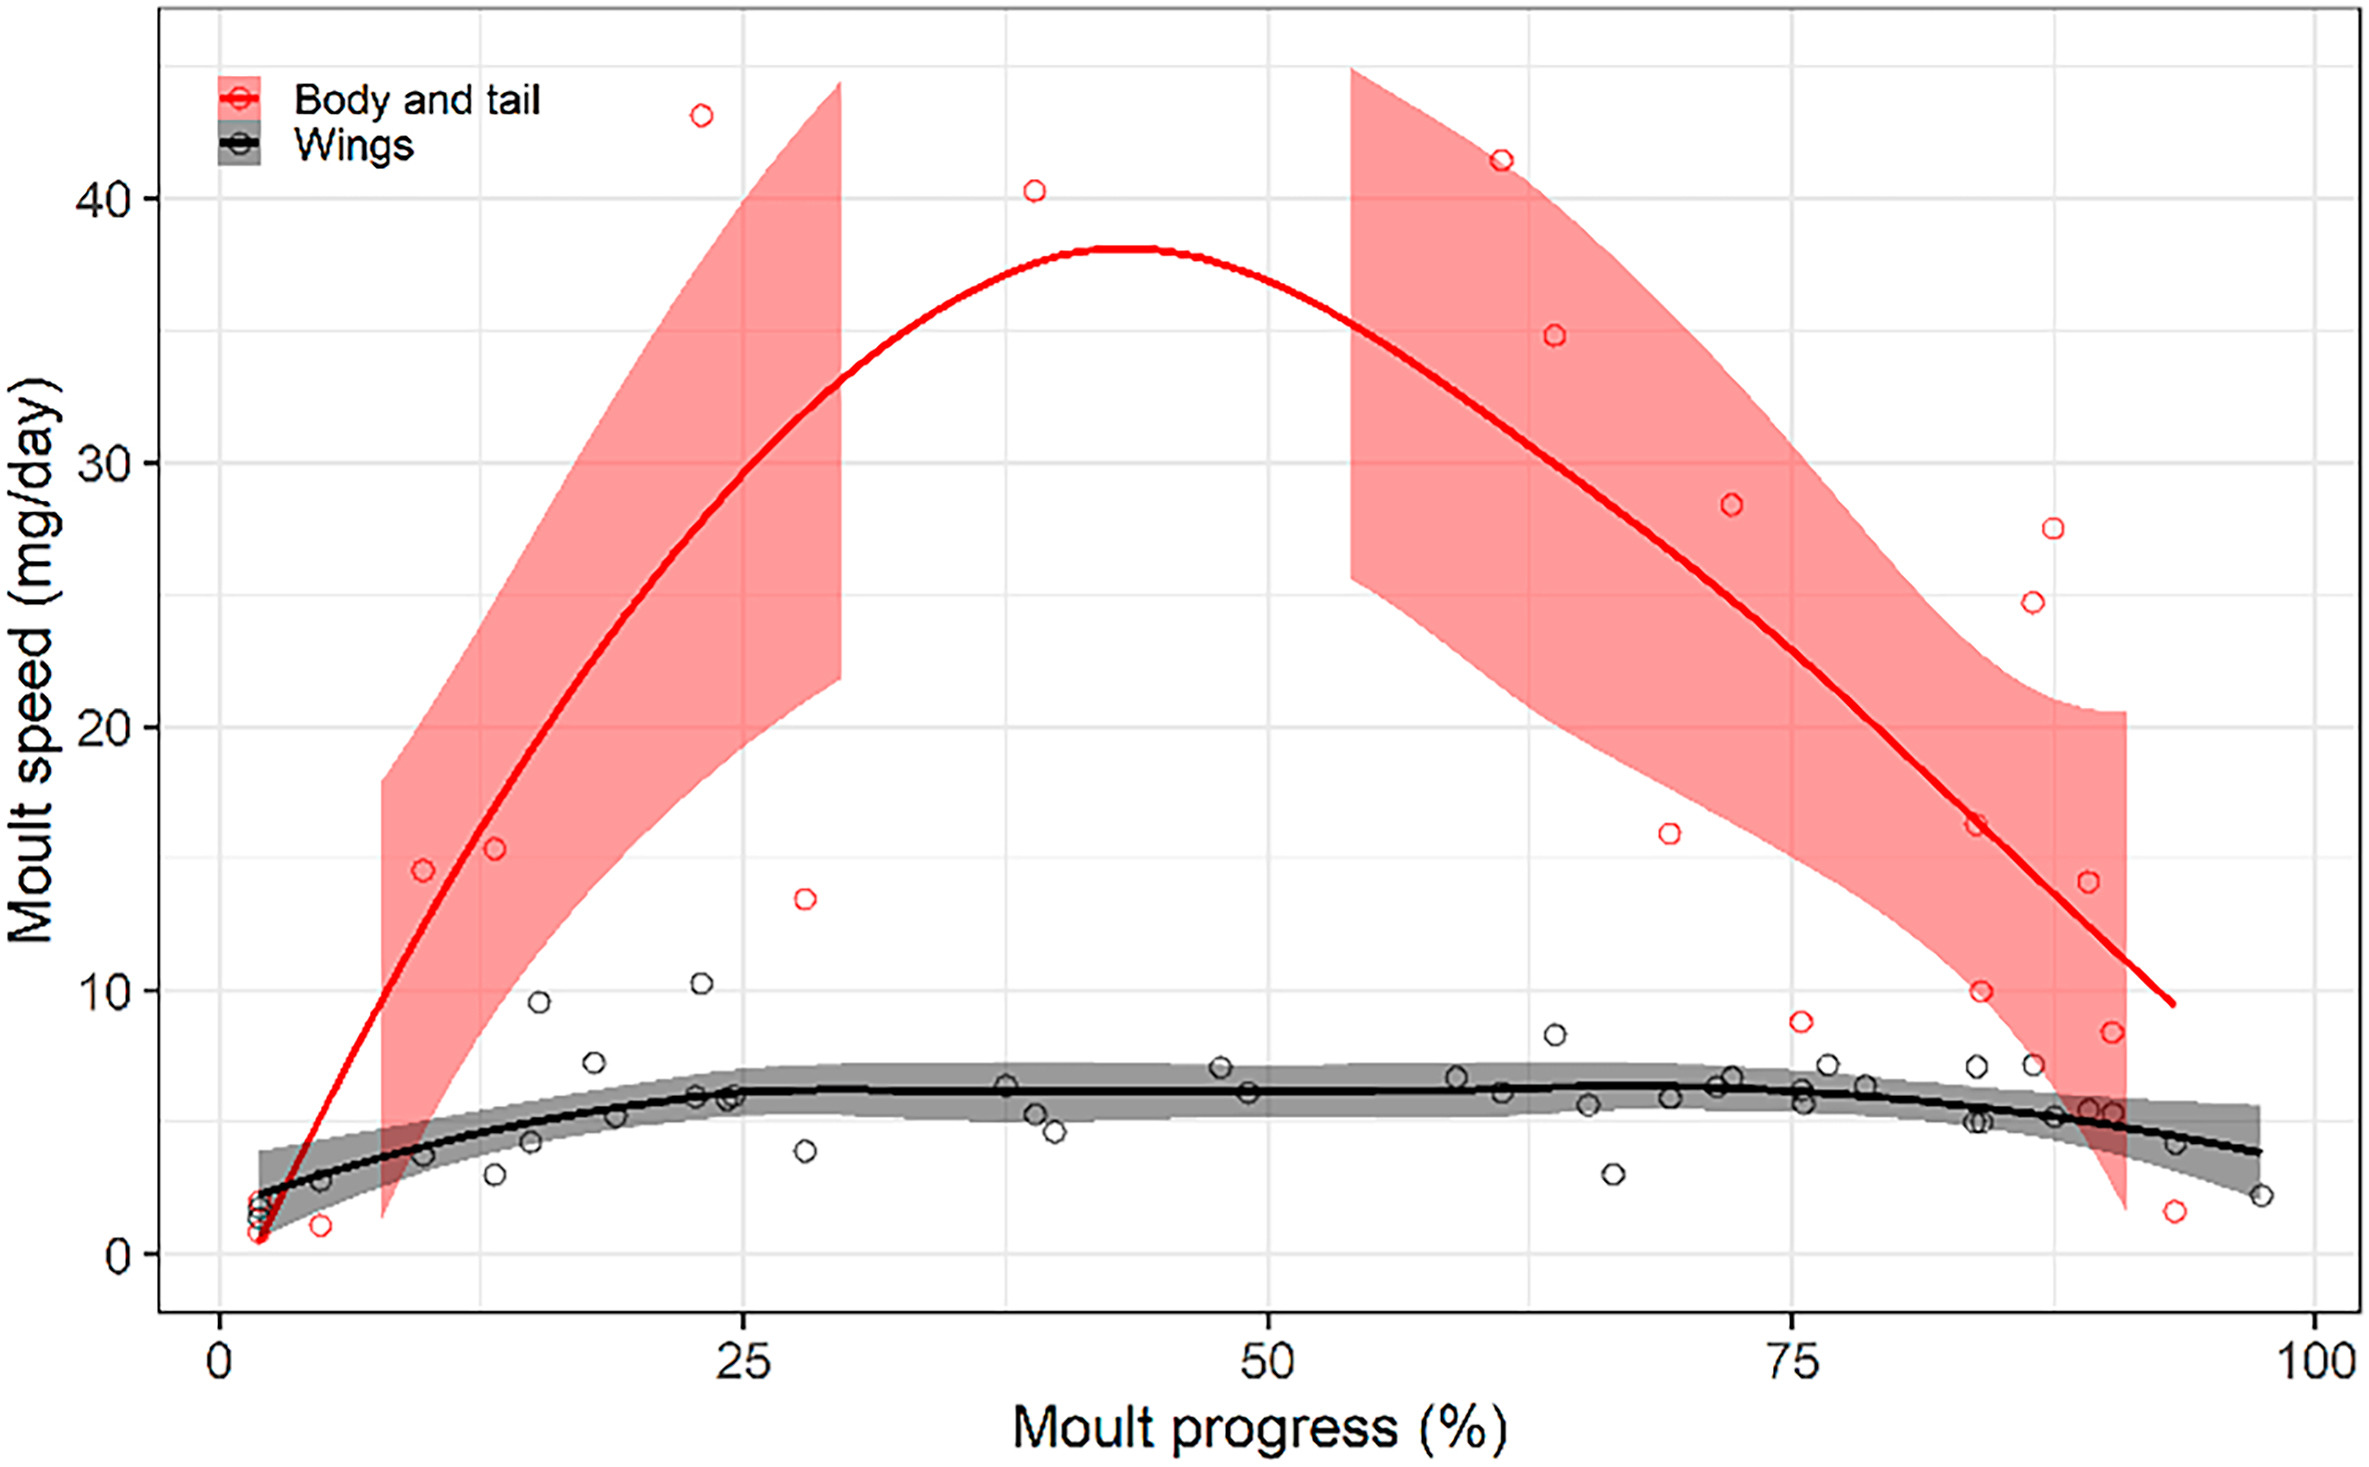
Finally, the physiological-constraint hypothesis received an ambivalent support, with moult intensity on wings behaving as predicted and body feathers deviating from the prediction. Thus, while percentage of wing and tail feathers, mass of growing wing feathers, and moult speed of wing feathers plateaued for central values of moult progress (32%, 6.53%, and 6.4 mg/day, respectively), the mass gap of wing and tail feather tracts combined, the total mass of growing plumage, and moult speed of body feathers did not reach a plateau (Figs. 5D, 7B and 8).
Figure
8.
Moult speed in the House Sparrow, calculated as the average mass gain during the elapsed time between capture and recapture. Local polynomial regression on moult progress calculated as the mean moult progress between consecutive captures (95% confidence intervals depicted by shaded ribbons). Moult speed of wings and rectrices have been calculated from one wing and tail side, respectively, and multiplying by 2, i.e., assuming symmetry (n = 41 and 22 within-year recaptures from 30 to 17 individuals, respectively). Gap of confidence intervals for body and tail due to data paucity for mid stages of moult progress.
Far from being a stereotyped process, the complete moult of passerines shows remarkable complexity and plasticity in sequence and intensity, with substantial variation within- and among-feather tracts (Michener and Michener, 1940). Causes of this variability are beyond the scope of this study. However, neither age nor sex seem to explain it (Appendix Fig. S3). While the concrete moult sequence within some feather tracts (e.g., median coverts; Fig. 2A and B) may not have an adaptive value per se, its flexibility may be an adaptation to cope with unexpected external or internal contexts, allowing a finer spatiotemporal control of feather growth. Despite the variability found both within and among feather tracts (Fig. 4), overall moult sequence is hardwired by: 1) high stability within-remex tracts (compare their narrow confidence intervals with those of the remaining feather tracts; Fig. 2, Appendix Fig. S1); and 2) primary moult spanning nearly the whole moult process. Moult starts with the activation of the innermost primaries and ends shortly after the outermost ones have completed their growth (inner secondaries and a small percentage of body feathers are the last to be moulted), with the remaining feather tracts being progressively activated throughout primary-moult progress (Newton, 1966; Jenni and Winkler, 2020a, Figs. 3 and 4).
Similarly, flexibility of moult intensity might help birds adapt to scenarios that deviate from normal. For example, birds forced to moult faster because of time constraints (e.g., late breeders) may increase moult intensity by reducing shedding lag between remiges and rectrices and by increasing the percentage of feathers within body feather- and wing covert-tracts growing simultaneously (Figs. 2, 4A and 6C). However, alteration of normal moult intensity may come along with survival and fitness costs since it can have detrimental effects on feather properties (Hall and Fransson, 2000; Griggio et al., 2009; Vágási et al., 2012).
Further experimental study is needed to verify whether the behaviour of aerodynamic parameters throughout the moult process from individuals of species having different wing shapes. Although process, shape, and function are linked, there seems to be an asymmetric relationship among them regarding the moult process, with moult allowing adaptation to changes in wing shape and flight habits. For example, moult sequence in raptors has likely diversified as an adaptation to changes in size and flight habits not the other way around (Zuberogoitia et al., 2018). Behind the apparent homogeneity of the complete moult of passerines, it remains to be shown whether our findings in the House Sparrow are shared across this avian order in relation to size, flight habits, and wing shape. The anomalous remex-moult sequence of Spotted Flycatcher (Muscicapa striata) would pose an extreme scenario to test the general validity of the relationship between aerodynamic constraints and remex-moult intensity (Williamson, 1972; Salewski et al., 2002).
4.2
Protection and constraint hypotheses
Our results lend partial support to the protection hypothesis because not all the pairs of overlapping wing feathers of longitudinally adjacent tracts avoid simultaneous growth (Figs. 1 and 3B; Guallar and Quesada, 2023). On one hand, it is supported by the growth of tertials, which is coordinated with the moult sequence of greater coverts, including the delay of GC10 to avoid the exposure of T1 during the pin phase. Protection of greater coverts show a tendency to avoid growing simultaneously with median coverts and secondaries. On the other hand, the protection hypothesis is rejected by the growth of primaries and primary coverts, which actually grow simultaneously. Primary quills remain uncovered by the primary coverts for the short period during which these grow in (Kasparek, 1979). That primaries remain unprotected by primary coverts during the initial growth stages is counterintuitive given their paramount importance. A possible explanation is that primary quills are more protected than thought. Indeed, the two innermost primaries are covered by the carpal and the outermost greater coverts (Fig. 1), whereas the outer primaries may benefit from a slight advanced shedding of their accompanying primary coverts. More detailed data are needed to tackle this question. Under this light, retention of primary coverts in woodpeckers and some passerine species could be an adaptation to reduce damage risk of growing primaries (Pyle and Howell, 1995; Laesser and van Wijk, 2017).
However, moult sequence does not only impede the sheaths of growing feather tracts from being exposed, it is also directly involved in the dynamics of moult intensity as moult progresses (Fig. 5B). Dynamics of moult intensity may avoid feather synthesis overloads while allowing coordination among growing remiges to reduce aerodynamic costs (Figs. 5, 6A and 7A; Appendix Fig. S2). While overall moult does not seem to be under physiological constraints (Fig. 8), harmful effects may rise when moult intensity is increased, as seen in accelerated moults (Vágási et al., 2010). If remex and body moult peaked simultaneously, the increase in overall moult intensity would preclude the control of aerodynamic loss and at the same time could compromise feather quality. We interpret the relationship between aerodynamics and moult not as an inevitable function loss caused by the latter but as a trade-off between them. The parallelism between the dynamics of remex-moult intensity and wing shape shows that moult process, wing shape, and aerodynamic function are coupled in the House Sparrow. Finally, the fact that primary-shedding lag (but not shedding lag of the similar-sized secondaries) yield opposite results to our predictions indicate that this factor does not behave in an intuitive way in relation to moult intensity, likely because of its interaction with feather size and the allometric relationship with feather-growth rate (Jenni et al., 2020; Appendix Fig. S4).
5.
Conclusion
Our quantified description of the moult sequence both within and among all wing-, tail-, and body-feather tracts in the complete moult of the House Sparrow reveals that it is a plastic and variable process.
We found a clear pattern in the dynamics of wing-feather moult intensity of the House Sparrow: moult intensity differs in magnitude and onset of activation among these tracts, being scheduled so that is highest in the first half of the moult progress, during the peak of body feathers, wing coverts, and rectrices (Fig. 7A), and lowest during the second half, when remiges peak (Figs. 5A and 6B).
Our results support the hypothesis that greater coverts protect the initial stages of tertial and (less clearly) secondary growth. However, we found no full support for this hypothesis between other pairs of adjacent wing-feather tracts (along the longitudinal axis).
We did not find support to the presence of overall physiological constraints to moult in the House Sparrow. However, we found a clear support to the existence of aerodynamic constraints associated with the remex moult in this species.
We propose that the moult of the House Sparrow is controlled through sequence and intensity adjustments in order to: i) avoid body and wing growth peaks; ii) allow protection between certain feather tracts; and iii) reduce detrimental effects on flight ability.
Authors' contributions
Study conception and design: SG; development of methodology: SG; material preparation and data collection: SG; formal analysis of the study data: SG; drafting of the manuscript: SG; critical revision of the manuscript: JQ; research supervision and project administration: JQ. All authors read and approved the final manuscript.
Ethics statement
Ringing permits were granted by Departament de Territori i Sostenibilitat. Generalitat de Catalunya (permits SF/0229/2019; SF/0059/21; SF0072/22).
Competing interest
The authors declare that they have no competing interest.
Acknowledgements
We thank the Fundació Zoo de Barcelona for granting access to the Barcelona Zoo. We are also thankful to Porta's dairy farm. Photograph used in Fig. 1 courtesy of Marc Illa.
Amano, T., Lamming, J.D.L., Sutherland, W.J., 2016. Spatial gaps in global biodiversity information and the role of citizen science. BioScience 66, 393-400.
Anon, A., 2013. New hope for two of the world's most endangered shorebirds. Bird. Watch. 98, 278-290.
Bai, Q., Chen, J., Chen, Z., Dong, G., Dong, J., Dong, W., et al., 2015. Identification of coastal wetlands of international importance for waterbirds: a review of China Coastal Waterbird Surveys 2005-2013. Avian Res. 6, 12.
Bai, M.L., Chih, W.C., Lai, Y.C., Lee, P., Lien, Y.Y., 2018. Aquaculture ponds as important high-tide habitats for waterbirds along the west coast of Taiwan. Ornithol. Sci. 17, 55-67.
Bamford, M., Watkins, D., Bancroft, W., Tischler, G., Wahl, J., 2008. Migratory Shorebirds of the East Asian-Australasian Flyway: Population Estimates and Internationally Important sites. Wetlands International Oceania, Canberra.
Bellio, M., Minton, C., Veltheim, I., 2017. Challenges faced by shorebird species using the inland wetlands of the East Asian-Australasian Flyway: the little curlew example. Mar. Freshw. Res. 68, 999-1009.
BirdLife International, 2012. Species factsheet: Tringa guttifer. . (Accessed 10 March 2012).
BirdLife International, 2016. Tringa guttifer. The IUCN Red List of Threatened Species 2016: e.T22693225A93391729. . (Accessed 31 March 2023).
Campos-Silva, J.V., Peres, C.A., Hawes, J.E., Abrahams, M.I., Andrade, P.C., Davenport, L., 2021. Community-based conservation with formal protection provides large collateral benefits to Amazonian migratory waterbirds. PLoS One 16, e0250022.
Chandler, M., See, L., Copas, K., Bonde, A.M.Z., López, B.C., Danielsen, F., et al., 2017. Contribution of citizen science towards international biodiversity monitoring. Biol. Conserv. 213, 280-294.
Chape, S., Harrison, J., Spalding, M., Lysenko, I., 2005. Measuring the extent and effectiveness of protected areas as an indicator for meeting global biodiversity targets. Philos. T. Roy. Soc. B 360, 443-455.
Choi, C., Gan, X., Hua, N., Wang, Y., Ma, Z., 2014. The habitat use and home range analysis of Dunlin (Calidris alpina) in Chongming Dongtan, China and their conservation implications. Wetlands 34, 255-266.
Choi, C.Y., Li, J., Xue, W.J., 2020. China Coastal Waterbird Census Report (Jan. 2012-Dec. 2019). Hong Kong Bird Watching Society, Hong Kong.
Conklin, J., Verkuil, Y.I., Smith, B.R., 2014. Prioritizing Migratory Shorebirds for Conservation Action on the East Asian-Australasian Flyway. World Wildlife Fund, Hong Kong.
Cui, P., Wu, Y., Ding, H., Wu, J., Cao, M.C., Chen, L., et al., 2014. Status of wintering waterbirds at selected locations in China. Waterbirds 37, 402-409.
Dias, M.P., Granadeiro, J.P., Lecoq, M., Santos, C.D., Palmeirim, J.M., 2006. Distance to high-tide roosts constrains the use of foraging areas by dunlins: Implications for the management of estuarine wetlands. Biol. Conserv. 131, 446-452.
Duan, H., Xia, S., Hou, X., Liu, Y., Yu, X., 2019. Conservation planning following reclamation of intertidal areas throughout the Yellow and Bohai Seas, China. Biodivers. Conserv. 28, 3787-3801.
Duan, H.L., Yu, X.B., Shi, J.B., Lei, J.Y., Xia, S.X., 2021. Identifying conservation priority sites and gaps for the waterbirds habitat along coastal wetlands in mainland China. Acta Ecol. Sin. 41, 9574-9580. (in Chinese).
Freudenberger, L., Hobson, P., Schluck, M., Kreft, S., Vohland, K., Sommer, H., et al., 2013. Nature conservation: priority-setting needs a global change. Biodivers. Conserv. 22, 1255-1281.
Gao, S., Liu, W., Zhang, S., Yi, J.F., Wang, Z., 2021. Diversity of wintering waterbirds in Tiaozini wetland of Dongtai and Rudong wetland, Jiangsu Province. J. Ecol. Rural Environ. 37, 1176-1182. (in Chinese).
Golet, G.H., Low, C., Avery, S., Andrews, K., Mccoll, C.J., Laney, R., et al., 2018. Using ricelands to provide temporary shorebird habitat during migration. Ecol. Appl. 2, 409-426
Green, J.M.H., Sripanomyom, S., Giam, X., Wilcove, D.S., 2015. The ecology and economics of shorebird conservation in a tropical human-modified landscape. J. Appl. Ecol. 52, 1483-1491.
Greenwood, J.J.D., 2007. Citizens, science and bird conservation. J. Ornithol. 148, 77-124.
Handono, C.D., Rihadini, R.S., Febrianto, I., Abdullah, A.Z., 2021. Nordmann's Greenshank population analysis, at Pantai Cemara Jambi.
Hertzog, L.R., Frank, C., Klimek, S., Röder, N., Böhner, H.G.S., Kamp, J., et al., 2021. Model-based integration of citizen science data from disparate sources increases the precision of bird population trends. Divers. Distrib. 27, 1106-1119.
Hua, N., Tan, K., Chen, Y., Ma, Z., 2015. Key research issues concerning the conservation of migratory shorebirds in the Yellow Sea region. Bird Conserv. Int. 25, 38-52.
Jackson, M.V., Choi, C.Y., Amano, T., Estrella, S.M., Lei, W.P., Moores, N., et al., 2020. Navigating coasts of concrete: pervasive use of artificial habitats by shorebirds in the Asia-Pacific. Biol. Conserv. 247, 108591.
Jackson, M.V., Fuller, R.A., Gan, X.J., Li, J., Mao, D.H., Melville, D.S., et al., 2021. Dual threat of tidal flat loss and invasive Spartina alterniflora endanger important shorebird habitat in coastal mainland China. J. Environ. Manag. 278, 111549.
Jung, S.M., Kang, J.H., Kim, I.K., Lee, H.S., Lee, S.W., Hong, S.O., 2018. Autumn migration of Black-faced Spoonbill (Platalea minor) tracked by wild-tracker in East Asia. Kor. J. Environ. Ecol. 32, 478-485.
Kirby, J., 2010. Review 2: Review of current knowledge of bird flyways, principal knowledge gaps and conservation priorities. Flyway Working Group Reviews, CMS Scientific Council.
Kirby, J.S., Stattersfield, A.J., Butchart, S.H.M., Evans, M.I., Grimmett, R.F.A., Jones, V.R., et al., 2008. Key conservation issues for migratory land- and waterbird species on the world's major flyways. Bird Conserv. Int. 18, S49-S73.
Li, B., Liao, C.H., Zhang, X.D., Chen, H.L., Wang, Q., Chen, Z.Y., et al., 2009. Spartina alterniflora invasions in the Yangtze River estuary, China: an overview of current status and ecosystem effects. Ecol. Eng. 35, 511-520.
Liu, M.Y., 2018. Remote sensing analysis of Spartina alterniflora in the coastal areas of China during 1990 to 2015. Doctoral Thesis. Northeast Institute of Geography and Agroecology, Chinese Academy of Sciences. (in Chinese).
Luo, J., Wang, Y., Yang, F., Liu, Z., 2012. Effects of human disturbance on the Hooded Crane (Grus monacha) at stopover sites in northeastern China. Chin. Birds 3, 206-216.
Ma, Z.J., 2017. The importance of habitat protection to bird protection. Bull. Biol. 52, 6-8. (in Chinese).
Ma, Z., Cheng, Y., Wang, J., Fu, X., 2012. The rapid development of birdwatching in mainland China: a new force for bird study and conservation. Bird Conserv. Int. 23, 259-269.
Masero, J.A., 2003. Assessing alternative anthropogenic habitats for conserving waterbirds: Salinas as buffer areas against the impact of natural habitat loss for shorebirds. Biodivers. Conserv. 6, 1157.
Melville, D.S., Chen, Y., Ma, Z., 2016. Shorebirds along the Yellow Sea coast of China face an uncertain future-a review of threats. Emu 116, 100-110.
Moores, N., 2007. South Korea's shorebirds: a review of abundance, distribution, threats and conservation status. Stilt 50, 62-72.
Moores, N., Rogers, D.I., Rogers, K., Hansbro, P.M., 2016. Reclamation of tidal flats and shorebird declines in Saemangeum and elsewhere in the Republic of Korea. Emu 116, 136-146.
Murray, N.J., Fuller, R.A., 2015. Protecting stopover habitat for migratory shorebirds in East Asia. J. Ornithol. 156, S217-S225.
Putra, C.A., Hikmatullah, D., Prawiradilaga, D.M., Harris, J.B., 2015. Surveys at Bagan Percut, Sumatra, reveal its international importance to, migratory shorebirds and breeding herons. KUKILA 2, 46-59.
Qiu, L., Liu, J.E., Chen, J.Q., Wang, G.X., Chang, Q., 2010. Impacts of Spartina alterniflora invasion on the macrobenthos communities of Jiangsu's coastal wetlands. Mar. Sci. 34, 50-55 (in Chinese).
Ren, J., Chen, J., Xu, C., van de Koppel, J., Thomsen, M.S., Qiu, S., et al., 2021. An invasive species erodes the performance of coastal wetland protected areas. Sci. Adv. 7, eabi8943.
Rocha, A.D., Fonseca, D., Masero, J.A., Ramos, J.A., 2016. Coastal saltpans are a good alternative breeding habitat for Kentish plover Charadrius alexandrinus when umbrella species are present. J. Avian Biol. 47, 824-833.
Rodrigues, A.S.L., AkÇAkaya, H.R., Andelman, S.J., Bakarr, M.I., Boitani, L., Brooks, T.M., et al., 2004. Global gap analysis: priority regions for expanding the global protected-area network. BioScience 54, 1092.
Rogers, D.I., Battley, P.F., Piersma, T., Van, G.J.A., Rogers, K.G., 2006a. High-tide habitat choice: insights from modelling roost selection by shorebirds around a tropical bay. Anim. Behav. 3, 563-575.
Rogers, D.I., Piersma, T., Hassell, C.J., 2006b. Roost availability may constrain shorebird distribution: exploring the energetic costs of roosting and disturbance around a tropical bay. Biol. Conserv. 133, 225-235.
Si, Y., Xu, Y., Xu, F., Li, X., Zhang, W., Wielstra, B., et al., 2018. Spring migration patterns, habitat use, and stopover site protection status for two declining waterfowl species wintering in China as revealed by satellite tracking. Ecol. Evol. 8, 6280-6889.
Singh, M., Griaud, C., Collins, C.M., 2021. An evaluation of the effectiveness of protected areas in Thailand. Ecol. Indic. 125, 107536.
Studds, C.E., Kendall, B.E., Murray, N.J., Wilson, H.B., Rogers, D.I., Clemens, R.S., et al., 2017. Rapid population decline in migratory shorebirds relying on Yellow Sea tidal mudflats as stopover sites. Nat. Commun. 8,14895.
Szabo, J.K., Choi, C.Y., Clemens, R.S., Hansen, B., 2016. Conservation without borders-solutions to declines of migratory shorebirds in the East Asian-Australasian Flyway. Emu 116, 215-221.
Tantipisanuh, N., Gale, G.A., Round, P.D., 2016. Incidental impacts from major road construction on one of Asia's most important wetlands: the Inner Gulf of Thailand. Pac. Conserv. Biol. 22, 29-36.
Tong, M., Zhang, L., Jing, L., Zckler, C., Clark, N.A., 2012. The critical importance of the Rudong mudflats, Jiangsu Province, China in the annual cycle of the Spoon-billed Sandpiper Calidris pygmeus. Wader Study Group Bull. 119, 74-77.
Tong, M., Clark, N., Zhang, L., Jing, L., Zöckler, C., 2014. The autumn Rudong SBS Survey 2013. Sbs. TF News Bull. 11, 9-11.
Turrin, C., Watts, B.D., 2016. Sustainable mortality limits for migratory shorebird populations within the East Asian-Australian Flyway. Stilt 68, 2-17.
Urfi, A.J., 2015. Foraging ecology and conservation of waders along coast of India: need for detailed studies. Wader Study 122, 153-159.
Wan, S.W., Qin, P., Liu, J., Zhou, H.X., 2009. The positive and negative effects of exotic Spartina alterniflora in China. Ecol. Eng. 35, 444-452.
Wang, X., Kuang, F., Tan, K., Ma, Z., 2018. Population trends, threats, and conservation recommendations for waterbirds in China. Avian Res. 9, 14.
Wang, J., Liu, H.Y., Li, Y.F., Liu, L., Xie, F.F., Lou, C.R., et al., 2019. Effects of Spartina alterniflora invasion on quality of the red-crowned crane (Grus japonensis) wintering habitat. Environ. Sci. Pollut. Res. 26, 21546-21555.
Wetlands International, 2020. First conservation status review of migratory waterbirds for the East Asian-Australasian Flyway partnership. .
Xia, S., Yu, X., Millington, S., Liu, Y., Jia, Y., Wang, L., et al., 2017. Identifying priority sites and gaps for the conservation of migratory waterbirds in China’s coastal wetlands. Biol. Conserv. 210, 72-82.
Xia, S., Yu, X., Lei, J., Hearn, R., Smith, B., Lei, G., et al., 2020. Priority sites and conservation gaps of wintering waterbirds in the Yangtze River floodplain. J. Geogr. Sci. 30, 1617-1632.
Xu, Y., Pu, L.J., 2014. The variation of land use pattern in tidal flat reclamation zones in Jiangsu coastal area: a case study of Rudong County of Jiangsu Province. J. Nat. Resour. 29, 643-652. (in Chinese).
Yang, H.Y., Chen, B., Barter, M., Piersma, T., Zhou, C.F., Li, F.S., et al., 2011. Impacts of tidal land reclamation in Bohai Bay, China: ongoing losses of critical Yellow Sea waterbird staging and wintering sites. Bird Conserv. Int. 21, 241-259.
Yang, Z.Y., Lagasse, B.J., Xiao, H., Jackson, M.V., Chiang, C.Y., Melville, D.S., et al., 2020. The southern Jiangsu coast is a critical moulting site for Spoon-billed Sandpiper Calidris pygmaea and Nordmann's Greenshank Tringa guttifer. Bird Conserv. Int. 30, 649-660.
Yong, D.L., Kee, J.Y., Aung, P.P., Jain, A., Yeap, C.A., Au, N.J., et al., 2022. Conserving migratory waterbirds and the coastal zone: the future of South-east Asia's intertidal wetlands. Oryx 56, 176-183.
Yu, C.X., Ngoprasert, D., Savini, T., Round, P.D., Gale, G.A., 2020. Distribution modelling of the endangered spotted Greenshank (Tringa guttifer) in a key area within its winter range. Global Ecol. Conserv. 22, e00975.
Zang, M., Hong, Y.M., Zhang, Q., Fan, H.M., Chan, S., Cheong, K.T., et al., 2019. Response of shorebird habitat selection to coastal reclamation and urbanization in an extensively developed delta: a case study in Macao, China. Ocean Coastal Manag. 179, 104871.
Zhang, L., Ouyang, Z., 2019. Focusing on rapid urbanization areas can control the rapid loss of migratory water bird habitats in China. Global Ecol. Conserv. 20, e00801.
Zhu, B.R., Verhoeven, M.A., Nicolas, V., Lisa, S.A., Zhang, Z., Theunis, P., 2022. Current breeding distributions and predicted range shifts under climate change in two subspecies of Black-tailed Godwits in Asia. Global Change Biol. 28, 5416-5426.
Zöckler, C., Li, D., Chowdhury, S.U., Iqbal, M., Chen, X., 2018. Winter distribution, habitat and feeding behaviour of Nordmann's Greenshank Tringa guttifer. Wader Study 125, 7-14.
Table
1.
Summary of the tests of the protection hypotheses between feathers of longitudinally adjacent tracts on the wing of the House Sparrow.
χ21
p
n
GC10 versus T (nil)
0
1
81
GC10 versus T (random)
5.23
0.022
81
GC 2–7 versus S (nil)
3.16
0.076
263
GC 2–7 versus S (random)
94.69
< 0.001
263
MeC versus GC 1–9 (nil)
5.96
0.015
184
MeC versus GC 1–9 (random)
55.61
< 0.001
184
In parenthesis type of hypothesis tested: deviation from nil simultaneous growth and from random occurrence of simultaneous growth. We only found one individual with T1 and T2 growing as pins simultaneously. This same individual also had shed GC10, which suggests a moulting error.

 DownLoad:


 Email Alerts
 RSS Feeds