Guangdong Key Laboratory of Animal Conservation and Resource Utilization, Institute of Zoology, Guangdong Academy of Sciences, Guangzhou, Guangdong, 510260, China
b.
Tibet Plateau Institute of Biology, Lhasa, 850001, China
c.
Zhejiang Zhoushan Island Ecosystem Observation and Research Station, Institute of Eco-Chongming, Zhejiang Tiantong Forest Ecosystem National Observation and Research Station, School of Ecological and Environmental Sciences, East China Normal University, Shanghai, 200241, China
Funds:
the Key R&D Program of Tibet Autonomous RegionXZ202301ZY0019G
the Local Development of Science and Technology by the Central GovernmentXZ202301YD0007C
the National Natural Science Foundation of China31400361
Beta diversity, the variation of community composition among sites, bridges alpha and gamma diversity and can reveal the mechanisms of community assembly through applying distance-decay models and/or partitioning beta diversity into turnover and nestedness components from functional and phylogenetic perspectives. Mountains as the most natural experiment system provide good opportunities for exploring beta diversity patterns and the underlying ecological processes. Here, we simultaneously consider distance-decay models and multiple dimensions of beta diversity to examine spatial variations of bird communities, and to evaluate the relative importance of niche-based and neutral community assembly mechanisms along a 3600-m elevational gradient in the central Himalayas, China. Our results showed that species turnover dominates taxonomic, functional, and phylogenetic beta diversity. We observed strongest evidence of spatial distance decays in taxonomic similarities of birds, followed by its phylogenetic and functional analogues. Turnover component was highest in taxonomic beta diversity, while nestedness component was highest in functional beta diversity. Further, all correlations of assemblage similarity with climatic distance were higher than that with spatial distances. Standardized values of overall taxonomic, functional, and phylogenetic beta diversity and their turnover components increase with increasing elevational distance, while the standardized values of taxonomic and phylogenetic nestedness decreased with increasing elevational distance. Our results highlighted the niche-based deterministic processes in shaping elevational bird diversity patterns that were determined by the relative roles of decreasing trend of environmental filtering and increasing trend of limiting similarity along elevation distances.
Understanding how species composition varies among sites across space or time (i.e., beta diversity) is a key issue and fundamental topic in ecology (Svenning et al., 2011; da Silva et al., 2018; Carlos-Júnior et al., 2019; Zeng et al., 2022). The increased interest in beta diversity comes from the recognition of its important roles in revealing community assembly mechanisms (Zellweger et al., 2017; Soininen et al., 2018; Du et al., 2021), and helping guide conservation practices (reviewed in Socolar et al., 2016). Major progresses have been made in the field of beta diversity studies by decomposing beta diversity into its turnover and nestedness components (Baselga, 2010), and/or by incorporating species' functional traits and evolutionary histories (Swenson et al., 2011; Leprieur et al., 2012). Specifically, the former enables deeper insights into mechanisms driving the variation in biodiversity (Baselga et al., 2012; Si et al., 2015; Soininen et al., 2018), while the latter offers a complete perspective on biodiversity and better captures community assembly (Perez Rocha et al., 2018; Branco et al., 2020; González-Trujillo et al., 2020; Jiang et al., 2021). Thus, it has now been widely acknowledged that simultaneous consideration of taxonomic, functional, and phylogenetic dimensions of biodiversity, and adoption of beta diversity partitioning framework would help us better understand community structure and the underlying mechanism of community ecological processes.
Another promising approach which measures traits or lineage composition varying among sites (i.e., functional or phylogenetic beta diversity) could provide additional insights into community assembly (Swenson et al., 2011; Leprieur et al., 2012; Siefert et al., 2013). Specifically, if variation in trait or lineage composition is similar as random expectations given the observed species beta diversity, a product of neutral processes could be drawn. In contrast, when variation in trait or lineage composition was higher or lower than random expectations, niche-based deterministic processes were considered dominant in driving community dissimilarity (Swenson et al., 2011; Vellend et al., 2014; Du et al., 2021; Ge et al., 2021). However, integrating both above methods jointly remains scarce, which may hamper the opportunity of gaining new perspectives on community structure and assembly of communities.
Mountains only occupy about 25% of the world's total continental land surface, but harbor roughly 87% of the world's species, and are thus believed to be critical for global biodiversity conservation (reviewed in Rahbek et al., 2019). Indeed, mountains are considered to provide the most powerful natural experiment for exploring spatial patterns of biodiversity and community structure as they contain dramatic geophysical changes over relatively short spatial distances (Körner, 2007). Yet since ecologists committed to mountain studies over two centuries (Rahbek et al., 2019), much less attention have been paid to elevational beta-diversity, especially multidimensional beta diversity, compared to the well-known elevational alpha-diversity (Wang et al., 2012, 2022; Mori et al., 2018; García-Navas et al., 2020). This lack of attention may hamper our understanding on mechanisms driving community dissimilarities (Wang et al., 2012; García-Navas et al., 2020, 2022), thereby limiting the opportunities for informing conservation practices and improving habitat management and restoration (Sreekar et al., 2020; Du et al., 2021).
The Himalayan Mountains are the highest mountains in the world, containing a typical mountain environment that supports high biodiversity with many rare species. They are also popularly known for their high beta diversity (Gaston et al., 2007). This system provides unique opportunity to improve our understanding of niche-and dispersal-based processes, and then enrich knowledge bases of beta diversity studies. Here, we sampled bird communities along a 3600-m altitudinal gradient at Gyriong Valley of Gyirong County in Xizang, China, and simultaneously consider distance-decay models and multiple dimensions of beta diversity to address the following two questions: 1) What are the elevational patterns of taxonomic, functional, and phylogenetic bird beta diversity, and how do they differ from one another? 2) What are the taxonomic, functional, and phylogenetic structures of bird communities, and the relative importance of niche- and neutral-based processes underlying them? According to the distance-decay relationship (Morlon et al., 2008), we predicted an increase in beta diversity with increasing elevational distance among communities. Further, we expected functional and phylogenetic beta diversity should be lower than their taxonomic counterparts because stressful environments at high elevations select for certain traits/lineages that are suited to those conditions, resulting in functional/phylogenetic clustering between elevation bands. On the other hand, when species with different ecological performance (e.g., unique traits or lineages) frequently loss or gain, functional/phylogenetic beta diversity could be higher than its taxonomic counterparts (Siefert et al., 2013; Weinstein et al., 2014; Du et al., 2021). In addition, we expected multiple dimensions of beta diversity should be driven largely by turnover in mountain birds because species are replaced frequently across various ecosystems and taxonomic groups (Soininen et al., 2018). Finally, strong competition could be induced as the environment changes from benign to harsh when moving from low to high elevation. We then expect stronger competitive exclusion and a weaker environmental filtering in structuring the communities with increasing elevational distances.
2.
Materials and methods
2.1
Study sites
Field studies were conducted in Gyirong Valley (28°15′–29°0′ N, 85°6′–85°41′ E), the longest and westernmost canyon of Mt. Qomolangma National Nature Reserve on the southern slope of the central Himalaya, China. The Himalayas is the youngest and highest mountain chain on the Earth, and is also known as 'Asia's water tower'. The studied valley has a length of ca. 72 km from the lowest Resuo Village at 1800 m a.s.l. to the summit of Mt. Mala at 5400 m a.s.l. This valley includes five distinct vegetation types, which are evergreen broadleaf forests (1800–2500 m), coniferous and broadleaf mixed forests (2500–3300 m), subalpine coniferous forests (3300–3900 m), alpine bush and meadow (3900–4700 m), and alpine tundra with sparse herbs (4700–5400 m) (Ding et al., 2021).
2.2
Bird surveys
We collected bird data (richness and abundance) using line transect methods (Bibby et al., 2000) in the wet season from 2012 to 2013 (i.e., four repeated surveys, May and June in 2012, August in 2012, September and October in 2012, July and August in 2013). This dataset was published in Ding et al. (2021) and we here re-analyzed this dataset for beta diversity measures. More detailed descriptions about bird survey methods are given in Ding et al. (2021), which focused on alpha components of taxonomic, functional, and phylogenetic diversity in the same region.
Following previous studies (McCain, 2009; Wu et al., 2013; Quintero and Jetz, 2018; Ding et al., 2021), we excluded migrant birds which likely cause potential biases from seasonal, long-distance movements, but instead only included breeding resident birds for subsequent analyses. Information of migratory status was extracted from the local literature (Zheng et al., 1983). In addition, we also excluded shorebirds and owls because of their highly specific habitats, and nocturnal behavior, respectively. As a result, a total of 151 breeding birds were recorded in the present study (Appendix Fig. S1).
2.3
Traits and phylogenies
We used four traits in this study, including one continuous (body mass) and three categorical types (feeding guild, foraging behavior, or stratum). Presence or absence was scored for feeding guild (carnivore, granivore, insectivore, or omnivore), foraging behavior (glean, probe, leap, or sally), and foraging stratum (ground, understorey, midstorey, canopy, or air) (Ding et al., 2013). All these selected traits were related to resource use, energy requirements and trophic levels (Ding et al., 2013; Si et al., 2016), which were compiled from the local literature The Avifauna of Xizang (Zheng et al., 1983). Note that all traits used in this study exhibited significant phylogenetic signal (Ding et al., 2021).
We constructed a phylogenetic tree for the study species by pruning the global phylogenetic tree of birds from BirdTree (http://birdtree.org) under the option of 'Hackett All Species: a set of 10,000 trees with 9993 OTUs each' (Jetz et al., 2012). We then sampled 5000 pseudo-posterior distributions and estimated the Maximum Clade Credibility tree using mean node heights by the software TreeAnnonator v1.10.4 of the BEAST package (Drummond and Rambaut, 2007). The resulting tree was used for all subsequent analyses on phylogenetic analyses (Appendix Fig. S1).
2.4
Analysis of beta diversity
We computed multiple-site and pairwise taxonomic, functional and phylogenetic beta diversity following Baselga's method (Baselga, 2010). For multiple-site (indicated in capital letters), overall dissimilarity (βSOR) was partitioned into the pure spatial turnover (βSIM) and nestedness components (βSNE). The ratio between βSIM and βSOR (i.e., βRATIO = βSIM/βSOR) indicated the relative contribution of the turnover component to β-diversity from taxonomic, functional, and phylogenetic dimensions (i.e., TβRATIO, FβRATIO and PβRATIO). For pairwise site (indicated in small letters), the overall β diversity (βsor, βfuncsor and βphylosor refer to taxonomic, functional, and phylogenetic beta diversity, respectively), which was indicated by the Sørensen dissimilarity index, was additively decomposed into two components accounting for pure spatial turnover (βsim, βfuncsim and βphylosim) and nestedness (βsne, βfuncsne and βphylosne). All the above analyses were performed in R using 'betapart' package (Baselga and Orme, 2012).
2.5
Standardization of beta diversity
We used null models to assess whether taxonomic, functional, phylogenetic dissimilarities and its partitioned components were deviated from expected values by chance. We run null models by maintaining species occupancy and species richness 1000 times (i.e., fixed-row fixed-column algorithm, or quasiswap algorithm; Jonsson, 2001; Miklós and Podani, 2004), and calculated the standardized effect size of functional, phylogenetic dissimilarities and its partitioned components as:
SES=Obs−MeannullSDnull
where Obs is the observed value of β-diversity measures, Meannull and SDnull is the mean and standard deviation of the null expectations, respectively.
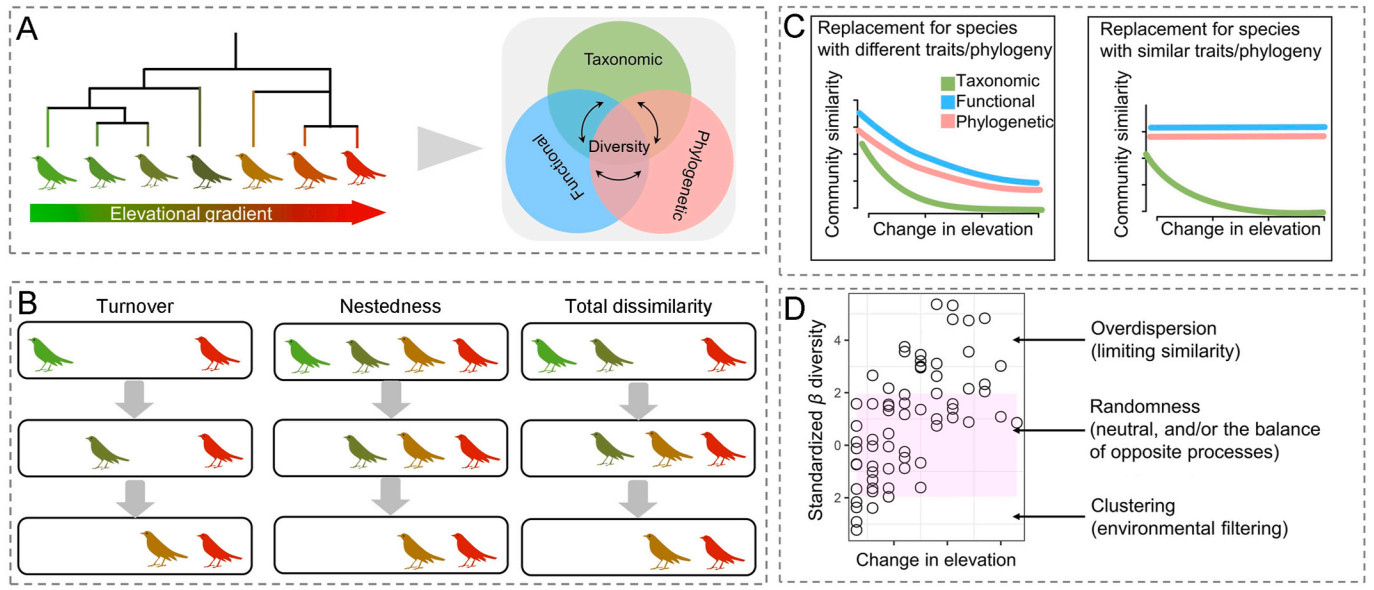
SES values deviated from null expectations indicate the dominance of non-random assembly (deterministic processes; Webb et al., 2002). Specifically, if SES values were higher than 1.96, it indicates the observed beta diversity was significantly higher than expected, and competitive exclusion may drive community overdispersion; if SES values were below −1.96, it indicates that observed beta diversity was significantly lower than expected, and environmental filtering may drive community clustering (Fig. 1). In addition to the extent of the deviation from our null expectation, we also aimed to investigate directional trends in the SES values along the elevational gradient. To this end, we used the loess function in R to plot the relationship of each SES values along the elevation gradient (see Fig. 2).
Figure
1.
Conceptual framework showing the analytical approach in this study. (A) Beta diversity have three complementary components including taxonomic, functional and phylogenetic dimensions; (B) Pairwise community dissimilarities and its turnover and nestedness components; (C) Distance decay of similarities in three dimensions, and its corresponding turnover and nestedness components; (D) The relative importance of niche-based and neutral community assembly mechanisms by applying null model procedures.
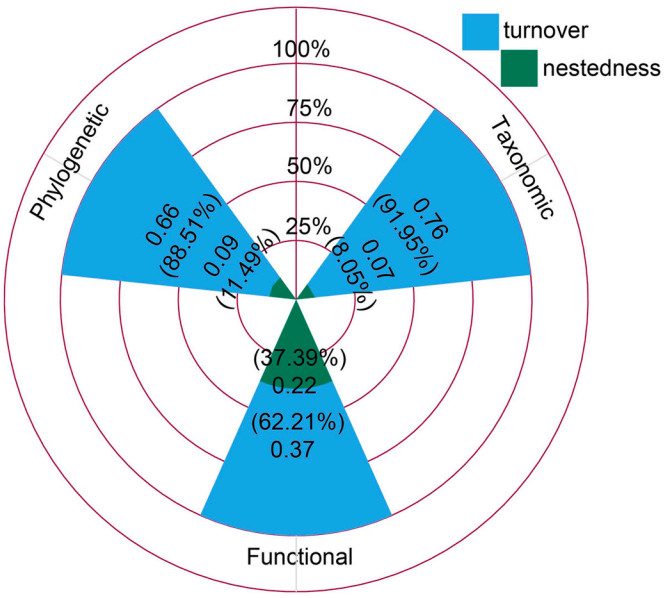
Figure
2.
The multiple-site Sørensen dissimilarity (βSOR) and its spatial turnover (βSIM) and nestedness components (βSNE). Values outside the brackets are multiple-site Sørensen dissimilarity, and those inside the brackets represent the ratio of each component to total dissimilarity (βRATIO).
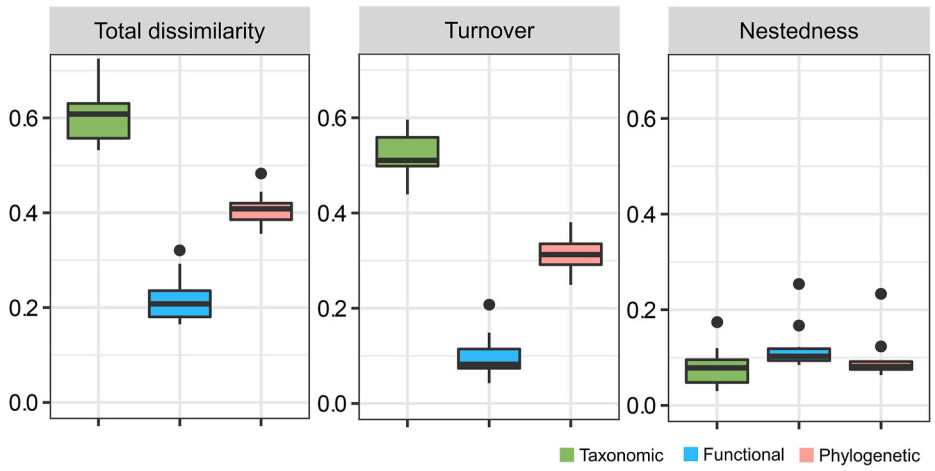
Figure
3.
The dissimilarities driven by turnover, nestedness and their combinations at taxonomic, functional, and phylogenetic dimensions of breeding birds in the central Himalaya, China.
2.6
Decay of similarities with spatial and climatic distance
We computed the similarity index, 1–βsor (of βsim and βsne), using the beta.pair function of the package 'betapart' (Baselga and Orme, 2012). In this study, distance decay of similarity was modelled by the negative exponential curve between the community similarity and elevational distances (Nekola and McGill, 2014; Graco-Roza et al., 2022). These non-linear fits were performed using decay.model of the package 'betapart' (Baselga and Orme, 2012), and specified the similarity index and elevational distances as the response and explanatory variables, respectively. Specifically, we conducted the distance decay model via generalized linear models (GLMs) following a quasi-binomial family with log-link (Millar et al., 2011). In this framework, the slope of the model represents the rate of similarity decay, and the r2 represents the strength of similarity-distance relationships. Climate data (i.e., precipitation and temperature) were obtained from WordClim database (http://www.worldclim.org, 1950–2000) at a 30 arc-s resolution. The value for each elevational band was then calculated as the average of all grid cells within it (Ding et al., 2021). Following Baselga and Gómez-Rodríguez (2021), we quantified climatic effects using mean annual temperature and annual precipitation. Given their high correlation between mean annual temperature and annual precipitation (r = 0.986*), we used mean annual temperature only in this study.
3.
Results
3.1
Ratio of each component to total dissimilarity
For multiple-site beta diversity, the spatial turnover component was the larger component of total dissimilarity. Specifically, spatial turnover had the highest importance in functional beta diversity, followed by phylogenetic and taxonomic analogues. In contrast, nestedness-resultant component played a minor role in generating beta-diversity patterns (all βRATIO > 0.5).
For pairwise beta diversity, taxonomic beta diversity was relatively higher than its functional and phylogenetic dimensions (βsor > βfuncsim/βphylosim). Moreover, taxonomic turnover was relatively higher than its functional and phylogenetic dimensions (βsim > βphylosim/βfuncsim), whereas nestedness-resultant dissimilarities of functional dimensions tended to be higher than its species and phylogenetic dimension (βfuncsne > βphylosne/βsne).
3.2
Distance-decay of similarities with spatial and climatic distances
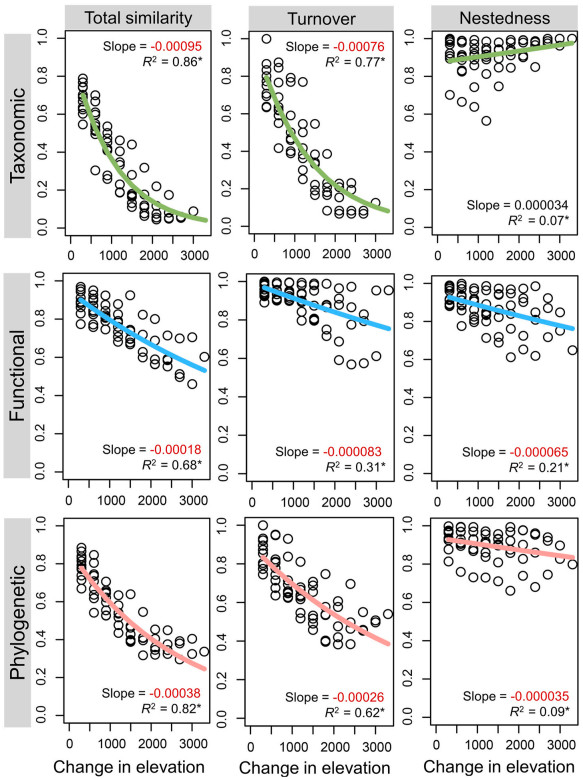
Considering absolute value, spatial distance decays of taxonomic similarities were the strongest, followed by the distance decays of phylogenetic similarities and functional similarities (Fig. 4). Similar results were found for turnover components of multidimensional beta diversity, whereas contrasting patterns were observed in its nestedness components. Specifically, slopes of the spatial distance decay were largely negative, and ranged from −0.00095 to 0.000034. Furthermore, we found that all correlations of assemblage similarity with climatic distance were higher than that with spatial distances, and these slopes ranged from −0.18 to 0.0065 (Appendix Fig. S2).
Figure
4.
Distance-decay models for breeding birds along the central Himalayan elevation gradient. The negative values were highlighted in red. (For interpretation of the references to colour in this figure legend, the reader is referred to the Web version of this article.)
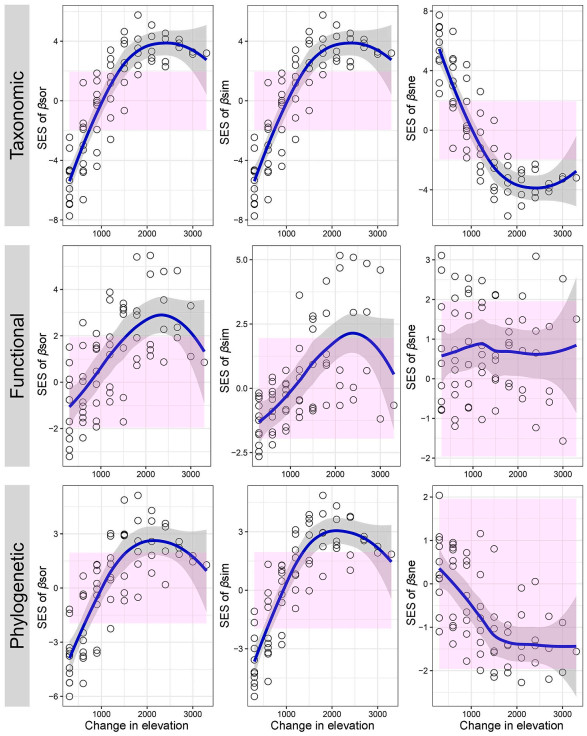
Generally, the standardized effect size of overall taxonomic, functional, and phylogenetic beta diversity and their turnover components increased with increasing elevational distance (Fig. 5), indicating a general tendency that SES values vary from less than 0 to greater than 0. In contrast, the SES values of taxonomic and phylogenetic nestedness decreased with increasing elevational distance.
Figure
5.
The relationships between the standardized effect size (SES) of turnover, nestedness and their combinations at taxonomic, functional, phylogenetic dimensions and elevational distance. The pink shaded area indicated the α = 0.05 threshold of ±1.96 SES for significantly non-random values. The blue line represents the fit based on Loess smoothing. Each circle represents a comparison between the lowest elevation (1800 m) and the subsequent higher elevations. (For interpretation of the references to colour in this figure legend, the reader is referred to the Web version of this article.)
In this study, we analyzed taxonomic, functional, and phylogenetic beta diversity and its turnover and nestedness components of breeding birds along a 3600-m elevation gradient in the central Himalaya. We showed that spatial turnover components were the main drivers of multiple dimensions of beta diversity, and significant distance-decay relationships were found in all overall beta diversity and turnover components, and most of nestedness components. In addition, higher correlations of assemblage similarity with climatic than with spatial distance were detected. Furthermore, we found a central role for deterministic processes in shaping multiple dimensions of beta diversity of breeding birds in the central Himalayan elevational gradient.
4.1
Dominance of turnover in beta diversity
For multiple-site dissimilarities, turnover likely dominate multiple dimensions of beta diversity compared to nestedness across a wide range of taxa and realms (Soininen et al., 2018), indicating that turnover mainly measures compositional dissimilarities of communities between bands, whereas nestedness quantifies more about richness differences (e.g., Soininen et al., 2018; Zhao et al., 2021; Wang et al., 2022). This also suggests that species turnover caused by species sorting or dispersal processes quantifies mostly the same phenomenon as total dissimilarity (Baselga, 2010; Soininen et al., 2018).
When considering pairwise beta diversity, the results of this study indicated that taxonomic turnover was higher than their functional and phylogenetic dimensions, whereas functional nestedness was higher than their taxonomic and phylogenetic analogues (Fig. 3). This is probably because species replacement could occur between phylogenetically related species with similar functional traits (Graham and Fine, 2008; Siefert et al., 2013; Villéger et al., 2013; Wang et al., 2022), but species loss/gain occurred more commonly among distantly related species with similar traits (Zhao et al., 2021). These results meant that different but interdependent outcomes could be produced by the assembling processes at different dimensions of beta diversity, highlighting the necessity of simultaneously integrating multiple dimensions when inferring assembly processes (Du et al., 2021; Wang et al., 2022).
At the functional dimensions, we found an important role of nestedness in total dissimilarities. This result is consistent with previous work on ants (Du et al., 2021; Zhao et al., 2021), spiders (Wu et al., 2017), amphibians (Wang et al., 2022), passerines, and rodents, suggesting an ordered loss of birds' functional roles along elevational gradient to some extent (e.g., Bishop et al., 2015; Si et al., 2016; Du et al., 2021). In addition, variations in functional turnover reveal functional redundancy among bird communities (Ricotta et al., 2020), and this is also true for alpha functional diversity (Ding et al., 2021). In contrast, phylogenetic turnover remains dominating the total beta diversity, suggesting that turnover occurs in species with distant phylogenies (e.g., Du et al., 2021; Zhao et al., 2021). For instance, ground-feeding birds like quails and pheasants occupy a relatively distant lineage, but inhabit mainly at high elevations (Ding et al., 2019), and our previous findings showed that bird phylogenetic structure tended towards clustering at mid-elevations and overdispersion towards low and high elevations (Ding et al., 2021). Taken together, this might indicate that distantly related lineages occupy at mid-elevations, whereas closed related lineages occupy at both ends of gradient.
However, we noted that our surveys spanned several months from May to early October, largely overlapping the breeding season in this region that are from May to the end of September (Zheng et al., 1983), so it may result in high proportion of turnover component than that if we had only collected bird data during a short period of the breeding season (Liang et al., 2021; He et al., 2022). In this region, some species (e.g., Chaimarrornis leucocephalus, Heterophasia capistrata) have the records of seasonal migration, the estimates of turnover component will be higher than that if we surveyed birds in the non-breeding seasons because of more constrained ranges of breeding birds. While such overestimation is certainly present, our results are still reliable, given the turnover is the dominant process of multiple dimensions of β diversity (Soininen et al., 2018). At the meantime, more studies are needed to test the seasonal movements of breeding birds in this area when the data are available.
4.2
Decay of similarities with spatial and climatic distance
We found that elevational distances negatively influenced multiple dimensions of community similarity (except taxonomic nestedness), and distance decay of total taxonomic similarities was stronger than its functional and phylogenetic dimensions (Fig. 4). This result is consistent with previous global syntheses revealing that taxonomic distance decay is generally stronger than its functional dimensions (reviewed in Graco-Roza et al., 2022), likely reflecting the fact that species variation occurred in different traits/phylogeny among assemblages (Fig. 1). The major reason lies in that taxonomic composition was more influenced by dispersal limitation or species pool effects than functional composition (Soininen et al., 2016). Indeed, the distance decay of functional similarity was believed to have limited ability to reflect the spatial differences in biotic communities, probably because deterministic and stochastic factors have different roles in shaping community composition (Graco-Roza et al., 2022).
In this study, the distance decay of turnover component was similar to that of total similarities. This is because turnover dominated the total beta diversity, and to some extent, turnover seemed to be a good surrogate of total beta diversity (Soininen et al., 2018). However, the distance decay of nestedness component showed contrasting pattern across three dimensions. Specifically, the distance decay of taxonomic nestedness increased with elevational distance, probably driven by the loss or gain of small-ranged species or rare species. Although counterintuitive, this relationship has been found previously (e.g., Fontana et al., 2020; Kusumoto et al., 2021; Wang et al., 2022); however, given the relatively low statistic power (Fig. 4), more comprehensive and more systematic studies would be very necessary.
Further, our finding that strong relationship exists between assemblage similarity and climatic distance suggests that ecological niches shaped breeding bird assemblages in central Himalayan elevation gradient. This is especially true for birds because they are often considered as good dispersers, and seem not to be affected by dispersal limitation especially at small scales in this study (e.g., Araújo et al., 2005; Baselga and Gómez-Rodríguez, 2021), as indicated by previous studies that the degree to which the environment controls distance-decay patterns via niche processes varies with dispersal ability (e.g., Astorga et al., 2012; Saito et al., 2015; Gómez-Rodríguez and Baselga, 2018; Baselaga and Gómez-Rodríguez, 2021).
4.3
Standardized pairwise dissimilarities
Generally, there is a shift from clustered to overdispersed taxonomic, functional, and phylogenetic community structure (total dissimilarities and its turnover components) (Fig. 5). It should be noted that a relatively high proportion of SES values fall between −1.96 and 1.96, implying a product of random structure (Du et al., 2021; Wang et al., 2022). However, we could not tease apart randomness from deterministic (the balance of environmental filtering and limiting similarity) or neutral process (Fig. 1). Specifically, the SES of taxonomic, functional and phylogenetic total dissimilarities and turnover increased with increasing elevational distances, showing a gradual weakening trend of environmental filtering but strengthened trend of limiting similarity. This pattern is consistent with previous work on plants in the same study system (unpublished data), and is commonly reported in beta diversity along the elevational gradient in a wide range of taxa (e.g., Swenson et al., 2011; Dehling et al., 2014; Bishop et al., 2015; Tello et al., 2015; Tolmos et al., 2022). It seems clear that additional studies are needed to test the universality of our findings.
In contrast, the SES of functional, and taxonomic and phylogenetic nestedness show no clear pattern, and a decreasing trend with the increase in elevational distances, respectively. Given that most SES values of functional and phylogenetic nestedness were between −1.96 and 1.96, we could infer that these communities were assembled by random process. However, nestedness components of phylogenetic dissimilarity still showed downward trend, indicating a gradual strengthened of clustering. This pattern could be jointly driven by the weaker competitive exclusion and stronger environmental filtering. Combined with the pattern of taxonomic nestedness, we could infer that phylogenetic losses/gains occurred frequently among distantly related species.
4.4
Caveats
We acknowledged that our line-transect surveys may be affected by imperfect detection of rare or elusive species residing in dense forests, leading to the underestimation and potential impacts on our observed beta diversity patterns (Si et al., 2018). In fact, the problem of imperfect detection is more likely to occur in areas with low and mid-elevations due to the prevalence of dense forests (Ding et al., 2019). Therefore, to obtain reliable results, continuous efforts on data collection are required (Feeley and Silman, 2011), and we should also improve the sampling design to better record rare species (Specht et al., 2017).
5.
Conclusions
Distance decay of similarity at multiple dimensions is a useful tool reflecting dispersal-related factors, and also for understanding species' response to climatic and spatially structured environmental variables (Soininen et al., 2007; Graco-Roza et al., 2022). When combining this method and beta diversity partitioning approach across multiple dimensions, additional insights on elevational patterns and assembly processes could be obtained (e.g., Du et al., 2021; Zhao et al., 2021; Wang et al., 2022). By comprehensively considering many aspects of beta diversity across a wide elevation range varying from 1800 to 5400 m, we found that turnover dominated taxonomic and phylogenetic beta diversity, whereas nestedness played an important role in functional dimensions. Additionally, distance decay of similarity decreased with the increase in elevational distance except taxonomic nestedness. Elevational beta diversity was primarily driven by deterministic process (from decreasing filtering to increasing limiting similarity), although we could not disentangle the effects of environmental filtering and limiting similarity (e.g., Du et al., 2021; Wang et al., 2022). Our results highlighted the niche-based deterministic processes in shaping elevational bird diversity patterns that were determined by the relative roles of decreasing trend of environmental filtering and increasing trend of limiting similarity along elevation distances.
Ethics statement
Ethical approval was not required since we did not manipulate any living animals. All data were obtained from field observation.
The authors declare that they have no known competing financial interests or personal relationships that could have appeared to influence the work reported in this paper.
Acknowledgements
We are grateful to Jingjing Li, Hongfen Cao, Li Xie and many other graduate students in our group for the field surveys, and thank the Qomolangma National Nature Reserve for the permits to conduct the research in the Gyirong Valley. We also thank Dr. Yuhao Zhao and Dr. Di Zeng at East China Normal University for constructive suggestions and patient helps on data analyses.
Araújo, M.B., Pearson, R.G., Rahbek, C., 2005. Equilibrium of species' distributions with climate. Ecography 28, 693–695.
Astorga, A., Oksanen, J., Luoto, M., Soininen, J., Virtanen, R., Muotka, T., 2012. Distance decay of similarity in freshwater communities: do macro-and microorganisms follow the same rules? Global Ecol. Biogeogr. 21, 365–375.
Baselga, A., 2010. Partitioning the turnover and nestedness components of beta diversity. Global Ecol. Biogeogr. 19, 134–143.
Baselga, A., Gómez-Rodríguez, C., 2021. Assessing the equilibrium between assemblage composition and climate: a directional distance-decay approach. J. Anim. Ecol. 90, 1906–1918.
Baselga, A., Gómez-Rodríguez, C., Lobo, J.M., 2012. Historical legacies in world amphibian diversity revealed by the turnover and nestedness components of beta diversity. PLoS One 7, e32341.
Baselga, A., Orme, C.D.L., 2012. betapart: an R package for the study of beta diversity. Methods Ecol. Evol. 3, 808–812.
Bibby, C.J., Burgess, N.D., Hillis, D.A., Mustoe, S.H., 2000. Bird Census Techniques, second ed. Academic Press, London.
Bishop, T.R., Robertson, M.P., van Rensburg, B.J., Parr, C.L., 2015. Contrasting species and functional beta diversity in montane ant assemblages. J. Biogeogr. 42, 1776–1786.
Branco, C.C.Z., Bispo, P.C., Peres, C.K., Tonetto, A.F., Krupek, R.A., Barfield, M., et al., 2020. Partitioning multiple facets of beta diversity in a tropical stream macroalgal metacommunity. J. Biogeogr. 47, 1765–1780.
Carlos-Júnior, L.A., Spencer, M., Neves, D.M., Moulton, T.P., de Oliveira Pires, D., e Castro, C.B., et al., 2019. Rarity and beta diversity assessment as tools for guiding conservation strategies in marine tropical subtidal communities. Divers. Distrib. 25, 743–757.
Chase, J.M., Kraft, N.J.B., Smith, K.G., Vellend, M., Inouye, B.D., 2011. Using null models to disentangle variation in community dissimilarity from variation in α-diversity. Ecosphere 2, 1–11.
Condit, R., Pitman, N., Leigh Jr, E.G., Chave, J., Terborgh, J., Foster, R.B., et al., 2002. Beta-diversity in tropical forest trees. Science 295, 666–669.
da Silva, P.G., Lobo, J.M., Hensen, M.C., Vaz-de-Mello, F.Z., Hernández, M.I.M., 2018. Turnover and nestedness in subtropical dung beetle assemblages along an elevational gradient. Divers. Distrib. 24, 1277–1290.
Dehling, D.M., Fritz, S.A., Töpfer, T., Päckert, M., Estler, P., Böhning-Gaese, K., et al., 2014. Functional and phylogenetic diversity and assemblage structure of frugivorous birds along an elevational gradient in the tropical Andes. Ecography 37, 1047–1055.
Ding, Z., Feeley, K.J., Wang, Y., Pakeman, R.J., Ding, P., 2013. Patterns of bird functional diversity on land-bridge island fragments. J. Anim. Ecol. 82, 781–790.
Ding, Z., Hu, H., Cadotte, M.W., Liang, J., Hu, Y., Si, X., 2021. Elevational patterns of bird functional and phylogenetic structure in the central Himalaya. Ecography 44, 1403–1417.
Ding, Z., Liang, J., Hu, Y., Zhou, Z., Sun, H., Liu, L., et al., 2019. Different responses of avian feeding guilds to spatial and environmental factors across an elevation gradient in the central Himalaya. Ecol. Evol. 9, 4116–4128.
Drummond, A.J., Rambaut, A., 2007. BEAST: Bayesian evolutionary analysis by sampling trees. BMC Evol. Biol. 7, 214.
Du, Y., Fan, L., Xu, Z., Wen, Z., Cai, T., Feijo, A., et al., 2021. A multi-faceted comparative perspective on elevational beta-diversity: the patterns and their causes. Proc. R. Soc. B 288, 20210343.
Feeley, K.J., Silman, M.R., 2011. Keep collecting: accurate species distribution modelling requires more collections than previously thought. Divers. Distrib. 17, 1132–1140.
Fontana, V., Guariento, E., Hilpold, A., Niedrist, G., Steinwandter, M., Spitale, D., et al., 2020. Species richness and beta diversity patterns of multiple taxa along an elevational gradient in pastured grasslands in the European Alps. Sci. Rep. 10, 12516.
García‐Navas, V., Sattler, T., Schmid, H., Ozgul, A., 2020. Temporal homogenization of functional and beta diversity in bird communities of the Swiss Alps. Divers. Distrib. 26, 900–911.
García-Navas, V., Martínez‐Núñez, C., Tarifa, R., Molina-Pardo, J.L., Valera, F., Salido, T., et al., 2022. Partitioning beta diversity to untangle mechanisms underlying the assembly of bird communities in Mediterranean olive groves. Divers. Distrib. 28, 112–127.
Gaston, K.J., Davies, R.G., Orme, C.D.L., Olson, V.A., Thomas, G.H., Ding, T-S., et al., 2007. Spatial turnover in the global avifauna. Proc. R. Soc. B 274, 1567–1574.
Ge, Y., Meng, X., Heino, J., García-Girón, J., Liu, Y., Li, Z., et al., 2021. Stochasticity overrides deterministic processes in structuring macroinvertebrate communities in a plateau aquatic system. Ecosphere 12, e03675.
Gómez‐Rodríguez, C., Baselga, A., 2018. Variation among European beetle taxa in patterns of distance decay of similarity suggests a major role of dispersal processes. Ecography 41, 1825–1834.
González-Trujillo, J.D., Pedraza-Garzón, E., Donato-Rondon, J.C., Sabater, S., 2020. Ecoregional characteristics drive the distribution patterns of neotropical stream diatoms. J. Phycol. 56, 1053–1065.
Graco-Roza, C., Aarnio, S., Abrego, N., Acosta, A.T.R., Alahuhta, J., Altman, J., et al., 2022. Distance decay 2.0-a global synthesis of taxonomic and functional turnover in ecological communities. Global Ecol. Biogeogr. 31, 1399–1421.
Graham, C.H., Fine, P.V.A., 2008. Phylogenetic beta diversity: linking ecological and evolutionary processes across space in time. Ecol. Lett. 11, 1265–1277.
He, X., DuBay, S., Zhangshang, M., Cheng, Y., Liu, Z., Li, D., et al., 2022. Seasonal elevational patterns and the underlying mechanisms of avian diversity and community structure on the eastern slope of Mt. Gongga. Divers. Distrib. 28, 2459–2474.
Jetz, W., Thomas, G.H., Joy, J.B., Hartmann, K., Mooers, A.O., 2012. The global diversity of birds in space and time. Nature 491, 444–448.
Jiang, X., Pan, B., Jiang, W., Hou, Y., Yang, H., Zhu, P., et al., 2021. The role of environmental conditions, climatic factors and spatial processes in driving multiple facets of stream macroinvertebrate beta diversity in a climatically heterogeneous mountain region. Ecol. Indicat. 124, 107407.
Jonsson, B.G., 2001. A null model for randomization tests of nestedness in species assemblages. Oecologia 127, 309–313.
Körner, C., 2007. The use of 'altitude'in ecological research. Trends Ecol. Evol. 22, 569–574.
Kusumoto, B., Kubota, Y., Baselga, A., Gómez-Rodríguez, C., Matthews, T.J., Murphy, D.J., et al., 2021. Community dissimilarity of angiosperm trees reveals deep-time diversification across tropical and temperate forests. J. Veg. Sci. 32, e13017.
Leprieur, F., Albouy, C., De Bortoli, J., Cowman, P.F., Bellwood, D.R., Mouillot, D., 2012. Quantifying phylogenetic beta diversity: distinguishing between 'True' turnover of lineages and phylogenetic diversity gradients. PLoS One 7, e42760.
Liang, D., Pan, X., Luo, X., Wenda, C., Zhao, Y., Hu, Y., et al., 2021. Seasonal variation in community composition and distributional ranges of birds along a subtropical elevation gradient in China. Divers. Distrib. 27, 2527–2541.
Martínez-Santalla, S., Martín-Devasa, R., Gómez-Rodríguez, C., Crujeiras, R.M., Baselga, A., 2022. Assessing the nonlinear decay of community similarity: permutation and site-block resampling significance tests. J. Biogeogr. 49, 968–978.
McCain, C.M., 2009. Global analysis of bird elevational diversity. Global Ecol. Biogeogr. 18, 346–360.
Miklós, I., Podani, J., 2004. Randomization of presence-absence matrices: comments and new algorithms. Ecology 85, 86–92.
Millar, R.B., Anderson, M.J., Tolimieri, N., 2011. Much ado about nothings: using zero similarity points in distance-decay curves. Ecology 92, 1717–1722.
Mori, A.S., Isbell, F., Seidl, R., 2018. β-diversity, community assembly, and ecosystem functioning. Trends Ecol. Evol. 33, 549–564.
Morlon, H., Chuyong, G., Condit, R., Hubbell, S., Kenfack, D., Thomas, D., et al., 2008. A general framework for the distance-decay of similarity in ecological communities. Ecol. Lett. 11, 904–917.
Nekola, J.C., White, P.S., 1999. The distance decay of similarity in biogeography and ecology. J. Biogeogr. 26, 867–878.
Nekola, J.C., McGill, B.J., 2014. Scale dependency in the functional form of the distance decay relationship. Ecography 37, 309–320.
Perez Rocha, M., Bini, L.M., Domisch, S., Tolonen, K.T., Jyrkänkallio-Mikkola, J., Soininen, J., et al., 2018. Local environment and space drive multiple facets of stream macroinvertebrate beta diversity. J. Biogeogr. 45, 2744–2754.
Quintero, I., Jetz, W., 2018. Global elevational diversity and diversification of birds. Nature 555, 246–250.
Rahbek, C., Borregaard, M.K., Colwell, R.K., Dalsgaard, B., Holt, B.G., Morueta-Holme, N., et al., 2019. Humboldt's enigma: what causes global patterns of mountain biodiversity? Science 365, 1108–1113.
Ricotta, C., Laroche, F., Szeidl, L., Pavoine, S., 2020. From alpha to beta functional and phylogenetic redundancy. Methods Ecol. Evol. 11, 487–493.
Saito, V.S., Soininen, J., Fonseca-Gessner, A.A., Siqueira, T., 2015. Dispersal traits drive the phylogenetic distance decay of similarity in Neotropical stream metacommunities. J. Biogeogr. 42, 2101–2111.
Segre, H., Ron, R., De Malach, N., Henkin, Z., Mandel, M., Kadmon, R., 2014. Competitive exclusion, beta diversity, and deterministic vs. stochastic drivers of community assembly. Ecol. Lett. 17, 1400–1408.
Si, X., Baselga, A., Leprieur, F., Song, X., Ding, P., 2016. Selective extinction drives taxonomic and functional alpha and beta diversities in island bird assemblages. J. Anim. Ecol. 85, 409–418.
Si, X., Baselga, A., Ding, P., 2015. Revealing beta-diversity patterns of breeding bird and lizard communities on inundated land-bridge islands by separating the turnover and nestedness components. PLoS One 10, e0127692.
Si, X., Cadotte, M.W., Zhao, Y., Zhou, H., Zeng Di., Li, J., et al., 2018. The importance of accounting for imperfect detection when estimating functional and phylogenetic community structure. Ecology 99, 2103–2112.
Siefert, A., Ravenscroft, C., Weiser, M.D., Swenson, N.G., 2013. Functional beta-diversity patterns reveal deterministic community assembly processes in eastern North American trees. Global Ecol. Biogeogr. 22, 682–691.
Socolar, J.B., Gilroy, J.J., Kunin, W.E., Edwards, D.P., 2016. How should beta-diversity inform biodiversity conservation? Trends Ecol. Evol. 31, 67–80.
Soininen, J., Heino, J., Wang, J., 2018. A meta-analysis of nestedness and turnover components of beta diversity across organisms and ecosystems. Global Ecol. Biogeogr. 27, 96–109.
Soininen, J., Jamoneau, A., Rosebery, J., Passy, S.I., 2016. Global patterns and drivers of species and trait composition in diatoms. Global Ecol. Biogeogr. 25, 940–950.
Soininen, J., Lennon, J.J., Hillebrand, H., 2007. A multivariate analysis of beta diversity across organisms and environments. Ecology 88, 2830–2838.
Specht, H.M., Reich, H.T., Iannarilli, F., Edwards, M.R., Stapleton, S.P., Weegman, M.D., et al., 2017. Occupancy surveys with conditional replicates: an alternative sampling design for rare species. Methods Ecol. Evol. 8, 1725–1734.
Sreekar, R., Koh, L.P., Mammides, C., Corlett, R.T., Dayananda, S., Goodale, U.M., et al., 2020. Drivers of bird beta diversity in the Western Ghats-Sri Lanka biodiversity hotspot are scale dependent: roles of land use, climate, and distance. Oecologia 193, 801–809.
Steinbauer, M.J., Dolos, K., Reineking, B., Beierkuhnlein, C., 2012. Current measures for distance decay in similarity of species composition are influenced by study extent and grain size. Global Ecol. Biogeogr. 21, 1203–1212.
Svenning, J.C., Fløjgaard, C., Baselga, A., 2011. Climate, history and neutrality as drivers of mammal beta diversity in Europe: insights from multiscale deconstruction. J. Anim. Ecol. 80, 393–402.
Swenson, N.G., Anglada-Cordero, P., Barone, J.A., 2011. Deterministic tropical tree community turnover: evidence from patterns of functional beta diversity along an elevational gradient. Proc. R. Soc. B 278, 877–884.
Tello, J.S., Myers, J.A., Macía, M.J., Fuentes, A.F., Cayola, L., Arellano, G., et al., 2015. Elevational gradients in β-diversity reflect variation in the strength of local community assembly mechanisms across spatial scales. PLoS One 10, e0121458.
Tolmos, M.L., Kreft, H., Ramirez, J., Ospina, R., Craven, D., 2022. Water and energy availability mediate biodiversity patterns along an elevational gradient in the tropical Andes. J. Biogeogr. 49, 712–726.
Tuomisto, H., Ruokolainen, K., Yli-Halla, M., 2003. Dispersal, environment, and floristic variation of western Amazonian forests. Science 299, 241–244.
Vellend, M., Srivastava, D.S., Anderson, K.M., Brown, C.D., Jankowski, J.E., Kleynhans, E.J., et al., 2014 Assessing the relative importance of neutral stochasticity in ecological communities. Oikos 123, 1420–1430.
Villéger, S., Grenouillet, G., Brosse, S., 2013 Decomposing functional β-diversity reveals that low functional β-diversity is driven by low functional turnover in European fish assemblages. Global Ecol. Biogeogr. 22, 671–681.
Wang, J., Legendre, P., Soininen, J., Yeh, C., Graham, E., Stegen, J., et al., 2020. Temperature drives local contributions to beta diversity in mountain streams: stochastic and deterministic processes. Global Ecol. Biogeogr. 29, 420–432.
Wang, J., Soininen, J., Zhang, Y., Wang, B., Yang, X., Shen, J., 2012. Patterns of elevational beta diversity in micro- and macroorganisms. Global Ecol. Biogeogr. 21, 743–750.
Wang, X., Zhong, M., Yang, S., Jiang, J., Hu, J., 2022. Multiple β-diversity patterns and the underlying mechanisms across amphibian communities along a subtropical elevational gradient. Divers. Distrib. 28, 2489–2502.
Webb, C.O., Ackerly, D.D., McPeek, M.A., Donoghue, M., 2002 Phylogenies and community ecology. Annu. Rev. Ecol. Systemat. 33, 475–505.
Weinstein, B.G., Tinoco, B., Parra, J.L., Brown, L.M., McGuire, J.A., Stiles, F.G., et al., 2014. Taxonomic, phylogenetic, and trait beta diversity in South American hummingbirds. Am. Nat. 184, 211–224.
Wu, L., Si, X., Didham, R.K., Ge, D., Ding, P., 2017. Dispersal modality determines the relative partitioning of beta diversity in spider assemblages on subtropical land-bridge islands. J. Biogeogr. 44, 2121–2131.
Wu, Y., Colwell, R.K., Rahbek, C., Zhang, C., Quan, Q., Wang, C., et al., 2013. Explaining the species richness of birds along a subtropical elevational gradient in the Hengduan Mountains. J. Biogeogr. 40, 2310–2323.
Zellweger, F., Roth, T., Bugmann, H., Bollmann, K., 2017. Beta diversity of plants, birds and butterflies is closely associated with climate and habitat structure. Global Ecol. Biogeogr. 26, 898–906.
Zeng, C., Li, W., Ding, P., Peng, Y., Wu, L., Si, X., 2022. A landscape-level analysis of bird taxonomic, functional and phylogenetic β-diversity in habitat island systems. J. Biogeogr. 49, 1162–1175.
Zhao, Y., Sanders, N.J., Liu, J., Jin, T., Zhou, H., Lu, R., et al., 2021. β diversity among ant communities on fragmented habitat islands: the roles of species trait, phylogeny and abundance. Ecography 44, 1568–1578.
Zheng, Z.X., Li, D.H., Wang, Z.X., Wang, Z.Y., Jiang, Z.H., Lu, T.C., 1983. The Avifauna of Xizang. Science Press, Beijing.
Junjian Zhang, Xianghuang Li, Nyambayar Batbayar, et al. Exploring potential reasons for the increase in the East Asian Greylag Goose Anser anser population by assessing habitat use and use of protected areas. Bird Conservation International, 2023, 33
DOI:10.1017/S095927092200017X
2.
Baasansuren Erdenechimeg, Gankhuyag Purev-Ochir, Amarkhuu Gungaa, et al. Migration Pattern, Habitat Use, and Conservation Status of the Eastern Common Crane (Grus grus lilfordi) from Eastern Mongolia. Animals, 2023, 13(14): 2287.
DOI:10.3390/ani13142287
3.
Rui Ma, Shuo Ma, Xu Wei, et al. Tracking Migration of Eastern Spot-Billed Ducks Anas zonorhyncha and Mallards Anas platyrhynchos Wintering in Shanghai, China. Waterbirds, 2023, 45(4)
DOI:10.1675/063.045.0411
4.
Xin Yu, Ping Fan, Yun Wu, et al. GPS tracking data reveal the annual spatiotemporal movement patterns of Bridled Terns. Avian Research, 2022, 13: 100065.
DOI:10.1016/j.avrs.2022.100065
5.
Iderbat Damba, Junjian Zhang, Kunpeng Yi, et al. Seasonal and regional differences in migration patterns and conservation status of Swan Geese (Anser cygnoides) in the East Asian Flyway. Avian Research, 2021, 12(1)
DOI:10.1186/s40657-021-00308-y
6.
Fanjuan Meng, Xin Wang, Nyambayar Batbayar, et al. Consistent habitat preference underpins the geographically divergent autumn migration of individual Mongolian common shelducks. Current Zoology, 2020, 66(4): 355.
DOI:10.1093/cz/zoz056
7.
Ye Wang, Chunrong Mi, Yumin Guo. Satellite tracking reveals a new migration route of black-necked cranes (Grus nigricollis) in Qinghai-Tibet Plateau. PeerJ, 2020, 8: e9715.
DOI:10.7717/peerj.9715
8.
Ros M.W. Green, Niall H.K. Burton, Aonghais S.C.P. Cook. Migratory movements of British and Irish Common Shelduck Tadorna tadorna: a review of ringing data and a pilot tracking study to inform potential interactions with offshore wind farms in the North Sea. Ringing & Migration, 2019, 34(2): 71.
DOI:10.1080/03078698.2019.1887670

 DownLoad:


 Email Alerts
 RSS Feeds