Ministry of Education Key Laboratory of Ecology and Resource Use of the Mongolian Plateau & Inner Mongolia Key Laboratory of Grassland Ecology, School of Ecology and Environment, Inner Mongolia University, Hohhot, 010020, China
b.
Key Laboratory of Marine Biotechnology of Fujian Province, Institute of Oceanology, College of Marine Sciences, Fujian Agriculture and Forestry University, Fuzhou, 350002, China
c.
Key Laboratory of Zoological Systematics and Evolution, Institute of Zoology, Chinese Academy of Sciences, Beijing, 100101, China
d.
Laboratory of Island Biogeography and Conservation Biology, College of Life Sciences, Nanjing Normal University, Nanjing, 210023, China
Funds:
the Natural Science Foundation of Inner Mongolia, China2023JQ01
the National Key R & D Program of China2019YFA0607103
the Central Government Guides Local Science and Technology Development Fund Projects2022ZY0224
the Open Project Program of 'Ministry of Education Key Laboratory of Ecology and Resources Use of the Mongolian PlateauKF2023003
the Major Science and Technology Project of Inner Mongolia Autonomous Region: Monitoring, Assessment and Early Warning Technology Research of Biodiversity in Inner Mongolia2021ZD0011
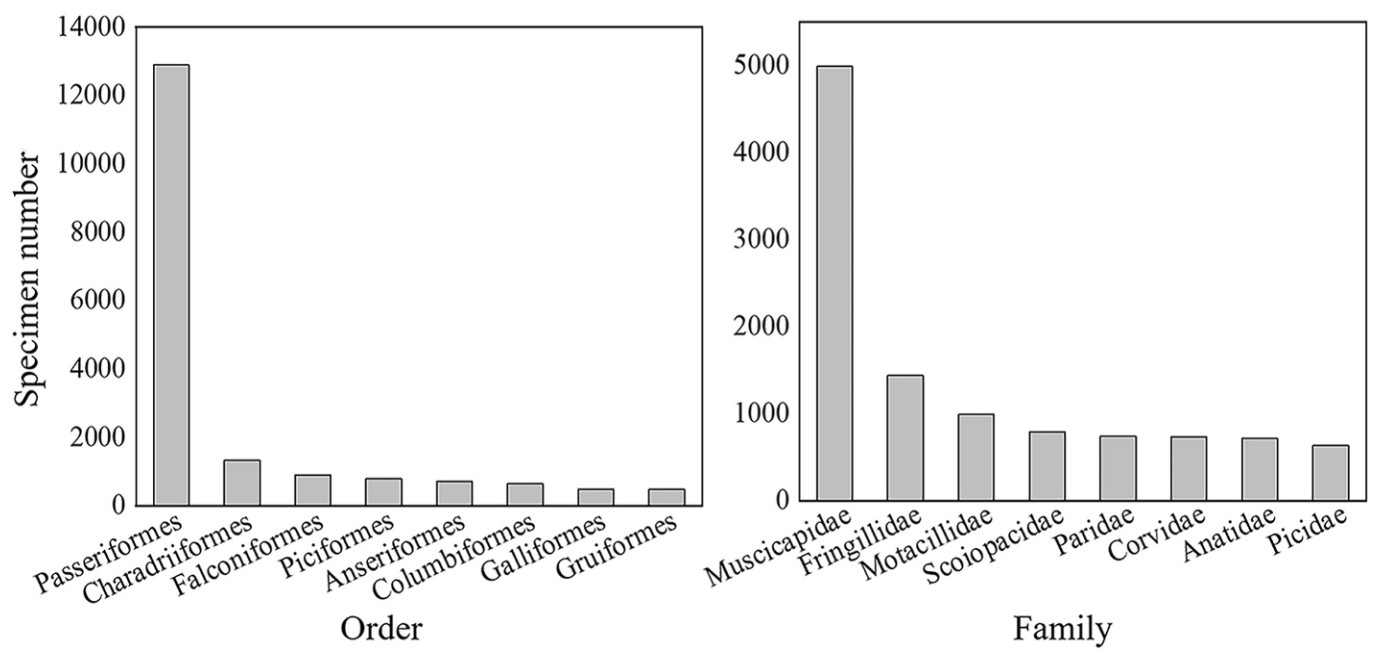
Biological specimens are fundamental for taxonomy and flora/fauna research. More importantly, they also play crucial roles in recording environmental impacts on morphology and behavior, which is vital for biodiversity research and conservation. However, there are few systematic studies on the patterns and drivers of bird specimen number at regional scales. This study is the first attempt to examine the relationships between bird specimen number and species traits as well as climate niche breadth in China, aiming to answer two questions: 1) how do species' temperature niche breadth and precipitation niche breadth influence specimen number? 2) which trait is most associated with bird specimen number? The associations between bird specimen number and explanatory variables were examined using ordinary least squares, generalized linear models, phylogenetic generalized linear mixed models, and multiple comparisons. The results showed that Muscicapidae was the family with the highest specimen number, and Passeriformes was the order with the highest specimen number. Bird specimen number significantly increased with larger temperature niche breadth and precipitation niche breadth. Specimen number was also positively associated with geographic range size, habitat specificity, hunting vulnerability and clutch size, but negatively associated with body size. These findings suggest that future bird specimen collection should pay more attention to birds with limited ecological niches, large body sizes, and small clutch sizes. This research enhances the use of bird specimen data to study and preserve biodiversity.
In the research of animal behavior, personality has been conceptualized to describe the consistent behavioral differences between individuals over time and across contexts (Dugatkin, 2013). From the long-standing traditional viewpoint, behavior is a plastic phenotypic trait that is reversible under various environmental conditions and has been optimized by individuals, depending on the associated costs and benefits with different decisions (Sih et al., 2004; Pigliucci, 2005; Royle and Hopwood, 2017). However, this traditional opinion is unable to explain why individuals who gain benefits by behaving actively in one context, such as mating (Oers et al., 2008; Scherer et al., 2017) or foraging (Bergvall et al., 2011), are likely to be active too in another context, such as the anti-predator scenario, in which activeness of an individual probably accompanies with higher cost, in terms of the risk of predation (Pascual and Senar, 2014; Toscano, 2017). Under these circumstances, personality becomes an alternative to demonstrate the intra-specific behavioral differences in the same environment (Réale et al., 2007; Dammhahn and Almeling, 2012). In recent years, more and more studies have uncovered evidences for the key role of personality in differentiating behavioral performance among conspecifics (Laskowski and Bell, 2014; Sih et al., 2015; Aliperti et al., 2021; Lou et al., 2021). Nevertheless, two questions, what is the genetic basis underlying a personality trait (Lamichhaney et al., 2016) and whether there is a correlation between a personality trait and individual reproductive success (Dingemanse et al., 2012), have not been well addressed.
In the past two decades, comparative transcriptome analysis has increasingly been proved a powerful tool in uncovering the genetic basis of animal behaviors (Schuster, 2008; Wang et al., 2011; Chen et al., 2012; Li et al., 2015), including personality traits (Mueller et al., 2013; Riyahi et al. 2015; Lamichhaney et al., 2016). For instance, in the Ruff (Philomachus pugnax), three lekking behaviors linking with three male morphs have been treated as a personality trait (Jukema and Piersma, 2006). Independent males have dark plumage and they form territory in courting females, satellite males have white plumage and they couple with an independent male in courting females, and faeder males have female-like plumage and they mimic a female in accessing the territory of independent males (Bachman and Widemo, 1999; Jukema and Piersma, 2006). By whole-genome sequencing, Lamichhaney et al. (2016) identified a 4.5-Mb inverted region in the satellite and faeder alleles that is different from the independent allele. This structural genomic change is considered to underlie the differences in male morphs and reproductive behaviors (Lamichhaney et al., 2016). This case study of ruff personality suggests that a comparison of gene expression between different forms of a personality trait can contribute to identify candidate genes regulating behavioral performances among conspecifics under the same environmental condition (van Oers et al., 2005).
The personality trait of boldness-shyness continuum has been frequently determined based on an individual’s reaction to perceived risks (Réale et al., 2010). Generally, bold individuals tend to take risks and are usually proactive to deal with the danger, whereas shier individuals are reluctant to take risks or even display new behavioral responses (Dugatkin, 2013). Behavioral syndrome investigations indicate that boldness is correlated with a suite of behaviors, such as aggressiveness and predator inspection (Sih et al., 2004), as well as various life-history strategies (Biro and Stamps, 2008; Smith and Blumstein, 2008). For example, bold males in the Wandering Albatross (Diomedea exulans) can fly a longer trip to forage and gain more food per trip, and hence they can realize higher reproductive success than their shier counterparts (Patrick and Weimerskirch, 2015). Bold Rainbowfish (Melanotaenia duboulayi) males are more aggressive in attaining the hierarchical position, which helps them access the resources in priority and realize higher reproductive success than shy males (Colléter and Brown, 2011). As reproductive strategies have long been considered a consequence trading off the environmental and individual conditions (Mueller et al., 1991; Hunt et al., 2005; et al., 2017; Gray et al., 2018), how to unify the effects of individual personality and tradeoff on a reproductive strategy becomes a new challenge to our understanding of the evolution of animal behavior.
To demonstrate the potential genetic basis underlying a personality trait and its relationship to individual reproductive success, we compared territorial behaviors, breeding parameters and differential expressed genes in the brain transcriptome between bold and shy breeders in three shrub-nesting birds, Azure-winged Magpie (Cyanopica cyanus, AM), White-collared Blackbird (Turdus albocinctus, WB) and Brown-cheeked Laughingthrush (Trochalopteron henrici, BL). The three species differ in life history traits (Ren et al., 2016; Li et al., 2020a, 2020b), including social organization (AM, colonial and cooperative breeding; WB and BL, solitarily and biparental breeding), yearly breeding cycles (AM, one; WB and BL, two), and clutch size patterns (AM and WB, fluctuant; BL, fixed). Nevertheless, they exhibit apparent consistency in their behaviors of parental care or territoriality. For example, parents in all species adopt the ‘brood reduction strategy’ in laying eggs, i.e., laying smaller eggs with their sequences, and ‘brood survival strategy’ in raising nestlings, i.e., provisioning younger nestlings more than their elder brood-mates (Da et al., 2018; Li et al., 2020a, 2020b). When predators approach their nest, adults in all species display dyadic responses: either defending against or fleeing from the intruders (Li et al., 2020a). The differences in life history traits whilst similarity in adult behaviors among the three species provide a good chance to compare both the causes and effects of a personality trait across species.
In this study, we first identified bold and shy breeders from the study population of AM, WB and BL, respectively, according to the repeatability of an individual responding to a territorial intruder. Then, we compared the fleeing distances, fecundity, fledging number and nesting success between bold and shy breeders across species to test whether there was a correlation between a personality trait and individual reproductive success. Finally, we identified differential expressed genes from the brain transcriptome of bold and shy breeders to test whether different species might share the same genetic basis regarding the boldness-shyness personality.
2.
Materials and methods
2.1
Study areas and species
Breeding ecology of AM was studied in Luqu County, Gansu Province, China (34.6° N, 102.5° E, elevation 3400 m), and that of WB and BL was studied in Linzhi City, Tibet Autonomous Region of China (29°40′ N, 94°20′ E, elevation 2900 m) during 2015–2018. These two regions have similar phenological characteristics (annual average temperature and precipitation being 8.7 ℃ and 688 mm for Linzhi City, and 2.3 ℃ and 680 mm for Luqu County). In Luqu County, AM construct their nests mainly in the shrubs of Hippophae rhamnoides and Salix caprea, while in Linzhi City, WB and BL construct their nests mainly in the Chuan-Dian Alpine Oak (Quercus aquifolioides).
2.2
Collection of reproduction data in the field
The collection of reproduction data was carried out between April and July, starting by systematically searching for active nests in a study area. For each located nest, three types of data were collected. The first included the laying sequence of each egg and hatching sequence of each nestling. The second was numeric that included clutch size, brood size, and fledgling number. The last was size-dependent that included the length and width of a fresh egg, body weight of a nestling at the hatching date or any other ages when it was checked during the nestling period (Ren et al., 2016; Li et al., 2020a, 2020b). The laying sequence of an egg was marked on its eggshell, and the hatching sequence of a nestling was marked on its head to facilitate individual identification.
In this study, we used clutch size as an index of fecundity of a social pair, and fledgling number as the index of their reproductive success. If a nest fledged at least one offspring, it was treated a case of nesting success. In AM, the reduced number of offspring was caused mainly by conspecific nest-raiding (Ren et al., 2016); therefore, cases of hatching failure of eggs or starvation of nestlings were excluded in subsequent analysis. In WB and BL, the reduced number of offspring was caused mainly by starvation of nestlings (Li et al., 2020a, 2020b). In all the three species, the failure of an entire clutch was caused mainly by nest predation of predators (Ren et al., 2016; Li et al., 2020a, 2020b).
Adults were captured using a non-destructive method, during which two strings, each with eight scalable loops woven with horsetail hair, were crisscrossed above a nest (Ren et al., 2016). An adult could be trapped by the loop when it approached the nest edge to provision nestlings. To reduce the effect of adult capture on heat preservation of nestlings, parents were trapped after nestlings reached ten-day age and individual personality had been exactly identified. The capture procedure caused no negative effects on the provisioning behaviors of adults and no case of nest desertion was recorded in these shrub-nesting species because of adult capture (Ren et al., 2016; Li et al., 2020a, 2020b).
2.3
Territorial behaviors of bold and shy breeders across species
Adults in each of the three shrub-nesting species exhibited two behavioral responses to an intruder (a predator or a researcher) of their territory, either impelling or fleeing from the intruder. As a colonial-nesting species, AM usually mobbed the territorial intruder by evoking the same responses of neighbors (Ren et al., 2016). As a solitarily-breeding species, WB or BL would expel the intruder alone (Li et al., 2020a, 2020b).
The personality type of a breeder was determined even since the first nestling hatched in one nest, according to its response to a researcher that slowly approached its nest. If it shortened the distance to the intruder, and gave alarm calls or attacked the intruder, this individual was classified as boldness personality; if it extended its distance to the intruder, i.e., fleeing from the intruder, it was regarded as shyness personality (Li et al., 2020a). To test whether an individual made consistent response to the intruder across time, the procedure of personality classification was repeated in five successive days (between 10:00 and 11:00 a.m. every day). Only when an individual exhibited the same response in all five observations could it be exactly determined to exhibit boldness or shyness personality. Two researchers engaged in the classification of individual personality, the researcher that acted as the territorial intruder wore the same clothes in the five days, another researcher that conducted behavioral observation stayed 20 m away from the scenario. In most cases (124 of 158 AM pairs, 53 of 56 WB pairs, and 47 of 59 BL pairs), both sexes of a breeding pair exhibited the same personality type. Breeding pairs with mixed personality types were excluded in subsequent analysis.
The fleeing distances between bold and shy individuals were compared in the three species separately. Since only shy individuals would flee from an intruding researcher, their fleeing distances were estimated by the researcher that conducted behavioral observation, while the fleeing distances of bold individuals were recorded as zero.
2.4
Transcriptome analyses of bold and shy individuals
Some breeders, of whom the personality types had been exactly identified, were sampled in this study for the subsequent transcriptome analysis. Six individuals for each personality type from AM (four males and two females), and three individuals for each personality type from WB or BL (two males and female), respectively, were sampled in this study. According to Schurch et al. (2016), at least six biological replicates should be used per group in genome-wide differential gene expression experiments, such as the comparative transcriptome analysis. However, if there is a high breadth of coverage, a minimum 2–3 replicates are enough. Due to the lacking of reference genome for each of the three species, we cannot estimate the breadth of coverage directly. Alternatively, we selected to increase the sequencing depth of each transcriptome. Although sequencing depth cannot enhance the breadth of coverage absolutely, it to some extent can ensure a certain coverage (Clark et al., 2011; Sims et al., 2014), so that the requirement in comparative transcriptome analysis can be fulfilled. Moreover, as we compared the transcriptome between bold and shy individuals in multiple species, the total number of replica for either the boldness or shyness personality type reached ten. These ways can to the greatest extent ensure both the quantity and quality of sequencing results to be fulfilled in this comparative transcriptome analyses across species.
Captured adults were killed by asphyxiation immediately after they were transported to the laboratory. The brain tissue was immediately sampled by cutting open the parietal bone with sterilized surgical scissors. The brain tissue was cut into 1-mm pieces and stored at −80 ℃ in an RNA-protective solution (Sangon Biotech Co. Ltd., Shanghai, China) pending transcriptome analysis.
Transcriptome analysis for each sample was performed by Novogene (Beijing, China). About 3-μg total RNA was extracted from each sample (RNA simple kit, Tiangen Biotech Co. LTD, Beijing, China), which was used as input material for RNA analysis. The mRNA was purified from total RNA by Poly-T oligo-attached magnetic beads and then sequenced using NEBNext Ultra RNA Library Prep Kit for Illumina (New England BioLabs LTD. (NEB), Beijing, China), following the manufacturer’s recommendations. Index codes were added to attribute sequences to each sample. First strand cDNA was synthesized in NEBNext First Strand Synthesis Reaction Buffer using a random hexamer primer and M-MuLV Reverse Transcriptase (RNase H−). Second strand cDNA synthesis was subsequently performed using DNA Polymerase I and RNase H. Remaining overhangs were converted into blunt ends by exonuclease/polymerase activities. After adenylation of the 3′ ends, the DNA fragments were ligated, using a NEBNext Adaptor with a hairpin loop structure, to prepare them for hybridization. The library fragments were purified with AMPure XP system (Beckman Coulter, Inc., S. Kraemer Boulevard Brea, CA, USA) to preferentially select 150–200 bp long cDNA fragments. Then, 3 μL of USER Enzyme (NEB) was added to the size-selected, adaptor-ligated cDNA and incubated at 37 ℃ for 15 min, followed by 5 min at 95 ℃, before performing PCR. PCR was performed with Phusion High-Fidelity DNA polymerase, Universal PCR primers, and Index (X) Primer. The PCR products were purified (AMPure XP system), and the library quality was assessed on the Agilent Bioanalyzer 2100 system (NYSE: A, Palo Alto, CA, USA).
Clustering of the index code samples was performed on a cBot Cluster Generation System (Illumina), using TruSeq PE Cluster Kit v3-cBot-HS, according to the manufacturer’s instructions. After cluster generation, the library preparations were sequenced on a HiSeq 2000 platform (Illumina) to generate paired-end reads (raw reads). By removing the adapter or poly-N and low-quality reads, clean reads were obtained. The Q30 and sequence duplication level were calculated for the clean reads. All downstream analyses were performed on the high-quality clean data.
The de novo assembly was performed using the software Trinity (Version, 20140717; Grabherr et al., 2011), with min_kmer_cov being set to 2. The assembled sequences were compared against the NCBI non-redundant protein database (Nr), NCBI non-redundant nucleotide database (Nt), Swiss-Prot database, and euKaryotic Ortholog Groups (KOG) database using NCBI BLAST (Version 2.2.28). The e-value of Nr, Nt, and Swiss_Prot was 1e-5, and the e-value of KOG was 1e-3. We used the package HMMER (Version 3.0; http://hmmer.org) to blast the sequences against Pfam (Finn et al., 2014).
Gene Ontology (GO) annotation was performed using the Blast2Go software (Version 2.5.0; Götz et al., 2008), after importing the Nr and Pfam BLAST results. The Kyoto Encyclopedia of Genes and Genomes (KEGG) annotation was performed using the KEGG Automatic Annotation Server (Kanehisa et al., 2008).
2.5
Identifying DEGs between bold and shy individuals across species
The assembled transcriptomes performed by Trinity were used as a reference, and the clean reads of each sample were mapped against the respective reference. Bowtie2|/|RSEM (Version 1.2.0; Li and Dewey, 2011) was used to quantify mapped reads, which were then normalized by the FPKM (fragments per kb per million reads) method to identify DEGs between samples from bold and shy individuals. Read counts of the sequenced libraries were adjusted by the edgeR program (Version 3.0.8; Robinson et al., 2010) through a normalized scaling factor before DEGs analysis.
Correlation analysis between the gene expression levels of pairwise samples was conducted, aiming to test the reliability of a sample being treated as a biological replicate. In this study, samples with Pearson correlation coefficient less than one to other samples were excluded in the subsequent DEG identification (two males in AM, one male in WB or BL). DEGs between samples from bold and shy personality types in each of the three species were identified by the R package of DESeq (Anders and Huber, 2010). For samples with biological replica, DESeq will adjust the P-value by controlling for the mean read count in different biological replicas that contain the same gene using the Benjamini and Hochberg’s approach (Benjamini and Hochberg, 1995). Genes with an adjusted P-value (Padj) < 0.05 were considered to be differentially expressed between samples of bold and shy personality types.
GO enrichment analysis of the DEGs was done with the GOseg R packages (Version 1.10.0; Young et al., 2010) based on the Wallenius’ non-central hyper-geometric distribution, which can control for gene length bias in DEGs. Statistical enrichment of DEGs in KEGG pathways was tested using the KOBAS software (Version 2.0; Mao et al., 2005). We compared the DEGs according to their gene ID based on the annotation results in the above Database to identify genes that might be tightly linked to the personality traits in the different species. DEGs identified between bold and shy individuals in the three species were compared across species using the VennDiagram R package (V1.6.20; https://www.rdocumentation.org/packages/VennDiagram).
2.6
Statistical analysis
The fleeing distance of shy individuals was compared among the three species using one-way ANOVA. We did not compare the fleeing distance of bold individuals because they all displayed expelling behaviors towards the intruding researcher; consequently, their fleeing distance was recorded as zero.
Generalized linear models (GLM) were fitted to compare the fecundity (indexed by clutch size, Poisson distribution), fledgling number (indexed by fledgling number, Poisson distribution) and nesting success (binomial variable) between bold and shy breeders in the three species separately. As it was difficult for us to capture the adults of WB and BL that had been identified the personality type in this study, we did not obtain the data about body conditions of most adults of WB and BL. To maintain consistency in organizing the predictable variables among the three species, we only introduced the personality type and year (factorial variables) as explanatory variables in the models. Three breeding parameters and the number of reduced offspring were compared between bold and shy individuals using independent sample t-test.
All statistical analyses were carried out using SPSS (Version 27.0). Descriptive results are presented as mean ± standard error of the mean (SEM). The null hypothesis was rejected when P < 0.05.
2.7
Ethical note
Procedures of adult capture and sample in this study were complied with the ethical requirements and agreed by the Ethics Committee Lanzhou University (No. EAF2015001, EAF2017005, EAF2020002) and by the permission of Tibetan Forestry Department (2016ZR-NY-05). To minimize the influence of adult removal on the survival of nestlings, only one sex of a breeding pair was sampled and the capturing procedure was conducted two days before the expected fledging of offspring (Li et al., 2020b).
3.
Results
3.1
Different territorial behaviors between bold and shy breeders
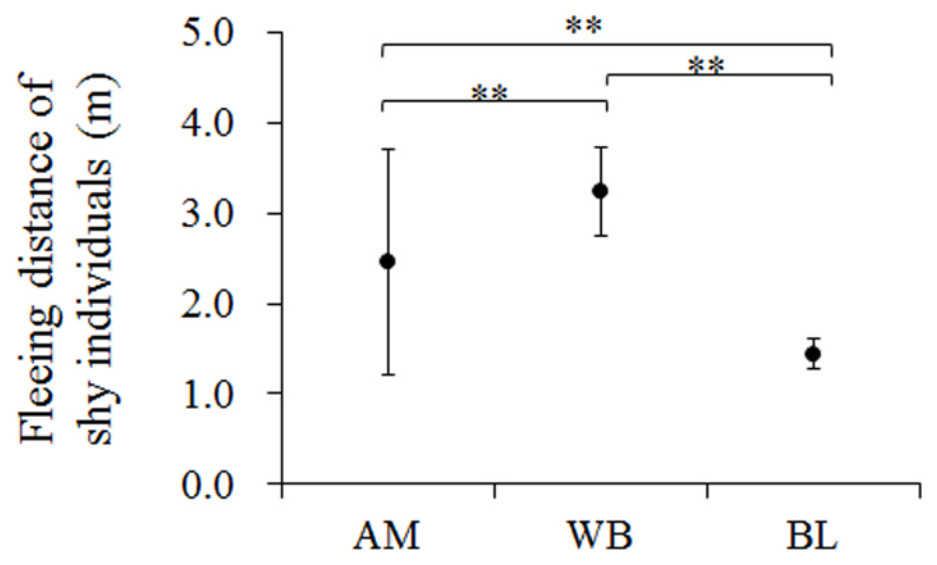
Individuals in the three species exhibited high repeatability during the process of classifying their personality. Bold individuals all displayed expelling behaviors towards the intruding researcher in five successive days, i.e., fleeing distance was zero (Table 1). Regarding shy individuals, they escaped from the intruding researcher at different distances (Table 1), indicating that bold individuals exhibited more aggressiveness towards the intruder than did shier individuals. The fleeing distance of shy individuals differed significantly among the three species, with WB had the longest fleeing distance whereas BL had the shortest fleeing distance (Fig. 1; F2,85 = 27.34, P < 0.001).
Table
1.
Fleeing distances of bold and shy individuals to an intruding researcher in the three shrub-nesting species (Azure-winged Magpie, AM; White-collared Blackbird, WB; and Brown-cheeked Laughingthrush, BL).
Figure
1.
Comparison of the fleeing distance of shy individuals in three shrub-nesting species. AM, Azure-winged Magpie; WB, White-collared Blackbird; BL, Brown-cheeked Laughingthrush.
3.2
Different reproductive success between bold and shy breeders
Results of fitting of GLMs indicated that the effect of personality on individual breeding parameters in AM differed significantly from that in WB or BL (Table 2). In the Azure-winged Magpie, personality type affected a breeder’s fledgling number significantly (P = 0.03) but did not affect its clutch size (P = 0.36) or nesting success (P = 0.40; Table 2). In the White-collared Blackbird and Brown-cheeked Laughingthrush, personality type exhibited no significant effect on a breeder’s clutch size (both P ≥ 0.36), fledgling number (both P ≥ 0.45) or nesting success (both P ≥ 0.37). In all the three species, individual breeding parameters did not differ between different years (Table 2).
Table
2.
Results of fitting generalized linear models to compare the breeding parameters between bold and shy individuals in the three shrub-nesting species (Azure-winged Magpie, AM; White-collared Blackbird, WB; Brown-cheeked Laughingthrush, BL. SE, standard error; SD, standard deviation).
Model parameters
AM
WB
BL
β ± SE (n)
P
β ± SE (n)
P
β ± SE (n)
P
Clutch size (Poisson distribution)
Intercept
−12.72 ± 77 (124)
0.87
153 ± 331 (53)
0.64
260 ± 379 (47)
0.49
Personality*
−0.08 ± 0.08 (124)
0.36
0.16 ± 0.17 (53)
0.36
0.07 ± 0.18 (47)
0.70
Year
0.01 ± 0.04 (124)
0.85
−0.08 ± 0.16 (53)
0.65
−0.13 ± 0.19 (47)
0.49
Fledgling number (Poisson distribution)
Intercept
3.63 ± 103 (93)
0.97
405 ± 545 (23)
0.46
126 ± 563 (24)
0.82
Personality*
−0.26 ± 0.11 (93)
0.03
0.21 ± 0.27 (23)
0.45
0.18 ± 0.27 (24)
0.51
Year
−0.004 ± 0.05 (93)
0.99
−0.20 ± 0.27 (23)
0.46
−0.06 ± 0.28 (24)
0.82
Nesting success (binomial distribution)
β ± SD (n)
P
β ± SD (n)
P
β ± SD (n)
P
Intercept
−0.51 ± 0.48 (124)
0.29
0.01 ± 0.44 (53)
0.98
−0.06 ± 0.55 (47)
0.91
Personality*
0.45 ± 0.53 (124)
0.40
−0.56 ± 0.62 (53)
0.37
−0.08 ± 0.59 (47)
0.89
Year
−1.52 ± 0.82 (124)
0.06
1.26 ± 0.61 (53)
0.91
0.11 ± 0.60 (47)
0.85
Note: *Data of bold individuals were set as the baseline.
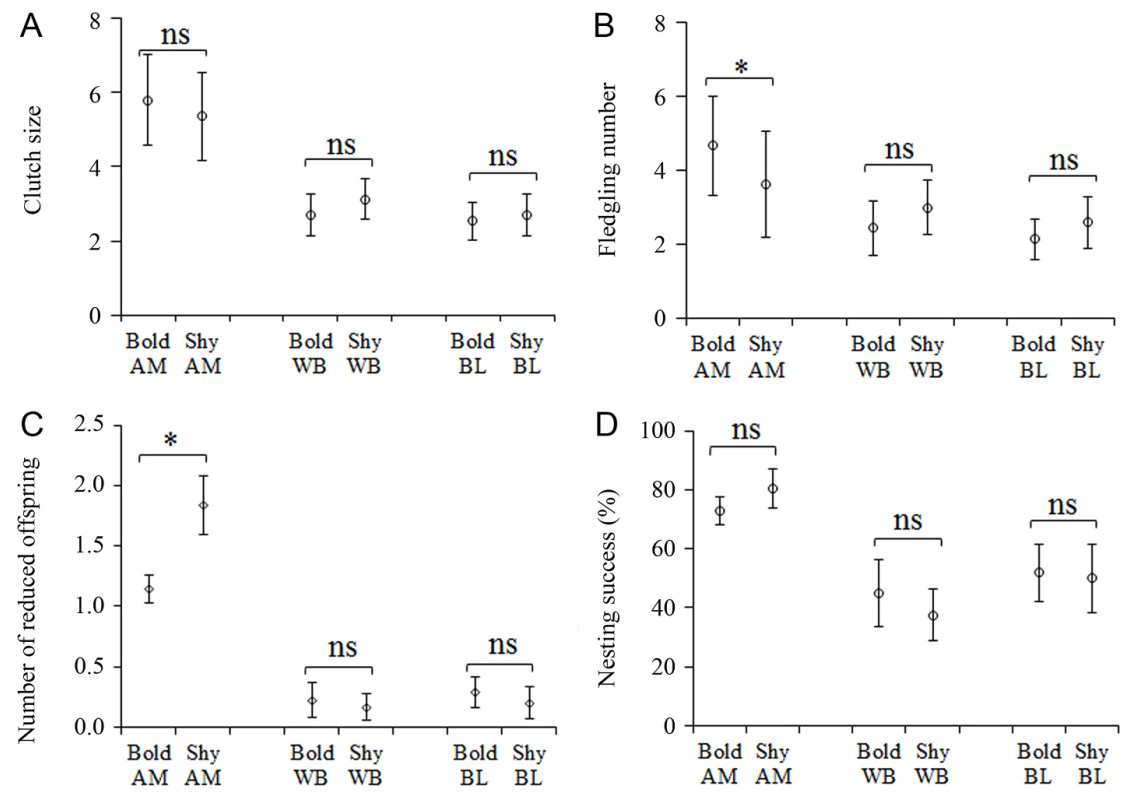
Bold breeders in all the three species produced the same amount of offspring to their shier counterparts at the beginning of a breeding attempt (Fig. 2A); however, only in the Azure-winged Magpie that bold breeders had fledged more offspring than did shier breeders (P = 0.001; Fig. 2B). The number of reduced offspring of bold breeders was significantly lower than that of shy breeders in AM (P = 0.005) but not in WB (P = 0.763) and BL (P = 0.650) (Fig. 2C). Although bold breeders displayed aggressiveness towards the intruding predators that conducted nest predation, they did not realize significantly higher nesting success than did shier breeders in all the three species (Fig. 2D).
Figure
2.
Comparison between bold and shy breeders in their clutch size (A), fledgling number (B), the number of reduced offspring (C), and nesting success (D). AM, Azure-winged Magpie; WB, White-collared Blackbird; BL, Brown-cheeked Laughingthrush. Stars mean significant level; ns, not significant.
3.3
DEGs identified between bold and shy breeders across species
After removing the amplification adapters and ambiguous reads, the total number of clean reads in the three species ranged between 89–226 million. The clean bases ranged between 13.41–31.42G, with Q30 values being higher than 90% and sequencing error being less than 0.02% (Table 3). Sequencing depth of one personality type was estimated based on the averaged C-value of birds yet studied in their respective family of each species (Corvidae, 1.29; Turdidae, 1.43; Muscicapidae, 1.30) because the C-value of each of the three species has not been reported. The sequencing depth of three species were all greater than 10 (ranging 10.2–24.4; Table 3).
Table
3.
Parameters estimation of the sequencing result in the Azure-winged Magpie, White-collared Blackbird, and Brown-cheeked Laughingthrush.
Parameters
Clean reads
Clean bases
Q30 (%)
Error (%)
aSequencing depth
Sequencing result in the Azure-winged Magpie
Boldness
225,964,098
31.42
92.35
0.02
24.4×
Shyness
216,722,096
30.14
96
0.02
23.4×
Sequencing result in the White-collared Blackbird
Boldness
97,144,886
14.58
93.41
0.01
10.2×
Shyness
98,765,546
14.81
93.36
0.01
10.4×
Sequencing result in the Brown-cheeked Laughingthrush
Boldness
92,029,054
13.80
93.26
0.01
10.6×
Shyness
89,426,204
13.41
93.04
0.01
10.3×
a Note: Data of C-values for bird species of each family yet studied were obtained from http://www.genomesize.com.
Currently, there is no reference genome for any of the three species. Therefore, we assembled a de novo transcriptome for each species. This was used as a reference for read mapping and brain gene expression profiling. Gene function was annotated based on the following databases: Nr, Nt, KO, Swiss-Prot, Pfam and GO. In total, 291,387 genes in AM, 232,315 genes in WB, and 172,933 genes in BL were annotated in these databases (Table 4).
Table
4.
The number and percentage of Unigenes that had been annotated in current databases for the Azure-winged Magpie (AM), White-collared Blackbird (WB), and Brown-cheeked Laughingthrush (BL).
By comparing the expression amount of genes between bold and shy individuals in each species, we detected 578 DEGs in AM, 76 DEGs in WB, and 134 DEGs in BL, with the datasets submitted to the DRYAD platform (https://doi.org/10.5061/dryad.3xsj3txnx). Compared to shy individuals, bold individuals had 276 down-regulated and 302 up-regulated genes in AM, five down-regulated and 71 up-regulated genes in WB, and 121 down-regulated and 13 up-regulated genes in BL.
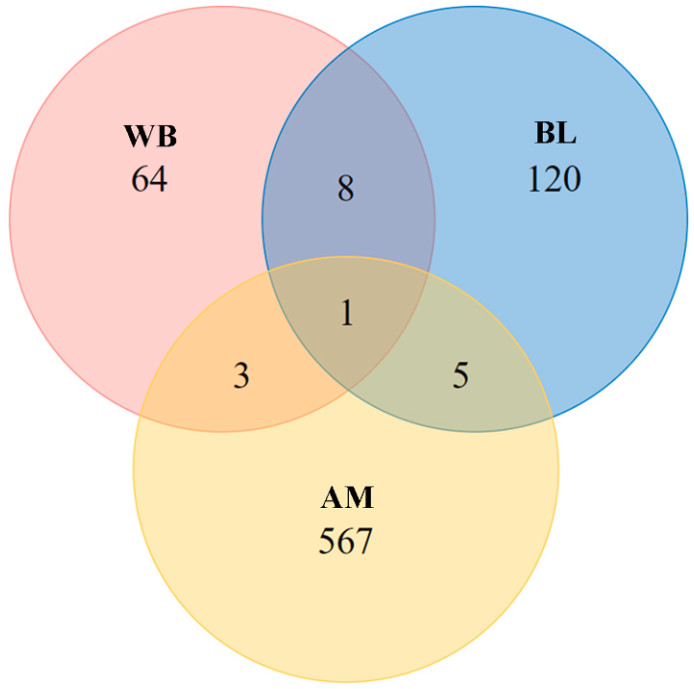
Cross-species comparison of DEGs revealed that AM and WB shared four DEGs, AM and BL shared five DEGs, and WB and BL shared nine DEGs; with only one gene, crabp1, being shared by all the three species (Fig. 3). This gene was up-regulated in bold individuals relative to in shy individuals in all the three species (Table 5), indicating that bold breeders contained more product of the crabp1 gene than their shier counterparts.
Figure
3.
Venn diagram showing unique and shared DEGs between bold and shy individuals in Azure-winged Magpie (AM), White-collared Blackbird (WB) and Brown-cheeked Laughingthrush (BL). (For interpretation of the references to colour in this figure legend, the reader is referred to the Web version of this article.)
The present study addressed two pending questions about animal personality, the potential genetic basis of a personality trait and its correlation with individual phenotypes, based on a cross-species comparison of behaviors, breeding parameters and differential expressed genes in the brain transcriptome between bold and shy breeders. Our findings suggest that boldness-shyness personality may have the same genetic basis across species, which can explain why bold individuals exhibited aggressive territorial behaviors towards an intruder whereas shy individuals did not. Nevertheless, aggressiveness in nest defence exhibited distinct correlation with individual reproduction among different species, highlighting the role of life history style in determining the correlation of a personality trait with individual reproductive success.
By comparing the brain transcriptome between bold and shy breeders across species, we found that the crabp1 gene was up-regulated in bold individuals relative to in their shier counterparts in all the three species. This gene encodes the cellular retinoic acid (RA)-binding protein 1 (CRABP1) that can decrease cellular response to RA (Zetterström et al., 1999). RA is an important regulatory protein in the corticotropin-releasing hormone (CRH) secretion pathway (Lin et al., 2017). It can directly bind to a nuclear receptor, the retinoic acid receptor-α (RAR-α), to up-regulate the expression of the CRH gene in the hypothalamus (Chen et al., 2009; Horton et al., 2014). The CRH gene plays a crucial role in animals' response to external stresses by promoting the hypothalamic-pituitary-adrenal axis activity (Bissette, 2018), which increases the behavioral repertoire associated with anxiety and fear under stressful conditions, and simultaneously, inhibits exploratory and sexual behaviors (Habib et al., 2000). In the three shrub-nesting birds, as the crabp1 gene is up-regulated in bold relative to in shier breeders (Table 5), bold individuals are expected to have a lower level of CRH. Therefore, they display more proactive behaviors, i.e., being more aggressive, than shier individuals in defending against an intruder of their territory. This result suggests that the crabp1 gene may be one of the genetic basis underlying the different aggressiveness in defending against a territorial intruder between bold and shy individuals.
Personality variation resulting in different fitness consequences between individuals has been documented in diverse animal taxa (Both et al., 2005; Smith and Blumstein, 2008; Réale et al., 2009). One common explanation for the effect of a personality trait is that individuals with distinct personality types have displayed different strategies in contesting limited resources, such as food and potential mate (Robinson et al., 2010b; Mowles, 2014). In the present study, neither the fecundity (Fig. 2A) nor nesting success (Fig. 2D) exhibited significant differences between bold and shy breeders in the three species. This finding indicates that, on the one hand, the opportunity of accessing resources may be equal for bold and shy breeders; on the other hand, aggressiveness could not benefit a bold individual in a scenario of anti-predator in these shrub-nesting species. As a colonial-nesting and cooperatively-breeding species, Azure-winged Magpies rarely exhibit contest behaviors over food or mates (Ren et al., 2016). As a biparental species that construct their nests in a disperse pattern, the nesting densities of White-collared Blackbird and Brown-cheeked Laughingthrush are so low that there is plentiful supply of food for all breeders in our study area (Li et al., 2020a, 2020b). Therefore, it seems that neither bold nor shy breeders in the three species had experienced resource scarcity, hence their fecundity exhibited no differences. In an antipredator context, although bold breeders displayed expelling behaviors towards the natural predators, it is actually difficult for them to prevent predators from preying upon eggs or chicks (Ren et al., 2016), particularly when predators are cats or raptors (Li et al., 2020a). As a result, bold breeders have obtained no benefits from their aggressiveness, in terms of enhancing the nesting success in the scenario of defending against predators.
The numbers of fledglings or reduced offspring differed significantly between bold and shy breeders in the Azure-winged Magpie but not in White-collared Blackbird and Brown-cheeked Laughingthrush (Fig. 2B and C), highlighting the role of life history style in determining the effect of personality on individual reproductive success. In the Azure-winged Magpie, conspecific nest-raiding is the main reason for partial reproductive failure (Ren et al., 2016). The aggressive expelling behaviors executed by bold breeders can evoke the same responses of neighbors to the raider (Da et al., 2018). Therefore, bold breeders can benefit from their aggressiveness, in terms of the reduced probability of being raided by conspecifics. By contrast, shy breeders that do not display expelling behaviors towards the raider have to take higher risk of being raided (Ren et al., 2016). Different aggressiveness in the context of conspecific nest-raiding is the main reason to explain why bold breeders of the Azure-winged Magpie could realize higher reproductive success than their shier counterparts.
5.
Conclusions
Compared with most current studies of comparative transcriptome analyses that are carried out on single species, the method of cross-species comparison could screen out candidate genes more quickly. By this way, we uncovered that the up-regulation of crabp1 gene may be an important mechanism resulting in higher aggressiveness in bold than in shier individuals in the scenario of nest defence. However, a personality trait may be unable to directly influence individual reproductive success. Its effect to a great extent depends on the life history style of the studied species.
The ethical permits for life history data collection and individual sampling were issued by the Tibetan Forestry Department (2016ZR-NY-05) and the Ethical Committee of School of Life Sciences, Lanzhou University (EAF2020002, EAF2021020). All works in the field were carried out under the Wildlife Conservation Law of the Thirteenth National People’s Congress of China (20170101, 20181026).
CRediT authorship contribution statement
Jianchuan Li: Writing – original draft, Funding acquisition. Wen Zhang: Writing – original draft, Methodology, Formal analysis, Data curation. Ningning Sun: Methodology. Yujie Wang: Methodology. Lifang Gao: Writing – original draft, Methodology. Ran Feng: Methodology. Liqing Fan: Methodology, Funding acquisition. Bo Du: Writing – review & editing, Funding acquisition, Conceptualization.
Declaration of competing interest
All authors declare no conflicts of interest to any other organization bodies.
Acknowledgements
We thank Mengmeng Guan, Shijie Bao, Qingmiao Ren, Guoliang Chen, Xinwei Da, Haiyang Zhang, Lili Xian, Juanjuan Luo, Zhenqin Zhu, Xiaodan Zhang, Fangyuan Liu and Qian Wang for their assistance in the collection of demographic and behavioral data in the field. Authors are very grateful for two anonymous reviewers and the editors for their valuable comments that helped us greatly in improving the expression and writing of our paper.
Altrichter, M., 2006. Wildlife in the life of local people of the semi-arid Argentine Chaco. Biodivers. Conserv. 15, 2719-2736.
Alerstam, T., Högstedt, G., 1982. Bird migration and reproduction in relation to habitats for survival and breeding. J. Avian Biol. 13, 25-37. .
Angert, A.L., Crozier, L.G., Rissler, L.J., Gilman, S.E., Tewksbury, J.J., Chunco, A.J., 2011. Do species' traits predict recent shifts at expanding range edges? Ecol. Lett. 14, 677-689. .
Baker, David J, Maclean, Ilya, MD, Goodall, Martin, Gaston, Kevin J, 2022. Correlations between spatial sampling biases and environmental niches affect species distribution models. Glob. Ecol. Biogeogr. 31 (6), 1038–1050.
Balmori, A., 2019. Endangered bird mortality by gunshots: still a current problem. Biodivers. Conserv. 28, 2555-2564. .
Barrowclough, G. F, Cracraft, J., Klicka, J., Zink, R.M., 2016. How many kinds of birds are there and why does it matter? PLoS One 11, e0166307. .
Bonier, F., Martin, P.R., Wingfield, J.C., 2007. Urban birds have broader environmental tolerance. Biol. Lett. 3, 670-673. .
Borchtchevski, V.G., 2017. Does beginning of spring represent a critical period in annual cycle of capercaillie (Tetrao urogallus, Tetronidae, Galliformes)? Biol. Bull. 44, 751-760. doi: ISSN:1062-3590.
Boucher-Lalonde, V., Currie, D.J., 2016. Spatial autocorrelation can generate stronger correlations between range size and climatic niches than the biological signal—a demonstration using bird and mammal range maps. PLoS One 11, e0166243. .
Boutan, E., 1993. Le nuage et la Vitrine: Une vie de Monsieur David. Editions R, Chabaud.
Bowler, D.E., Heldbjerg, H., Fox, A.D., O'Hara, R.B., Böhning‐Gaese, K., 2018. Disentangling the effects of multiple environmental drivers on population changes within communities. J. Anim. Ecol. 87, 1034-1045. https://www.jstor.org/stable/2461494.
Brown, J.H., 1984. On the relationship between abundance and distribution of species. Am. Nat. 124, 255-279. .
Buckley, L.B., Kingsolver, J.G., 2012. Functional and phylogenetic approaches to forecasting species' responses to climate change. Annu. Rev. Ecol. Evol. Syst. 43, 205-226. https://www.jstor.org/stable/23323132.
Burton, A.C., 2012. Critical evaluation of a long-term, locally-based wildlife monitoring program in West Africa. Biodivers. Conserv. 21, 3079-3094. doi: https://doi.org/ .
Ceballos, G., Ehrlich, P.R., Barnosky, A.D., García, A., Pringle, R.M., Palmer, T.M., 2015. Accelerated modern human–induced species losses: entering the sixth mass extinction. Sci. Adv. 1, e1400253.
Chen, C.W., Zeng, D., Zhao, Y.H., Wu, Y.R., Xu, J.F., Wang, Y.P., 2019. Correlates of extinction risk in Chinese endemic birds. Avian Res. 10, 8. .
Coetzee, B.W.T., Chown, S.L., 2016. Land‐use change promotes avian diversity at the expense of species with unique traits. Ecol. Evol. 6, 7610-7622. .
Cohen, A.S., Johnston, M.R., 1987. Speciation in brooding and poorly dispersing lacustrine organisms. Palaios 2, 426-435. .
Collen, B., McRae, L., Deinet, S., De Palma, A., Carranza, T., Cooper, N., et al., 2011. Predicting how populations decline to extinction. Philos. Trans. R. Soc. B 366, 2577-2586. .
Cotgreave, P., 1994. The relation between body size and abundance in a bird community: the effects of phylogeny and competition. Philos. Trans. R. Soc. B 256, 147-149. .
Croci, S., Butet, A., Clergeau, P., 2008. Does urbanization filter birds on the basis of their biological traits. Condor 110, 223-240. .
Dallas, T., Decker, R.R., Hastings, A., 2017. Species are not most abundant in the centre of their geographic range or climatic niche. Ecol. Lett. 20, 526-1533. .
Daru, B.H., Rodriguez, J., 2023. Mass production of unvouchered records fails to represent global biodiversity patterns. Nat. Ecol. Evol. 7, 816-831. .
Davey, C.M., Devictor, V., Jonzén, N., Lindström, Å., Smith, H.G., 2013. Impact of climate change on communities: revealing species' contribution. J. Anim. Ecol. 82, 551-561. .
de Araujo, M.L., Ramos, F.N., 2021. Targeting the survey efforts: gaps and biases in epiphyte sampling at a biodiversity hotspot. For. Ecol. Manag., 498, 119544 .
Delany, S., Haanstra, L., Thorup, O., 2003. How many of the world's wader species are declining, and where are the globally threatened species. WSG Bull. 101, 13.
Ding, Z.F., Feeley, K.J., Wang, Y.P., Pakeman, R.J., Ding, P., 2013. Patterns of bird functional diversity on land-bridge island fragments. J. Anim. Ecol. 82, 781-790. .
Drummond, A.J., Rambaut, A., 2007. BEAST: bayesian evolutionary analysis by sampling trees. BMC Evol. Biol. 7, 214. .
Engemann, K., Enquist, B.J., Sandel, B., Boyle, B., Jorgensen, P.M., Morueta-Holme, N., et al., 2015. Limited sampling hampers "big data" estimation of species richness in a tropical biodiversity hotspot. Ecol. Evol. 5, 807-820. .
Estrada, A., Morales-Castilla, I., Caplat, P., Early, R., 2016. Usefulness of species traits in predicting range shifts. Trends Ecol. Evol. 31, 190-203. .
Gardner, J.L., Amano, T., Sutherland, W.J., Joseph, L., Peters, A., 2014. Are natural history collections coming to an end as time-series? Front. Ecol. Environ. 12, 436-438.
Gaston, K., 1996. The multiple forms of the interspecific abundance-distribution relationship. Oikos 76, 211-220. https://www.jstor.org/stable/26530250.
Gupta, G., Dunn, J., Sanderson, R., Fuller, R., McGowan, P.J.K., 2020. A simple method for assessing the completeness of a geographic range size estimate. Global Ecol. Biogeogr. 21, e00788 .
Graham, C.H., Ferrier, S., Huettman, F., Moritz, C., Peterson, A.T., 2004. New developments in museum-based informatics and applications in biodiversity analysis. Trends Ecol. Evol. 19, 497-503.
Gregory, R.D., 1995. Phylogeny and relations among abundance, geographical range and body size of British breeding birds. Philos. Trans. R. Soc. B 349, 345-351. .
Hallfors, M.H., Heikkinen, R.K., Kuussaari, M., Lehikoinen, A., Luoto, M., Pöyry, J., et al., 2023. Recent range shifts of moths, butterflies, and birds are driven by the breadth of their climatic niche. Evol. Lett. 2023, qrad004.
Harnik, P.G., Simpson, C., Payne, J.L., 2012. Long-term differences in extinction risk among the seven forms of rarity. P. Natl. Acad. Sci. USA 279, 4969-4976. https://www.jstor.org/stable/41727774.
He, P., Chen, J., Kong, H.Z., Cai, L., Qiao, G.X., 2021. Important supporting role of biological specimen in biodiversity conservation and research. Bull. Chin. Acad. Sci. 36, 425-435.
Hope, A.G., Sandercock, B.K., Malaney, J.L., 2018. Collection of scientific specimens: benefits for biodiversity. Sciences and limited impacts on communities of small mammals. Bioscience 68, 35-42. .
Hromada, M., Čanády, A., Mikula, P., Peterson, A.T., Tryjanowski, P., 2015. Old natural history collections for new millennium–birds and mammals in the collection of PhMr. Tibor Weisz in Sarisske Museum Bardejov, Slovakia. Acta Univ. Presov. 7, 115-141.
Inman, R., Franklin, J., Esque, T., Nussear, K., 2021. Comparing sample bias correction methods for species distribution modeling using virtual species. Ecosphere 12, e03422. .
Isaksson, C., 2018. Impact of urbanization on birds. In: Tietze, D. (Ed.), Bird Species. Fascinating Life Sciences. Springer, Cham, pp. 235–257. .
Jetz, W., Thomas, G.H., Joy, J.B., Redding, D.W., Hartmann, K., Mooers, A.O., 2014. Global distribution and conservation of evolutionary distinctness in birds. Curr. Biol. 24, 919-930. .
Johnston, A., Moran, N., Musgrove, A., Fink, D., Baillie, S.R., 2020. Estimating species distributions from spatially biased citizen science data. Ecol. Model. 422, 108927. .
Karell, P., Ahola, K., Karstinen, T., Valkama, J., Brommer, J.E., 2011. Climate change drives microevolution in a wild bird. Nat. Commun. 2, 208. doi: https://doi.org/ .
Keck, F., 2020. Biosecurity and the ecologies of conservation. An anthropology of collecting practices among virus hunters and birdwatchers. Horizontes Antropol. 26, 93-114. .
Kemp, C., 2015. The endangered dead. Nature 518, 292-294. .
Killen, S.S., Marras, S., Metcalfe, N.B., McKenzie, D.J., Domenici, P., 2013. Environmental stressors alter relationships between physiology and behaviour. Trends Ecol. Evol. 28, 651-658. .
Köckemann, Benjamin, Buschmann, Holger, Leuschner, Christoph, 2009. The relationships between abundance, range size and niche breadth in Central European tree species. J. Biogeogr. 36 (5), 854–864.
Lino, A., Fonseca, C., Rojas, D., Fischer, E., Pereira, M.J.R., 2019. A meta-analysis of the effects of habitat loss and fragmentation on genetic diversity in mammals. Mamm. Biol. 94, 69-76. .
Lundblad, C.G., Conway, C.J., 2021. Ashmole's hypothesis and the latitudinal gradient in clutch size. Biol. Rev. 96, 1349-1366. .
Lyon, B.E., 2003. Egg recognition and counting reduce costs of avian conspecific brood parasitism. Nature 422, 495-499. .
Maclean, S.A., Beissinger, S.R., 2017. Species' traits as predictors of range shifts under contemporary climate change: a review and meta‐analysis. Global Change Biol. 23, 4094-4105. .
Martin, L.B., Boruta, M., 2013. The impacts of urbanization on avian disease transmission and emergence. In: Diego, G., Henrik, B. (Eds.), Avian Urban Ecology. Oxford University Press, Oxford, pp. 116–128.
Maurer, B.A., 1999. Untangling Ecological Complexity: the Macroscopic Perspective. University of Chicago Press, Chicago. .
McGill, B.J., Enquist, B.J., Weiher, E., Westoby, M., 2006. Rebuilding community ecology from functional traits. Trends Ecol. Evol. 21, 178-185. .
McLean, B.S., Bell, K.C., Dunnum, J.L., Abrahamson, B., Colella, J.P., Deardorff, E.R., et al., 2016. Natural history collections-based research: progress, promise, and best practices. J. Mammal. 97, 287-297. .
Meineke, E.K., Daru, B.H., 2021. Bias assessments to expand research harnessing biological collections. Trends Ecol. Evol. 36, 1071-1082. .
Miller, J.A., Miller, J.H., Pham, D.S., Beentjes, K.K., 2014. Cyberdiversity: improving the informatic value of diverse tropical arthropod inventories. PLoS One 9, e115750.
Monsarrat, S., Boshoff, A.F., Kerley, G.I.H., 2019. Accessibility maps as a tool to predict sampling bias in historical biodiversity occurrence records. Ecography 42, 125-136. .
Newbold, T., Gilbert, F., Zalat, S., El-Gabbas, A., Reader, T., 2009. Climate-based models of spatial patterns of species richness in Egypt's butterfly and mammal fauna. J. Biogeogr. 36, 2085-2209.
Page, L.M., MacFadden, B.J., Fortes, J.A., Soltis, P.S., Riccardi, G., 2015. Digitization of biodiversity collections reveals biggest data on biodiversity. Bioscience 65, 841-842. https://www.jstor.org/stable/90007349.
Parnell, J.A.N., Simpson, D.A., Moat, J., Kirkup, D.W., Chantaranothai, P., Boyce, P.C., et al., 2003. Plant collecting spread and densities: their potential impact on biogeographical studies in Thailand. J. Biogeogr. 30, 193-209. .
Patterson, B.D., 2002. On the continuing need for scientific collecting of mammals. Mastozool. Neotrop. 9, 253–262. ISSN 1666-0536.
Peterson, A.T., Navarro-Sigüenza, A.G., Benítez-Díaz, H., 1998. The need for continued scientific collecting; a geographic analysis of Mexican bird specimens. Ibis 140, 288-294.
Prather, L.A., Alvarez-Fuentes, O., Mayfield, M.H., Ferguson, C.J., 2004. The decline of plant collecting in the United States: a threat to the infrastructure of biodiversity studies. Syst. Bot. 29, 15-28. .
Price, S.A., Gittleman, J.L., 2007. Hunting to extinction: biology and regional economy influence extinction risk and the impact of hunting in artiodactyls. Proc. R. Soc. B 274, 1845-1851. https://www.jstor.org/stable/25249258.
Purvis, A., Gittleman, J.L., Cowlishaw, G., Mace, G.M., 2000. Predicting extinction risk in declining species. Proc. R. Soc. B 267, 1947-1952. .
Remsen, J.V., 1995. The importance of continued collecting of bird specimens to ornithology and bird conservation. Bird. Conserv. Int. 5, 146-180. .
Rocha, L.A., Aleixo, A., Allen, G., Almeda, F., Baldwin, C.C., Barclay, M.V., et al., 2014. Specimen collection: an essential tool. Science 344, 814-815.
Sánchez-Fernández, D., Lobo, J.M., Abellán, P., Ribera, I., Millán, A., 2008. Bias in freshwater biodiversity sampling: the case of Iberian water beetles. Divers. Distrib. 14, 754-762. .
Schmitt, C.J., Cook, J.A., Zamudio, K.R., Edwards, S.V., 2019. Museum specimens of terrestrial vertebrates are sensitive indicators of environmental change in the Anthropocene. Philos. T. Roy. Soc. B 374, 20170387. .
Spooner, F.E.B., Pearson, R.G., Freeman, R., 2018. Rapid warming is associated with population decline among terrestrial birds and mammals globally. Global Change Biol. 24, 4521-4531. .
Supahan, N., 2022. Avian assemblage during the development of rice in organic and inorganic rice paddies and its relation to insect pests. Curr. Appl. Sci. Technol. 22, 10.55003. .
Tilman, D., Clark, M., Williams, D.R., Kimmel, K., Polasky, S., Packer, C., 2017. Future threats to biodiversity and pathways to their prevention. Nature 546, 73-81.
Vargas, C.A., Bottin, M., Särkinen, T., Richardson, J.E., Raz, L., Garzon-Lopez, C.X., et al., 2022. Environmental and geographical biases in plant specimen data from the Colombian Andes. Bot. J. Linn. Soc. 200, 451-464. .
Wang, Y.P., Si, X.F., Bennett, P.M., Chen, C.W., Zheng, D., Zhao, Y.H., et al., 2018. Ecological correlates of extinction risk in Chinese birds. Ecography 41, 782-794. .
Wellborn, G.A., Langerhans, R.B., 2015. Ecological opportunity and the adaptive diversification of lineages. Ecol. Evol. 5, 176-195. .
Wilman, H., Belmaker, J., Simpson, J., de la Rosa, C., Rivadeneira, M.M., Jetz, W., 2014. EltonTraits 1.0: species‐level foraging attributes of the world's birds and mammals. Ecology 95, 2027-2027. .
Winker, K., Fall, B.A., Klicka, J.T., Parmelee, D.F., Tordoff, H.B., 1991. The importance of avian collections and the need for continued collecting. LOON 63, 238-246.
Xu, A.C., Zhang, J., Li, Q., Li, Z.Q., Zhu, Q., 2023. The benefits of being smaller: consistent pattern for climate-induced range shift and morphological difference of three falconiforme species. Avian Res. 14, 100079 .
Yang, W., Ma, K., Kreft, H., 2014. Environmental and socio-economic factors shaping the geography of floristic collections in China. Global Ecol. Biogeogr. 23, 1284-1292. .
Yang, X.T., Wang, Y.P., Si, X.F., Feng, G., 2020. Species traits linked with range shifts of Chinese birds. Glob. Ecol. Conserv. 21, e00874. .
Zheng, G.M., 2023. Checklist on the Classification and Distribution of the Birds of China. Science Publishing House, Beijing.
Zizka, A., Antonelli, A., Silvestro, D., 2021. Sampbias, a method for quantifying geographic sampling biases in species distribution data. Ecography 44, 25-32. .
Table
1.
Fleeing distances of bold and shy individuals to an intruding researcher in the three shrub-nesting species (Azure-winged Magpie, AM; White-collared Blackbird, WB; and Brown-cheeked Laughingthrush, BL).
Table
2.
Results of fitting generalized linear models to compare the breeding parameters between bold and shy individuals in the three shrub-nesting species (Azure-winged Magpie, AM; White-collared Blackbird, WB; Brown-cheeked Laughingthrush, BL. SE, standard error; SD, standard deviation).
Model parameters
AM
WB
BL
β ± SE (n)
P
β ± SE (n)
P
β ± SE (n)
P
Clutch size (Poisson distribution)
Intercept
−12.72 ± 77 (124)
0.87
153 ± 331 (53)
0.64
260 ± 379 (47)
0.49
Personality*
−0.08 ± 0.08 (124)
0.36
0.16 ± 0.17 (53)
0.36
0.07 ± 0.18 (47)
0.70
Year
0.01 ± 0.04 (124)
0.85
−0.08 ± 0.16 (53)
0.65
−0.13 ± 0.19 (47)
0.49
Fledgling number (Poisson distribution)
Intercept
3.63 ± 103 (93)
0.97
405 ± 545 (23)
0.46
126 ± 563 (24)
0.82
Personality*
−0.26 ± 0.11 (93)
0.03
0.21 ± 0.27 (23)
0.45
0.18 ± 0.27 (24)
0.51
Year
−0.004 ± 0.05 (93)
0.99
−0.20 ± 0.27 (23)
0.46
−0.06 ± 0.28 (24)
0.82
Nesting success (binomial distribution)
β ± SD (n)
P
β ± SD (n)
P
β ± SD (n)
P
Intercept
−0.51 ± 0.48 (124)
0.29
0.01 ± 0.44 (53)
0.98
−0.06 ± 0.55 (47)
0.91
Personality*
0.45 ± 0.53 (124)
0.40
−0.56 ± 0.62 (53)
0.37
−0.08 ± 0.59 (47)
0.89
Year
−1.52 ± 0.82 (124)
0.06
1.26 ± 0.61 (53)
0.91
0.11 ± 0.60 (47)
0.85
Note: *Data of bold individuals were set as the baseline.
Table
4.
The number and percentage of Unigenes that had been annotated in current databases for the Azure-winged Magpie (AM), White-collared Blackbird (WB), and Brown-cheeked Laughingthrush (BL).

 DownLoad:


 Email Alerts
 RSS Feeds