Jorge Garrido-Bautista, Carmen Hernández-Ruiz, José Luis Ros-Santaella, Eliana Pintus, Nicola Bernardo, Mar Comas, Gregorio Moreno-Rueda. 2023: Habitat-dependent breeding biology of the Blue Tit (Cyanistes caeruleus) across a continuous and heterogeneous Mediterranean woodland. Avian Research, 14(1): 100109. DOI: 10.1016/j.avrs.2023.100109
Citation:
Jorge Garrido-Bautista, Carmen Hernández-Ruiz, José Luis Ros-Santaella, Eliana Pintus, Nicola Bernardo, Mar Comas, Gregorio Moreno-Rueda. 2023: Habitat-dependent breeding biology of the Blue Tit (Cyanistes caeruleus) across a continuous and heterogeneous Mediterranean woodland. Avian Research, 14(1): 100109. DOI: 10.1016/j.avrs.2023.100109
Jorge Garrido-Bautista, Carmen Hernández-Ruiz, José Luis Ros-Santaella, Eliana Pintus, Nicola Bernardo, Mar Comas, Gregorio Moreno-Rueda. 2023: Habitat-dependent breeding biology of the Blue Tit (Cyanistes caeruleus) across a continuous and heterogeneous Mediterranean woodland. Avian Research, 14(1): 100109. DOI: 10.1016/j.avrs.2023.100109
Citation:
Jorge Garrido-Bautista, Carmen Hernández-Ruiz, José Luis Ros-Santaella, Eliana Pintus, Nicola Bernardo, Mar Comas, Gregorio Moreno-Rueda. 2023: Habitat-dependent breeding biology of the Blue Tit (Cyanistes caeruleus) across a continuous and heterogeneous Mediterranean woodland. Avian Research, 14(1): 100109. DOI: 10.1016/j.avrs.2023.100109
Department of Veterinary Sciences, Faculty of Agrobiology, Food and Natural Resources, Czech University of Life Sciences Prague, Kamýcká 129, 16500, Prague 6-Suchdol, Czech Republic
d.
Biological Station of Doñana, EBD-CSIC, Av. Américo Vespucio 26, 41092, Seville, Spain
e.
Department of Biological Sciences, Dartmouth College, 03755, Hanover, NH, USA
Funds: This study was funded by two projects in the National Plan of the Spanish Ministry of Economy and Competition (CGL2014-55969-P and CGL2017-84938-P) and a project of the Andalusian Regional Government (A-RNM-48-UGR20), financed with ERDF funds from the European Union (EU). JGB was supported by a FPU pre-doctoral contract from the Spanish Ministry of Education (FPU18/03034) and MC by a grant from the Spanish Ministry of Economy and Competition through the Severo Ochoa Programme for Centres of Excellence in Research, Development and Innovation (R+D+I) (SEV-2012-0262), contract No. SVP-2014-068620. JLRS and EP were funded by Erasmus+ grants from the EU
Mediterranean woodland environments are characterised by high spatial and temporal heterogeneity, which means the inhabiting species face a wide variety of selective pressures. Species may respond differently to habitat heterogeneity and so distinct eco-evolutionary scenarios may be responsible for the inter-habitat variability in reproductive strategies observed in certain species. The inter-forest variability of some reproductive traits in passerines has been examined by comparing forest patches or separated fragments. However, there is still little information regarding how such highly mobile animals adjust their breeding performance across continuous and heterogeneous woodlands. Here we studied the reproductive performance of a population of Blue Tits (Cyanistes caeruleus) in an area of continuous Mediterranean woodland that included two mountain slopes and four different types of forest, ranging from deciduous oak forests to perennial non-oak forests. We studied the habitat heterogeneity and inter-forest phenotypic variation in terms of reproductive performance and adult and nestling biometry, besides also exploring the effects of ectoparasites on Blue Tit reproduction. Eggs were laid earliest in deciduous Pyrenean Oak (Quercus pyrenaica) forests, while clutch size and the number of fledglings were highest in the humid Pyrenean Oak forest, which had the greatest tree coverage and most humid climate, and lowest in the coniferous Scots Pine (Pinus sylvestris) forest. There were no inter-forest differences in hatching (percentage of nests with at least one egg hatched) and fledging (percentage of nests in which at least one nestling fledged) success. Similarly, there were no inter-forest differences in adult and nestling biometry, but adults that raised more fledglings had a lower body mass, while males whose females laid larger clutches had smaller tarsi. Most ectoparasites did not affect Blue Tit reproduction, although Culicoides had a negative impact on nestling body mass. These results suggest that Blue Tits can adjust their reproductive effort to the forest where they breed even across a very small spatial scale. Different eco-evolutionary scenarios, such as phenotypic plasticity or genetic structuring and local adaptation, might explain the phenotypic differentiation in the reproductive strategies observed over small areas in woodlands.
Environmental factors vary in space and time, so organisms inhabiting heterogeneous environments face a challenge to match their phenotype to different habitats in order to maximise fitness. The degree of heterogeneity creates a range of habitats available in which to reproduce (Sparrow, 1999), forming a mosaic of optimal and suboptimal habitats (Hansson et al., 1995), with important implications for ecological and evolutionary processes. In homogeneous environments, natural selection should favour a common, well-matched phenotype (Edelaar et al., 2017). In heterogeneous environments, by contrast, natural selection should promote a range of phenotypes, as individuals can access different habitats that are optimal for each phenotype (Edelaar and Bolnick, 2019; Trevail et al., 2021).
Accordingly, birds should lay clutches of a size that maximises their reproductive success in a given habitat (Stearns, 1992), but different eco-evolutionary scenarios may also explain the habitat-related variation observed in avian reproductive performance. For example, some phenotypic variation observed between ecologically divergent conditions may be a consequence of adaptive phenotypic plasticity (Chevin and Hoffmann, 2017) and, indeed, phenotypic plasticity provides the potential for birds to rapidly respond to environmental changes (Przybylo et al., 2000; Charmantier et al., 2008; Biquet et al., 2022). Also, the selection of some breeding traits may affect the variation of phenotypic plasticity in populations found in spatio-temporally heterogeneous habitats (Porlier et al., 2012). On the other hand, populations may adapt to environmental heterogeneity through microevolution. Limited gene flow and selection against immigrant genes could be responsible for local adaptation of several avian traits (Blondel et al., 1999; Garant et al., 2005; Postma and van Noordwijk, 2005), whilst high levels of gene flow between areas of different habitat quality can maintain non-adaptive and less-than-optimal clutches because of differential costs associated with each habitat type (Blondel et al., 1998; Dhondt et al., 1990; Liou et al., 1993). Overall, both plastic responses to habitat variation and genetically local specialisation can occur simultaneously within the same meta-population (Blondel, 2007), with each process depending mainly on individual dispersal ranges (Blondel et al., 2006).
Blue Tits are small, Palearctic forest-dwelling, insectivorous passerines that nest in secondary cavities in trees (Stenning, 2018), and whose breeding biology and habitat-dependent variation within Europe has been studied extensively in recent decades. Studies examining the inter-habitat variation in the breeding performance of Blue Tits across the species’ entire European distribution have generally found that deciduous forests are the preferred habitat as they correspond to the highest reproductive and rearing parameters (Blondel et al., 1987; 1991; 1999; Dias et al., 1994; Fargallo and Johnston, 1997; Tremblay et al., 2003; 2005; Lambrechts et al., 2004; Blondel, 2007). Blue Tit reproductive parameters are also shaped by other factors besides caterpillar abundance. In heterogeneous forests, for example, females in good body condition may select high-quality territories (Arriero et al., 2006), with individuals in worse condition occupying poor quality patches and ultimately producing reduced clutch sizes (Dhondt et al., 1992) or impaired offspring condition and physiology (Arriero et al., 2008; Arriero, 2009). Lastly, the genes of immigrants from nearby marginal and poor-quality habitats may lead to maladaptation in some reproductive parameters, such as clutch size (Dhondt et al., 1990; Blondel et al., 2006). Nonetheless, most of the aforementioned studies looked at the habitat-dependent variation in Blue Tit breeding biology or specific life-history traits at the macro-scale (Blondel et al., 1987; 1991; Gil-Delgado et al., 1992; Møller et al., 2014; Vaugoyeau et al., 2016) or at more local spatial scale (Nour et al., 1998; Blondel et al., 1999; 2006; Tremblay et al., 2003; 2005; Lambrechts et al., 2004), usually comparing reproductive parameters between distant geographical regions or forest patches and fragments. In this sense, Lambrechts et al. (2004) reported contrasted differences in the Blue Tit breeding performance between deciduous and evergreen patches separated on average 5 km, with a minimum between-patch distance of 600 m. So, there is scant information on how the Blue Tit adjusts its breeding performance at smaller spatial scales throughout continuous and heterogeneous woodlands.
This study tried to answer the question as how a highly mobile animal adjusts its breeding performance at extremely small spatial scale and across a gradient of habitats. To this end, we examined the breeding biology variation in wild Blue Tits inhabiting a continuous woodland comprising different Mediterranean forestry formations in southeastern Spain. We also explored forest-dependent variations in adult and nestling biometry and the effects of parental biometry on offspring condition. The study area was a continuous woodland located across two opposing mountain slopes, including four habitat types ranging from deciduous to coniferous, evergreen forest formations. We measured and analysed various abiotic and biotic factors, namely solar radiation, vegetation composition and parasite pressure to identify each forest formation's habitat features and hence the environmental pressures the Blue Tits faced during their breeding seasons. Based on the literature, we predict that breeding performance (in terms of a higher production of fledglings per nest and/or more high-quality fledglings) should be better in deciduous oak forests than in coniferous and evergreen formations within the same woodland, as sclerophyllous Mediterranean habitats are generally known to produce delayed caterpillar emergence and lower caterpillar populations (van Balen, 1973; Blondel et al., 1991; 2006; Tremblay et al., 2003; 2005).
2.
Materials and methods
2.1
Study area
The study area was almost 800 ha in total and located 1700–1800 m a.s.l. in the Sierra Nevada National Park (SE Spain; 36°57ʹ N, 3°24ʹ W). It contained four different forestry formations: (1) a Holm Oak (Quercus ilex) forest, (2) a dry Pyrenean Oak (Quercus pyrenaica) forest, (3) a Scots Pine (Pinus sylvestris) forest, and (4) a humid Pyrenean Oak forest (Fig. 1), together constituting a continuous woodland representative of the Mediterranean habitat. The two Pyrenean Oak forests are referred to as dry and humid forests throughout the text as the higher humidity of the humid Pyrenean Oak forest, traversed by the Almiar stream, was one of the main differences between them (Fig. 1). These four forests represented different environmental pressures for Blue Tits during breeding season, as they differed in a wide variety of factors, such as solar radiation, insolation time, canopy cover, vegetation quality and ectoparasite and vector presence (see Results and Appendix A).
Figure
1.
Locations of the four forest types in the Sierra Nevada National Park (southern Spain). (A) Holm Oak forest; (B) dry Pyrenean Oak forest; (C) Scots Pine forest; (D) humid Pyrenean Oak forest.
This study was performed across 2017 and 2018. We installed and monitored nest boxes throughout the four forests, all of the same type (ICONA C model; basal area: 196 cm2; height: 20 cm; hole diameter: 3 cm; material: painted wood; more details in Moreno-Rueda, 2003). The nest boxes were hung from a tree branch using a metal hook at a height of 3–4 m and their geographical position recorded with a GPS device. The average separation between nest boxes in each forest was 96.56 ± 53.20 m (mean ± SD). We monitored the nest boxes throughout each year's breeding season to determine the standardised laying date (difference between the actual laying date for each nest and the laying date of the first egg laid in each year; day 0 = day the first egg was laid each year), standardised hatching date (day 0 = day the first egg hatched each year), clutch size, brood size (nestlings counted at 3 days after hatching) and number of fledglings (fledglings counted at 13 days after hatching). Brood size was counted at 3 days given that Blue Tits practice asynchronous hatching and so it may take 2–3 days for all the eggs to hatch (Stenning, 2008). The number of fledglings was recorded when nestlings were 13 days old because they have reached their asymptotic mass and body size by this age (Björklund, 1996) and nestlings older than 13 days may jump out of the nest when visiting nest boxes. Hatching success was calculated as the percentage of nests with at least one egg hatched out of all the nests. Fledging success was calculated as the number of nests in which at least one nestling fledged. The number of unhatched eggs per nest was taken as the difference between clutch size and brood size, and the number of eggs per nest that did not produce a fledgling was determined from the difference between clutch size and number of fledglings. We also calculated the percentage of eggs that produced fledglings for each nest (completely failed nests excluded). In total, we monitored breeding in 175 nest boxes (Holm Oak: 26 boxes, dry Pyrenean Oak: 63, Scots Pine: 25, humid Pyrenean Oak: 61), but the sample size varied slightly depending on each analysis (see below).
Adult birds were captured when the nestlings were between 8 and 11 days old (day 0 = hatching day) using scuttles that closed the nest box opening when they entered to feed the nestlings. We chose this age range to ensure the nestlings would not be harmed, given that the parents do not return to their nest box immediately (Schlicht and Kempenaers, 2015), as tit nestlings develop thermoregulation from day 8 (Perrins, 1979). Once captured, we sexed adults by examining for brood patches in females, measured their tarsus length with a digital calliper (accuracy: 0.01 mm) and weighed them to the nearest 0.1 g with a digital portable scale. The adults were banded with aluminium rings for further identification and liberated within 10 m of their nest boxes. In total, we measured 116 adults (Holm Oak: 12 adults; dry Pyrenean Oak: 41; Scots Pine: 15; humid Pyrenean Oak: 48). In 2017, when the nestlings were 13 days old, we measured their tarsus length and body mass (as explained above for adults), and they were banded with aluminium rings. All adult and nestling birds were measured by the same researcher (GMR). For each nest, we calculated the mean brood mass and standard deviation of nestling body mass within broods. For logistic reasons, fledgling biometry could not be recorded in 2018. In total, we measured 445 fledglings corresponding to 80 nests (Holm Oak: 76 fledglings, dry Pyrenean Oak: 146, Scots Pine: 47, humid Pyrenean Oak: 176).
2.3
Ectoparasite estimation
We carefully revised the nest material in the nest boxes once all fledglings left their nests to obtain an estimate of ectoparasite pressure. We recorded the prevalence and intensity (i.e., number of parasites in infested nests) of Protocalliphora azurea blowfly larvae and puparia and the prevalence of Ceratophyllus gallinae hen flea larvae and adults. In total, we obtained nest-dwelling ectoparasite data from 154 nest boxes. Blowfly larvae feed on nestling blood, which has a negative effect on their physiology and growth (Hurtrez-Boussès et al., 1997; Arriero et al., 2008). Although hen flea larvae are saprophytic, adults suck nestling blood to the detriment of their physiology, health and feather growth (Pitala et al., 2009; Brommer et al., 2011).
2.4
Forest characterisation: GIS and remote sensing analyses
Forest heterogeneity was characterised using various image analysis techniques. All geographical data and images were processed with Quantum GIS 3.10.5 software (QGIS Development Team, 2020), unless indicated otherwise. First, we downloaded a digital elevation model (5 m × 5 m resolution) covering the study area (source: MTN50 project; Spanish Instituto Geográfico Nacional) to obtain forest orientation, forest slope, solar radiation and insolation time. Before making any calculations, the spatial extent of each forest was delimited and clipped based on its natural extension (Fig. 1). The mean forest orientations were obtained by reclassifying the raster pixel values into four categories: 315–45° (north), 45–135° (east), 135–225° (south) and 225–315° (west).
Solar radiation was determined using the Area Solar Radiation algorithm within the Spatial Analyst extension of the ArcGIS Desktop 10.3.1 software (ESRI, Redlands, CA, USA). We calculated solar radiation every five days in the 2017 and 2018 breeding seasons starting from the day the first egg was laid until the day the last fledgling left the nest. The 2017 and 2018 breeding seasons covered from April 28 to June 30 and May 1 to July 31, respectively. Radiation was expressed in units of kWh/m2/day. The insolation time (the hours per day a forest receives solar radiation) was estimated with the r.sun.insoltime algorithm in the GRASS GIS 7.8.2 software (GRASS Development Team, 2020), which is integrated within Quantum GIS 3.10.5 (QGIS Development Team, 2020). We set the time step for processing the sum of all-day radiation to 1 min. The mean insolation time was obtained every five days from April 28 to August 1 to cover the two breeding seasons.
Forest coverage and land use were estimated using vector layers obtained from the SIOSE project (Sistema de Información sobre Ocupación del Suelo de España), which was downloaded from the REDIAM website (Red de Información Ambiental de Andalucía). We calculated the extension (ha) and percentage of land uses with the intersection function. Further details on the method used to categorise land uses can be found in the public repository of the SIOSE project (see Appendix A). Vegetation quality was characterised based on Landsat-8 satellite images (30 m × 30 m resolution) of the entire study area that were acquired throughout the 2017 and 2018 breeding seasons. We obtained two satellite images for 2017 and three for 2018, while five other images were excluded because of cloud cover. The normalised difference vegetation index (NDVI) was calculated based on bands B4 (red: 0.64–0.67 μm) and B5 (near infrared: 0.85–0.88 μm) as: (B5–B4)/(B5+B4). NVDI values range from −1 to 1, where negative values correspond to an absence of vegetation and values close to 1 equate to dense vegetation coverage (Pettorelli et al., 2005).
2.5
Statistical analysis
Although there was a total of 175 occupied nest boxes, sample sizes varied depending on the analysis being carried out. Not all nest boxes could be followed to the end of the study to obtain all the reproductive parameters due to predation, desertion or unidentified causes of nestling death. Consequently, the sample sizes were 171 next boxes for laying date, 174 for clutch size, 172 for brood size, and 171 for the number of fledglings. The variables (environment: insolation time, solar irradiation, NDVI; ectoparasites: intensities of blowflies, biting midges and black flies; reproductive parameters: laying date, clutch size, brood size, number of fledglings, number of unhatched eggs and number of eggs that failed to produce a fledgling; biometry: tarsus length and body mass) were plotted and tested for normality following Zuur et al. (2010). We checked for outliers using Cleveland dot plots and did not find any abnormalities in any of the variables. As insolation time, solar radiation and NDVI were not normally distributed, we used the Kruskal–Wallis test to examine the differences between forests for these variables. In the case of NDVI, one value was excluded from the statistical analysis because a forest patch was covered by clouds (Appendix Table S4).
The residuals of all models in the following sections were checked for normality following Zuur et al. (2010). The basic statistics are given as mean ± standard error (SE). All the analyses were performed in the R software environment, version 4.0.0 (R Development Core Team, 2020), using the nlme (Pinheiro et al., 2019) and lme4 packages (Bates et al., 2020), and graphs were constructed using the ggplot2 package (Wickman, 2016). The data are available in Appendix B.
2.5.1
Ectoparasites
We used the chi-squared test to check for inter-forest variability in the prevalence of ectoparasites and the Kruskal–Wallis test to examine differences between forests in the intensity (i.e., number of parasites in infested nests; Rózsa et al., 2000) of blowflies, biting midges and black flies. Linear models were employed to determine the variation in the intensity of blowflies, biting midges and black flies depending on the laying date. Linear mixed-effects models of restricted maximum likelihood (REML-LMM) (Zuur et al., 2009) were applied to examine whether the presence of ectoparasites affected Blue Tit breeding biology. The models had the following structures: (1) for blowflies and fleas: clutch size, brood size and the number of fledglings were the dependent variables in separate models; forest, year and the prevalence of fleas and blowflies were the predictors; standardised laying date was the covariate; and nest identity was the random factor; (2) for biting midges and black flies: clutch size, brood size and the number of fledglings were the dependent variables in separate models; forest, year and the prevalence of biting midges and black flies were the predictors; standardised laying date was the covariate; and nest identity was the random factor. We also used REML-LMMs to determine if the presence of ectoparasites had an impact on nestling biometry. We ran two separate REML-LMMs for the nestlings’ body mass and tarsus length applying the following structure: (1) forest, the presence of fleas and the presence of blowflies were the predictors, standardised laying date the covariate and nest identity the random factor; (2) forest, the presence of biting midges and the presence of black flies were the predictors, standardised laying date the covariate and nest identity the random factor. The nestling tarsus length (log transformed) was also included as a covariate to control for structural size in the model for nestling body mass.
2.5.2
Breeding biology and nestling biometry
An REML-LMM was used to assess whether laying date varied with forest type. In the final model, the standardised laying date was the dependent variable, nest identity was the random factor, and forest and year were the predictors. The interaction between forest and year was removed from the final model because it was not significant. We also used separate REML-LMMs to check whether clutch size, brood size, number of fledglings and percentage of eggs that produced fledglings (arcsine transformed) varied with forest type. In these cases, the final models had the following structure for each dependent variable: the nest identity was the random factor, forest and year were the predictors and standardised laying date was the covariate. Interactions between forest and year and between forest and laying date were removed from all models because none of them were significant. Lastly, separate REML-LMMs were also applied to examine the variation in nestling body mass (log transformed) and nestling tarsus length (log transformed) across the forests. In both cases, nest identity was the random factor, forest type the predictor and standardised laying date the covariate. However, in the model for nestling body mass, the nestling tarsus length (log transformed) was again included as a covariate to control for structural size.
Correlations between laying date and clutch size, brood size, number of fledglings and nestling body mass were examined using the Pearson product-moment correlation coefficient. We used the chi-squared test to check for inter-forest variability in hatching success and fledging success, given that these variables are frequencies. As the number of unhatched eggs and eggs that did not produce fledglings had left-skewed distributions, we used generalised linear mixed models (GLMM) with a Poisson distribution and a log link-function to study if the two parameters varied with forest type. We ran two separate models for each variable with the following structure: nest identity was the random factor, forest and year were the predictors and laying date was the covariate.
2.5.3
Adult biometry
We used REML-LMMs to examine the variation in body mass and tarsus length of males and females depending on forest type. The log-transformed body mass and log-transformed tarsus length of males and females were the dependent variables in separate models, while forest and year were the predictors and nest identity was the random factor (the model for body mass also included log-transformed tarsus length as a covariate). The effects of adult biometry on reproduction were tested using REML-LMMs; all subsequent models were run separately for males and females. The models for adult body mass had the following structure: clutch size, brood size and number of fledglings were the dependent variables in separate models; nest identity was the random factor; forest and year were the predictors and standardised laying date, adult log body mass and adult log tarsus length were the covariates. The interactions between forest and year and between forest and laying date were removed from these models because they were not significant. As nestlings were only measured in one year, the variation in mean brood mass and standard deviation of nestling mass within broods against adult biometry was examined with linear models. Separate models took brood mass and its standard deviation as the dependent variables, forest type as the predictor and log adult body mass and log adult tarsus length as the covariates.
3.
Results
3.1
Environmental differences between forest types
The mean orientations of the Holm Oak and dry Pyrenean Oak forests were 171.44° and 148.32°, respectively, while the Scots Pine and humid Pyrenean Oak forests were oriented at 190.42° and 237.66°, respectively (Appendix Fig. S1). Accordingly, the two forests on the southeastern slope (Holm Oak and dry Pyrenean Oak forests) received more solar radiation (approx. 0.15 kWh/m2/day) and had 1 h more of insolation per day than the forests on the southwestern slope (Scots Pine and humid Pyrenean Oak forests) (radiation: χ32 = 23.74, p < 0.001; insolation:χ32 = 62.49, p < 0.001; Appendix Figs. S2, S3 and S4; Table S1).
The four forest types differed in tree and shrub structure as well as land uses (Appendix Fig. S5; Table S2). The Holm Oak forest was the most open, with the lowest percentage of dense tree cover (15.63%). The dry Pyrenean Oak forest had a higher percentage of dense tree cover (approx. 65%), but less than the forests on the southwestern slope, which had the highest level of dense tree cover (approx. 82% in both the Scots Pine and humid Pyrenean Oak forests; Appendix Table S2). The NDVI differed between forest types (χ32 = 21.49, p < 0.001; Appendix Table S3), with the Holm Oak forest presenting the lowest values (0.40 ± 0.004) and the Scots Pine forest with the highest (0.66 ± 0.004). The dry and humid Pyrenean Oak forests were found to have intermediate NDVI values (0.59 ± 0.01 and 0.62 ± 0.003, respectively).
3.2
Differences in ectoparasite presence between forest types
Overall, 65 out of 154 nests (42.21%) were infested with fleas, with nest infestation rates differing between forest types (chi-squared test, χ32 = 24.51, p < 0.001; Fig. 2A). Only 9.09% of nests sampled in the Holm Oak forest and 30.36% in the dry Pyrenean Oak forest were infested with fleas, while they were found in 52.17% and 64.15% of the nests in the Scots Pine and humid Pyrenean Oak forests, respectively. Blowflies infested 100 out of 154 nests (64.94%). As observed for fleas, blowflies were less prevalent in the Holm Oak (40.90% of nests infested) and dry Pyrenean Oak (41.07%) forests than in the Scots Pine (95.65%) and humid Pyrenean Oak (86.79%) forests (χ32 = 40.24, p < 0.001; Fig. 2A). Considering only infested nests, there were no significant differences in blowfly intensity within each nest across the four forest types (Holm Oak: 12.11 ± 4.30; dry Pyrenean Oak: 12.78 ± 2.03; Scots Pine: 15.09 ± 2.57; humid Pyrenean Oak: 17.20 ± 1.42; Kruskal–Wallis test, χ32 = 5.87, p = 0.118).
Figure
2.
Percentage of Blue Tit nests infested by (A) nest-dwelling ectoparasites and (B) flying ectoparasites in the four forest types. (For interpretation of the references to colour in this figure legend, the reader is referred to the Web version of this article.)
Across all forest types, biting midges infested 48.05% and black flies 23.38% of nests (n = 77 for both parasites). In contrast to nest-dwelling ectoparasites, there were no differences between forests in the frequency of nest infestation by biting midges and black flies (in both cases, χ32 > 5.09, p > 0.12; Fig. 2B). Similarly, the intensity of biting midges and black flies did not vary between forest types (biting midges: χ32 = 5.49, p = 0.139; black flies: χ32 = 4.33, p = 0.228). Nor did the intensity of blowflies (F1, 98 = 0.80, p = 0.37), black flies (F1, 39 = 0.21, p = 0.65) and biting midges (F1, 10 = 2.32, p = 0.20) vary with laying date.
Flea-infested nests contained a significantly higher number of fledglings than uninfested nests (infested nests: 6.31 ± 0.15; uninfested nests: 5.17 ± 0.17; Table 1). The presence of blowflies, biting midges and black flies in Blue Tit nests was not significantly associated with clutch size, brood size or number of fledglings (Table 1). The presence of fleas, blowflies and black flies did not affect nestling tarsus length (p > 0.05 in all cases, data not shown for simplicity) or body mass (p > 0.05 in all cases, data not shown for simplicity), but the presence of biting midges had a negative impact on body mass (infested nests: 9.20 ± 0.09 g; uninfested nests: 10.15 ± 0.06 g; χ2 = 6.19, p = 0.01).
Table
1.
Results of the linear mixed-effects models (LMM) for clutch size, brood size and number of fledglings for the Blue Tit (Cyanistes caeruleus) population in the Sierra Nevada National Park, southern Spain, with the prevalence of different ectoparasites: blowflies, fleas, biting midges and black flies.
Predictor
Dependent variable
Clutch size
Brood size
Number of fledglings
Wald χ2
df
p-value
Wald χ2
df
p-value
Wald χ2
df
p-value
Models for nest-dwelling ectoparasites
Forest
17.73
3
<0.001
15.52
3
0.001
17.56
3
<0.001
Year
54.50
1
<0.001
24.48
1
<0.001
16.25
1
<0.001
Laying date
41.86
1
<0.001
18.47
1
<0.001
16.22
1
<0.001
Blowflies
0.33
1
0.56
2.92
1
0.09
3.03
1
0.08
Fleas
0.08
1
0.77
2.31
1
0.13
5.42
1
0.02
Models for flying ectoparasites
Forest
13.25
3
0.004
14.43
3
0.002
7.61
3
0.050
Year
19.06
1
<0.001
10.86
1
<0.001
7.89
1
0.005
Laying date
1.16
1
0.28
0.69
1
0.41
0.63
1
0.43
Biting midges
0.64
1
0.42
3.25
1
0.07
0.30
1
0.58
Black flies
0.42
1
0.51
0.91
1
0.34
0.95
1
0.33
Statistical significance was set at p < 0.05 (marked in bold).
3.3
Forest-dependent variation in reproductive parameters
The laying date was later in the Holm Oak and Scots Pine forests than in the dry and humid Pyrenean Oak forests (χ32 = 9.89, p = 0.019; Fig. 3; Table 2). Clutch size ranged from 3 to 15 eggs and the mode was 7 eggs (18.97%). After adjusting for the year and laying date, the largest clutches were in the humid Pyrenean Oak forest and the smallest in the Scots Pine forest, whilst intermediate values were found in the Holm Oak and dry Pyrenean Oak forests (χ32 = 19.54, p < 0.001; Fig. 4A; Table 2). Across all forests, clutch size decreased with laying date (χ2 = 62.41, p < 0.001), as they showed a negative correlation (r = −0.34, p < 0.001). In total, 10 out of 172 clutches failed to hatch (i.e., none of the eggs hatched). There was no inter-forest variability in hatching success (χ32 = 0.49, p = 0.92; Table 2) or the number of unhatched eggs per nest, which also showed no variation with laying date (forest: χ32 = 2.26, p = 0.52; laying date: χ2 = 0.68, p = 0.41; Table 2).
Figure
3.
Frequency distribution of Blue Tit pair laying dates in the four forest types. Standardised laying dates are the differences between the actual laying date for each nest and the laying date of the first egg laid in each year (day 0 = first egg laid each year). Laying dates are shown as 10 day periods. Dashed line indicates the mean. (For interpretation of the references to colour in this figure legend, the reader is referred to the Web version of this article.)
Table
2.
Reproductive parameters for Blue Tits (Cyanistes caeruleus) and biometric measurements of Blue Tit nestlings in four forest types in the Sierra Nevada National Park, southern Spain.
Parameter
Holm Oak
Dry Pyrenean Oak
Scots Pine
Humid Pyrenean Oak
Laying date
a
19.56 ± 0.72 (25)
15.25 ± 0.91 (60)
21.16 ± 0.64 (25)
14.57 ± 0.99 (61)
Clutch size
7.42 ± 0.11 (26)
6.89 ± 0.14 (62)
5.88 ± 0.07 (25)
7.74 ± 0.14 (61)
Brood size
5.72 ± 0.18 (25)
5.39 ± 0.18 (62)
5.04 ± 0.13 (25)
6.35 ± 0.19 (60)
Number of fledglings
5.08 ± 0.21 (26)
4.58 ± 0.20 (59)
4.44 ± 0.14 (25)
5.92 ± 0.19 (61)
Hatching success (%)
92.00 ± 0.02 (25)
93.55 ± 0.02 (62)
96.00 ± 0.01 (25)
95.00 ± 0.02 (60)
Number of unhatched eggs
1.72 ± 0.18 (25)
1.50 ± 0.17 (62)
0.84 ± 0.09 (25)
1.26 ± 0.13 (60)
Number of eggs that failed to produce a fledgling
2.34 ± 0.21 (26)
2.22 ± 0.18 (59)
1.44 ± 0.13 (25)
1.82 ± 0.15 (61)
% eggs that produced fledglings
b
81.74 ± 0.01 (22)
76.20 ± 0.02 (52)
81.10 ± 0.02 (23)
81.08 ± 0.02 (57)
Fledging success (%)
84.62 ± 0.03 (26)
88.14 ± 0.02 (59)
92.00 ± 0.02 (25)
93.44 ± 0.02 (61)
Nestling body mass (g)
9.79 ± 0.05 (76)
9.83 ± 0.05 (145)
9.47 ± 0.05 (47)
10.09 ± 0.04 (176)
Nestling tarsus length (mm)
16.52 ± 0.03 (76)
16.44 ± 0.03 (144)
16.25 ± 0.03 (47)
16.47 ± 0.03 (176)
Reproductive parameters include data for 2017 and 2018, but nestling biometry is for 2017 only. The table shows the mean values, standard error and sample size (n) in parentheses. a 0 = day the first egg was laid each year. b Nests without fledglings (predated, deserted, etc.) were excluded.
Figure
4.
Variation in Blue Tit clutch size (A), brood size (B) and number of fledglings (C) across the four forest types. The red point shows the mean for each forest, the horizontal line the median and the boxplot represents the interquartile range. The kernel density plot shows the probability density of data at different values. Note: the maximum number of fledglings is higher than the maximum brood size in the humid Pyrenean Oak forest because brood size could not be recorded in a nest with a clutch of 15 eggs. (For interpretation of the references to colour in this figure legend, the reader is referred to the Web version of this article.)
Brood size ranged from 0 to 10 with a mode of 6 nestlings (19.77%). There were no statistically significant differences in brood size between forest types, but it tended to follow the same pattern as clutch size (χ32 = 6.52, p = 0.089; Fig. 4B; Table 2). As observed for clutch size, brood size also decreased with the laying date in all forests (r = −0.26; χ2 = 25.62, p < 0.001).
Of all the nests that produced at least one nestling (161 out of 171), only seven (4.35%) did not manage to raise any nestlings. Causes of nestling mortality in these seven cases included predation (n = 1), nest abandonment by parents (n = 1), starvation (n = 3) and unidentified causes (n = 2). Fledging success did not vary between forest types (χ32 = 1.99, p = 0.57; Table 2). Over the two years, the percentage of eggs that produced fledglings did not differ between forest types (χ32 = 1.13, p = 0.77; Table 2), nor was it affected by laying date (χ2 = 0.02, p = 0.89). However, when considering all nests, the number of fledglings per nest showed the same pattern of variation between forests as clutch size (χ32 = 8.58, p = 0.035; Fig. 4C). Blue Tits breeding in the humid Pyrenean Oak forest had the highest number of fledglings (5.92), while those in the Scots Pine forest had the lowest productivity (4.44), with intermediate values recorded for the Holm Oak (5.08) and dry Pyrenean Oak forests (4.58) (Table 2). As for clutch and brood size, the number of fledglings decreased with laying date in all forest types (r = −0.20; χ2 = 14.81, p < 0.001). There was no variation in the number of eggs that failed to produce a fledgling across the forest types (χ32 = 1.90, p = 0.59) or in terms of the laying date (χ2 = 3.08, p = 0.08; Table 2).
Neither the tarsus-corrected body mass (χ32 = 0.58, p = 0.90) nor the tarsus length of nestlings (χ32 = 2.41, p = 0.49) differed between forest types (Table 2). Nestling body mass, but not tarsus length, diminished with the laying date in all forests (body mass: χ2 = 13.18, p < 0.01; r = −0.35, p < 0.01; tarsus length: χ2 = 0.35, p = 0.56; r = −0.06, p = 0.22).
3.4
Effect of adult biometry on breeding success
As seen with nestlings, the tarsus-corrected body mass (males: χ32 = 4.77, p = 0.19; females: χ32 = 1.56, p = 0.67) and tarsus length of adults (males: χ32 = 1.59, p = 0.66; females: χ32 = 3.79, p = 0.28) did not differ between forest types. The body masses of both males and females did not correlate with clutch or brood size (p > 0.05 in all cases, data not shown for simplicity), but significant associations were found for the number of fledglings. Adults that produced more fledglings weighed less when they were measured (when nestlings were 8–11 days old; males: χ2 = 4.80, p = 0.028; females: χ2 = 8.00, p = 0.005; Fig. 5). There was no relationship between the tarsus length of females and clutch size, brood size or the number of fledglings (p > 0.05 in all cases, data not shown for simplicity). However, males whose females laid larger clutches had smaller tarsi (χ2 = 6.62, p = 0.01). The body mass and tarsus length of adult males and females showed no variation with brood mass or the standard deviation of nestling mass within broods (p > 0.05 in all cases, data not shown for simplicity).
Figure
5.
Relationship between the body mass (g) of adult Blue Tits (Cyanistes caeruleus) and the number of fledglings produced depending on sex (green: females, blue: males). The shaded areas correspond to the 95% confidence interval. (For interpretation of the references to colour in this figure legend, the reader is referred to the Web version of this article.)
Mediterranean environments are typically characterised by high spatial heterogeneity, which means species face a wide range of selective pressures in small areas (Blondel et al., 2010). In our study area, for example, the Blue Tits reproduced in a small, continuous woodland formed by four well-differentiated forestry formations that were characterised by both their solar radiation and their tree cover and composition. The woodland was located across two mountain slopes that were separated by a river (Chico river), hence the west-facing slope—which was also crossed by a stream (Almiar stream)—received less solar radiation than the east-facing slope. The east-facing slope was composed of Holm and Pyrenean Oaks, while the west-facing slope contained Scots Pines and Pyrenean Oaks, thus providing a more humid and productive environment. Given that water availability is a limiting factor on tree productivity in Mediterranean habitats (Príncipe et al., 2022), the higher productivity of the humid Pyrenean Oak forest should be reflected in a greater percentage of dense tree cover (as observed), which could presumably support more caterpillars, the key food source for Blue Tits during spring (Blondel et al., 1991; Bańbura et al., 1999; Tremblay et al., 2005). Indeed, in a previous study we found that caterpillar abundance was higher in the humid Pyrenean Oak forest on the west-facing slope than the dry Pyrenean Oak forest on the east-facing slope (Garrido-Bautista et al., 2021). Unfortunately, the same information was not recorded for the years included in this study. The Scots Pine forest, however, was expected to produce fewer caterpillars despite its high tree cover because new leaves develop more slowly in sclerophyllous trees (Orshan, 1989) and pine needles contain a relatively high concentration of tannins (Achotegui-Castells et al., 2013), so these forests only support low caterpillar populations (Tremblay et al., 2003). Overall, the study area’s particular topography and vegetation structure create a microscale geographic variation similar to the ‘evolution canyon’ models described by Nevo (2006; 2009; 2012), in which opposite, yet still closely neighbouring, slopes display marked microclimatic and biotic contrasts with potentially different eco-evolutionary processes developing on each slope (see below).
The aforementioned inter-forest environmental differences were expected to modulate Blue Tit breeding performance, specifically, we believed females would lay larger clutches in more productive forests. As predicted, the clutch size and number of fledglings per nest were highest in the humid Pyrenean Oak forest and lowest in the coniferous Scots Pine forest, a pattern to be expected based on previous evidence (Blondel et al., 1987; 1991; Dias et al., 1994; Fargallo and Johnston, 1997; Tremblay et al., 2003; 2005; Lambrechts et al., 2004; Blondel, 2007). Besides the low production of caterpillars, coniferous forests also impose foraging costs to Blue Tits (Díaz et al., 1998), consequently increasing the impacts on the Blue Tit reproductive output. However, despite statistically different clutch sizes between forest types (ranging from approximately 6 to 8 eggs on average), the fledging success was similar in all forests; with a range of 76–82% of eggs producing fledglings and 1.4–2.3 eggs per clutch failing to produce fledglings. Nestling body mass and tarsus length, predictors of nestling survival and recruitment in the population (Nur, 1984a; Blondel et al., 1998; Charmantier et al., 2004), did not differ between forest types, which suggests that the Blue Tits produced similar quality fledglings in each forest. Although there was a tendency on the east-facing slope to lose one more egg per nest than the west-facing slope, our results indicate that the Blue Tits successfully adjusted their reproductive effort to the rearing conditions in the forest where they bred. For example, females started laying eggs earlier in deciduous (dry and humid Pyrenean Oak) forests than in evergreen (Holm Oak) and coniferous (Scots Pine) forests, probably because spring development of caterpillars occurs later in evergreen forests (Blondel et al., 1999; Tremblay et al., 2003). Also, when comparing the two deciduous forests, Blue Tits in the dry Pyrenean Oak forest laid 6.9 eggs producing 4.6 fledglings, whereas birds in the humid Pyrenean Oak forests laid 7.7 eggs and produced 5.9 fledglings. Hence, on average Blue Tit pairs lose two eggs/nestlings per clutch in both forests and in fact, in our study area, two eggs per brood typically hatched asynchronously with a hatching spread of two days (unpublished data). These late-hatched nestlings are therefore apparently marginal and have a low reproductive value for parents (Forbes et al., 1997; Stenning, 2008).
In summary, our results showed that, in relative terms, the fledging success of Blue Tits did not differ between the four forest types, but fitness—measured quantitatively as the number of fledglings per nest—did. The optimal clutch size, which can be indirectly estimated from a population’s average clutch size (Liou et al., 1993), for example, appears to be the highest in the humid Pyrenean Oak forest, with one more egg on average than the dry Pyrenean Oak forest and two more than the Scots Pine forest. This pattern may have emerged because of individual optimization of breeding performance, which means that individuals are able to produce the number of eggs, or nestlings, they can successfully rear themselves based on individual-specific condition (Perrins and Moss, 1975; Pettifor et al., 1988; 2001; Pettifor, 1993), but also on the spatial and temporal variability in food availability in the rearing environment (van Balen, 1973; Blondel et al., 1991; Tremblay et al., 2003; 2005). Further cross-fostering studies altering brood sizes should be conducted to identify the optimal clutch size for each forest. Still, optimal clutch sizes from Blue Tit populations of the Mediterranean basin are expected to be lower than those populations from higher latitudes, mainly as consequence of habitat-specific constraints in food availability (e.g., Blondel et al., 2006; Ziane et al., 2006; Charmantier et al., 2016). An important question still remains as to what extent this variation in clutch size, which ultimately determines the number of fledglings a Blue Tit pair can raise (see results), is due to phenotypic plasticity or a local adaptation process.
The different production of fledglings from all Blue Tit pairs breeding in each habitat could determine the overall reproductive output within each forest type, which may promote source-sink population dynamics. Although large geographical distances between populations that limit gene exchange typically lead to population structuring (Slatkin, 1987), microscale population differentiation can occur between closely located populations of migrant and resident bird species (Garant et al., 2005; Postma and van Noordwijk, 2005; Blondel et al., 2006; Senar et al., 2006; Ortego et al., 2011; Arnoux et al., 2014; García-Navas et al., 2014; Camacho et al., 2016). Individual dispersal range is an important factor in the genetic population structure of passerines (Blondel et al., 2006). The Blue Tit is a highly mobile passerine, but it is reported to have a relatively low dispersal capacity that follows a non-random pattern. Females disperse over longer distances than males (Ortego et al., 2011), but they reduce their dispersal distance if hatching success was high in the preceding breeding season (García-Navas and Sanz, 2011), which means females with low dispersal distances have higher offspring recruitment rates (García-Navas et al., 2014). Therefore, if low immigration rates and selection against immigrants takes places in a meta-population (e.g., Postma and van Noordwijk, 2005), then philopatric females can obtain more local recruits than immigrant counterparts (García-Navas et al., 2014), which may encourage genetic population structuring and local adaptation. The fine-scale genetic population structuring process may be accompanied by phenotypic divergence in reproductive strategies (Blondel et al., 1999; Postma and van Noordwijk, 2005) or morphological traits (Blondel et al., 1999; Garant et al., 2005; Senar et al., 2006; Camacho et al., 2013; 2016). The data revealed that Blue Tits in our study area had low dispersal ranges, with individuals being recruited locally within their own slope (only one individual showed a dispersing behaviour between slopes), and that there was a well-established and significant genetic population structure between the two woodland slopes (microsatellite-based analysis: FST = 0.016, p < 0.001; Garrido-Bautista et al., submitted). However, in contrast to other passerine meta-populations (Garant et al., 2005; Senar et al., 2006; Camacho et al., 2013; 2016), we did not detect an inter-forest phenotypic differentiation in morphometry. The lack of any inter-forest differences in female body mass (which might have explained the different clutch sizes; Haywood and Perrins, 1992) also suggests that the between-forest variation in the reproductive strategies of the Blue Tits inhabiting our ‘evolution canyon’ woodland were due to a fine-scale, local population adaptation process rather than plastic responses.
Furthermore, we found a higher prevalence of nest-dwelling ectoparasites (fleas and blowflies) in the forests on the west-facing slope, i.e., the humid Pyrenean Oak forest and the Scots Pine forest, than those on the opposite slope. As nest-dwelling ectoparasites feed on nestlings, the number of nestlings in a nest is expected to modulate the presence of such parasites in the different habitats (Hurtrez-Boussès et al., 1999; Arriero et al., 2008); we duly found that nests housing more fledglings were more frequently parasitised by fleas. Environmental factors, such as ambient temperature and humidity, may also play an important role in the presence of nest-dwelling ectoparasites in nests within a given habitat (Heeb et al., 2000; Castaño-Vázquez et al., 2018; 2021; Garrido-Bautista et al., 2020; Mennerat et al., 2021; Moreno-Rueda, 2021). A combination of these factors could explain why fleas and blowflies were more common in nests occupying the west-facing slope than those on the east-facing slope, as the latter produced fewer nestlings and a drier environment for ectoparasites. Both fleas and blowflies are known to have an impact on nestling blood physiology, growth and survival (Merino and Potti, 1995; Hurtrez-Boussès et al., 1997; Puchala, 2004; Pitala et al., 2009; Brommer et al., 2011), but they may also affect several current and future reproductive metrics, such as egg size (Potti, 2008), number of fledglings (Lemoine et al., 2012) and lifetime reproductive success (Fitze et al., 2004). Thus, we expected the nests on the west-facing slope to suffer more parasitism, in terms of reproduction costs, than nests on the opposite slope. In previous studies, we found that nestlings did not suffer from any ectoparasite-induced physiological costs, neither to the immune system (Garrido-Bautista et al., 2022b) nor in terms of oxidative status (Garrido-Bautista et al., 2021), and we did not detect any effect of ectoparasites on nestling survival or body size in the present work. The scant effect of ectoparasites on reproductive output and offspring condition across the woodland suggest that the subjects experienced low or negligible parasite-imposed costs. Blue Tits can tolerate ectoparasites in their nests by increasing feeding rate (Johnson and Albrecht, 1993; Christe et al., 1996; Tripet and Richner, 1997), but the parents’ body mass may decline if they produce a lot of fledglings, which could impair winter survival or subsequent breeding attempts (Nur, 1984b). In effect, in our study, parent body mass decreased with the number of fledglings produced. Nevertheless, further experiments designed to alter the ectoparasite load in the two slopes would help elucidate the underlying mechanisms (Lemoine et al., 2012).
On the other hand, and in contrast with nest-dwelling ectoparasites, there was no variation in the prevalence of biting midges and black flies between forests. We would expect the presence of biting midges and black flies to be determined mainly by environmental factors, as these vectors are only sporadic visitor in nests for blood meals. The type of forest and environmental conditions do indeed have a significant effect on the biting midges and black flies found inhabiting an area, which ultimately determines their abundance in bird nests (Tomás et al., 2008b; 2020; Martínez-de la Puente et al., 2009; 2010). In fact, in a previous study, we showed that forest type is the main determinant of biting midge abundance and there was no association between nestling characteristics and the number of flies entering nests (Garrido-Bautista et al., 2022a). Both biting midges and black flies are known to reduce nestling condition and body mass (Tomás et al., 2008b; Martínez-de la Puente et al., 2010), and our results reaffirmed this observation as we found a negative correlation between biting midges in nests and nestling body mass. This association may be due to the direct effects of biting midges (e.g., draining blood resources and causing skin inflammation) or the indirect impact of the blood-borne parasites they can transmit, such as avian malaria-like disease caused by Haemoproteus (Martínez de-la Puente et al., 2011), which can produce anaemia and decreased body mass (Tomás et al., 2008b; Martínez-de la Puente et al., 2010). On the other hand, and to the best of our knowledge, there is no evidence to suggest that these parasites have an impact on adult reproductive performance, probably because of their ephemeral activity within bird nests and weak evolutionary influence on avian reproduction in contrast to nest-dwelling or blood parasites (e.g., Martin et al., 2001).
5.
Conclusions
Our results suggest that, in highly heterogeneous Mediterranean environments, Blue Tits adapt to different environmental conditions across a woodland by adjusting clutch size to an optimal level for reproductive success in each habitat. Across four types of forest with different environmental conditions within a single woodland, Blue Tits differed in clutch size but fledging success and fledgling tarsus length and body mass were very similar. Specifically, Blue Tits were most productive (i.e., in terms of the number of fledglings) in a deciduous forest with a humid environment. However, pairs nesting in lower-quality forests reduced their clutch size, and hence the number of fledglings reared, but still maintained a similar level of fledging success and nestling quality.
Authors’ contributions
GMR conceived and designed the study. GMR, JLRS, EP, NB and MC carried out the fieldwork and collected the field data. CHR developed the GIS analyses. JGB and GMR developed the statistical analyses. JGB and GMR wrote the first draft of the manuscript, with input from the other authors. GMR secured the funding and supervised the project. All authors read and approved the final manuscript.
Ethics statement
This study complies with current Spanish laws on bioethics and animal welfare and was approved by the Andalusian Regional Government (protocols code: 03-06-15-259 and 03/07/2017/087).
Declaration of competing interest
The authors declare that they have no competing interests.
Acknowledgments
We are grateful to the staff of the Sierra Nevada National Park for their constant support. Stanislav Kolenčík, Miguel Carles Tolrá and Josué Martínez de la Puente, respectively, identified the fleas, blowflies and both biting midges and black flies. Early drafts of the manuscript were improved thanks to comments from Josué Martínez de la Puente. Abelardo Requena Blanco assisted us during the fieldwork in 2018.
Achotegui-Castells, A., Llusià, J., Hódar, J.A., Peñuelas, J., 2013. Needle terpene concentrations and emissions of two coexisting subspecies of Scots pine attacked by the pine processionary moth (Thaumetopoea pityocampa). Acta Physiol. Plant. 35, 3047-3058. .
Arnoux, E., Eraud, C., Navarro, N., Tougard, C., Thomas, A., Cavallo, F., et al., 2014. Morphology and genetics reveal an intriguing pattern of differentiation at a very small geographic scale in a bird species, the forest thrush Turdus lherminieri. Heredity 113, 514-525. .
Arriero, E., 2009. Rearing environment effects on immune defence in blue tit Cyanistes caeruleus nestlings. Oecologia 159, 697-704. .
Arriero, E., Moreno, J., Merino, S., Martínez, J., 2008. Habitat effects on physiological stress response in nestling blue tits are mediated through parasitism. Physiol. Biochem. Zool. 81, 195-203. .
Arriero, E., Sanz, J.J., Romero-Pujante, M., 2006. Habitat structure in Mediterranean deciduous oak forests in relation to reproductive success in the Blue Tit Parus caeruleus. Bird Study 53, 12-19. .
Banbura, J., Lambrechts, M.M., Blondel, J., Perret, P., Cartan-Son, M., 1999. Food handling time of blue tit chicks: constraints and adaptation to different prey types. J. Avian Biol. 30, 263-270. .
Bates, D., Maechler, M., Bolker, B., Walker, S., Christensen, R.H.B., Singmann, H., et al., 2020. lme4: linear mixed-effects models using “Eigen” and S4. R package version 1.1-23.
Biquet, J., Bonamour, S., de Villemereuil, P., de Franceschi, C., Teplitsky, C., 2022. Phenotypic plasticity drives phenological changes in a Mediterranean blue tit population. J. Evol. Biol. 35, 347-359. https://doir.org/10.1111/jeb.13950.
Björklund, M., 1996. Similarity of growth among great tits (Parus major) and blue tits (P. caeruleus). Biol. J. Linn. Soc. 58, 343-355. .
Blondel, J., 2007. Coping with habitat heterogeneity: the story of Mediterranean blue tits. J. Ornithol. 148, 3-15. .
Blondel, J., Aronson, J., Bodiou, J.Y., Boeuf, G., 2010. The Mediterranean Region: Biological Diversity in Space and Time. Oxford University Press, Oxford.
Blondel, J., Clamens, A., Cramm, P., Gaubert, H., Isenmann, P., 1987. Population studies on tits in the Mediterranean region. Ardea 75, 21-34.
Blondel, J., Dervieux, A., Maistre, M., Perret, P., 1991. Feeding ecology and life history variation of the blue tit in Mediterranean deciduous and sclerophyllous habitats. Oecologia 88, 9-14. .
Blondel, J., Dias, P.C., Perret, P., Maistre, M., Lambrechts, M.M., 1999. Selection-based biodiversity at a small spatial scale in a low-dispersing insular bird. Science 285, 1399-1402. .
Blondel, J., Maistre, M., Perret, P., Hurtrez-Boussès, S., Lambrechts, M.M., 1998. Is the small clutch size of a Corsican blue tit population optimal? Oecologia 117, 80-89. .
Blondel, J., Thomas, D.W., Charmantier, A., Perret, P., Bourgault, P., Lambrechts, M., 2006. A thirty-year study of phenotypic and genetic variation of blue tits in Mediterranean habitat mosaics. Bioscience 56, 661-673. .
Both, C., 1998. Experimental evidence for density dependence of reproduction in great tits. J. Anim. Ecol. 67, 667-674. .
Brommer, J.E., Pitala, N., Siitari, H., Kluen, E., Gustafsson, L., 2011. Body size and immune defense of nestling blue tits (Cyanistes caeruleus) in response to manipulation of ectoparasites and food supply. Auk 128, 556-563. .
Brouwer, L., Tinbergen, J.M., Both, C., Bristol, R., Richardson, D.S., Komdeur, J., 2009. Experimental evidence for density-dependent reproduction in a cooperatively breeding passerine. Ecology 90, 729-741. .
Camacho, C., Canal, D., Potti, J., 2013. Nonrandom dispersal drives phenotypic divergence within a bird population. Ecol. Evol. 3, 4841-4848. .
Camacho, C., Canal, D., Potti, J., 2016. Natal habitat imprinting counteracts the diversifying effects of phenotype-dependent dispersal in a spatially structured population. BMC Evol. Biol. 16, 158. .
Castaño-Vázquez, F., Martínez, J., Merino, S., Lozano, M., 2018. Experimental manipulation of temperature reduce ectoparasites in nests of blue tits Cyanistes caeruleus. J. Avian Biol. 49, e01695. .
Castaño-Vázquez, F., Schumm, Y.R., Bentele, A., Quillfeldt, P., Merino, S., 2021. Experimental manipulation of cavity temperature produces differential effects on parasite abundances in blue tit nests at two different latitudes. Int. J. Parasitol. 14, 287-297. .
Charmantier, A., Doutrelant, C., Dubuc-Messier, G., Fargevieille, A., Szulkin, M., 2016. Mediterranean blue tits as a case study of local adaptation. Evol. Appl. 9, 135-152. .
Charmantier, A., Kruuk, L.E.B., Blondel, J., Lambrechts, M.M., 2004. Testing for microevolution in body size in three blue tit populations. J. Evol. Biol. 17, 732-743. .
Charmantier, A., McCleery, R.H., Cole, L.R., Perrins, C., Kruuk, L.E.B., Sheldon, B.C., 2008. Adaptive phenotypic plasticity in response to climate change in a wild bird population. Science 320, 800-803. .
Chevin, L.M., Hoffmann, A.A., 2017. Evolution of phenotypic plasticity in extreme environments. Phil. Trans. R. Soc. B. 372, 20160138. .
Christe, P., Richner, H., Oppliger, A., 1996. Begging, food provisioning, and nestling competition in great tit broods infested with ectoparasites. Behav. Ecol. 7, 127-131. .
Dhondt, A.A., Adriaensen, F., Matthysen, E., Kempenaers, B., 1990. Nonadaptive clutch sizes in tits. Nature 348, 723-725. .
Dhondt, A.A., Kempenaers, B., Adriaensen, F., 1992. Density-dependent clutch size caused by habitat heterogeneity. J. Anim. Ecol. 61, 643-648. .
Dias, P.C., Meunier, F., Beltra, S., Cartan-Son, M., 1994. Blue tits in Mediterranean habitat mosaics. Ardea 82, 363-372.
Diaz, M., Illera, J.C., Atienza, J.C., 1998. Food resource matching by foraging tit Parus spp. during spring-summer in a Mediterranean mixed forest; evidence for an ideal free distribution. Ibis 140, 654-660. .
Edelaar, P., Bolnick, D.I., 2019. Appreciating the multiple processes increasing individual or population fitness. Trends Ecol. Evol. 34, 435-446. .
Edelaar, P., Jovani, R., Gomez-Mestre, I., 2017. Should I change or should I go? Phenotypic plasticity and matching habitat choice in the adaptation to environmental heterogeneity. Am. Nat. 190, 506-520. .
Eeva, T., Klemola, T., 2013. Variation in prevalence and intensity of two avian ectoparasites in a polluted area. Parasitology 140, 1384-1393. .
Fargallo, J.A., Johnston, R.D., 1997. Breeding biology of the bue tit Parus caeruleus in a montane Mediterranean deciduous forest: the interaction of latitude and altitude. J. Ornithol. 138, 83-92. .
Fitze, P.S., Clobert, J., Richner, H., 2004. Long-term life-history consequences of ectoparasite-modulated growth and development. Ecology 85, 2018-2026. .
Forbes, S., Thornton, S., Glassey, B., Forbes, M., Buckley, N.J., 1997. Why parent birds play favourites. Nature 390, 351-352. .
Garant, D., Kruuk, L.E.B., Wilkin, T.A., McCleery, R.H., Sheldon, B.C., 2005. Evolution driven by differential dispersal within a wild bird population. Nature 433, 60-65. .
García-Navas, V., Ferrer, E.S., Sanz, J.J., Ortego, J., 2014. The role of immigration and local adaptation on fine-scale genotypic and phenotypic population divergence in a less mobile passerine. J. Evol. Biol. 27, 1590-1603. .
García-Navas, V., Sanz, J.J., 2011. Females call the shots: breeding dispersal and divorce in blue tits. Behav. Ecol. 22, 932-939. .
Garrido-Bautista, J., Martínez-de la Puente, J., Ros-Santaella, J.L., Pintus, E., Lopezosa, P., et al., 2022a. Habitat-dependent Culicoides species composition and abundance in blue tit (Cyanistes caeruleus) nests. Parasitology 149, 1119-1128. .
Garrido-Bautista, J., Moreno-Rueda, G., Baz, A., Canal, D., Camacho, C., Cifrián, B., et al., 2020. Variation in parasitoidism of Protocalliphora azurea (Diptera: Calliphoridae) by Nasonia vitripennis (Hymenoptera: Pteromalidae) in Spain. Parasitol. Res. 119, 559-566. .
Garrido-Bautista, J., Soria, A., Trenzado, C.E., Pérez-Jiménez, A., Pintus, E., Ros-Santaella, J.L., et al., 2022b. Within-brood body size and immunological differences in blue tit (Cyanistes caeruleus) nestlings relative to ectoparasitism. Avian Res. 13, 100038. .
Garrido-Bautista, J., Soria, A., Trenzado, C.E., Pérez-Jiménez, A., Ros-Santaella, J.L., Pintus, E., et al., 2021. Oxidative status of blue tit nestlings varies with habitat and nestling size. Comp. Biochem. Physiol. A 258, 110986. https://doi.org/j.cbpa.2021.110986.
Gezelius, L., Grahn, M., Källander, H., Karlsson, J., 1984. Habitat-related differences in clutch size of the pied flycatcher Ficedula hypoleuca. Ann. Zool. Fenn. 21, 209-212.
Gil-Delgado, J.A., López, G., Barba, E., 1992. Breeding ecology of the blue tit Parus caeruleus in eastern Spain: a comparison with other localities with special reference to Corsica. Ornis Scand. 23, 444-450. .
GRASS Development Team, 2020. Geographic Resources Analysis Support System (GRASS) Software v 7.8.2. Open Source Geospatial Foundation.
Hansson, L., Fahrig, L., Merriam, G., 1995. Mosaic landscapes and ecological processes. Chapman and Hall, London.
Haywood, S., Perrins, C.M., 1992. Is clutch size in birds affected by environmental conditions during growth? Proc. R. Soc. A B 249, 195–197. .
Heeb, P., Kolliker, M., Richner, H., 2000. Bird-ectoparasite interactions, nest humidity, and ectoparasite community structure. Ecology 81, 958-968. .
Heske, E.J., Robinson, S.K., Brawn, J.D., 1999. Predator activity and predation on songbird nests on forest-field edges in east-central Illinois. Landsc. Ecol. 14, 345-354. .
Huhta, E., Jokimäki, J., Rahko, P., 1998. Distribution and reproductive success of the Pied Flycatcher Ficedula hypoleuca in relation to forest patch size and vegetation characteristics; the effect of scale. Ibis 140, 214-222. .
Hurtrez-Boussès, S., de Garine-Wichatitsky, M., Perret, P., Blondel, J., Renaud, F., 1999. Variations in prevalence and intensity of blow fly infestations in an insular Mediterranean population of blue tits. Can. J. Zool. 77, 337-341. .
Hurtrez-Boussès, S., Perret, P., Renaud, F., Blondel, J., 1997. High blowfly parasitic loads affect breeding success in a Mediterranean population of blue tits. Oecologia 112, 514-517. .
Johnson, L.S., Albrecht, D.J., 1993. Effects of haematophagous ectoparasites on nestling house wrens, Troglodytes aedon: who pays the cost of parasitism? Oikos 66, 255-262. .
Lambrechts, M.M., Caro, S., Charmantier, A., Gross, N., Galan, M-J., Perret, P., et al., 2004. Habitat quality as a predictor of spatial variation in blue tit reproductive performance: a multi-plot analysis in a heterogeneous landscape. Oecologia 141, 555-561. .
Lemel, J., 1989. Habitat distribution in the great tit Parus major in relation to reproductive success, dominance, and biometry. Ornis Scand. 20, 226-233.
Lemoine, M., Doligez, B., Richner, H., 2012. On the equivalence of host local adaptation and parasite maladaptation: an experimental test. Am. Nat. 179, 270-281. .
Liou, L.W., Price, T., Boyce, M.S., Perrins, C.M., 1993. Fluctuating environments and clutch size evolution in great tits. Am. Nat. 141, 507-516. .
Mägi, M., Mänd, R., 2004. Habitat differences in allocation of eggs between successive breeding attempts in great tits (Parus major). Ecoscience 11, 361-369. .
Mägi, M., Mänd, R., Tamm, H., Sisask, E., Kilgas, P., Tilgar, V., 2009. Low reproductive success of great tits in the preferred habitat: a role of food availability. Ecoscience 16, 145-157. .
Martin, T.E., 1987. Food as a limit on breeding birds: a life-history perspective. Annu. Rev. Ecol. Systemat. 18, 453-487. .
Martin, T.E., Møller, A.P., Merino, S., Clobert, J., 2001. Does clutch size evolve in response to parasites and immunocompetence? Proc. Natl. Acad. Sci. USA 98, 2071-2076. .
Martínez-de la Puente, J., Martínez, J., Rivero-de Aguilar, J., Herrero, J., Merino, S., 2011. On the specificity of avian blood parasites: revealing specific and generalist relationships between haemosporidians and biting midges. Mol. Ecol. 20, 3275-3287. .
Martínez-de la Puente, J., Merino, S., Lobato, E., Rivero-de Aguilar, J., del Cerro, S., Ruiz-de-Castañeda, R., et al., 2009. Does weather affect biting fly abundance in avian nests? J. Avian Biol. 40, 653-657. .
Martínez-de la Puente, J., Merino, S., Lobato, E., Rivero-de Aguilar, J., del Cerro, S., Ruiz-de-Castaneda, R., et al., 2010. Nest-climatic factors affect the abundance of biting flies and their effects on nestling condition. Acta Oecol. 36, 543-547. .
Mennerat, A., Charmantier, A., Perret, P., Hurtrez-Bousses, S., Lambrechts, M.M., 2021. Parasite intensity is driven by temperature in a wild bird. Peer Commun. J. 1, e60. .
Merilä, J., Björklund, M., Bennett, G.F., 1995. Geographic and individual variation in haematozoan infections in the greenfinch, Carduelis chloris. Can. J. Zool. 73, 1798-1804. .
Merino, S., Potti, J., 1995. Mites and blowflies decrease growth and survival in nestling pied flycatchers. Oikos 73, 95-103. .
Møller, A.P., 1988. Nest predation and nest site choice in passerine birds in habitat patches of different size: a study of magpies and blackbirds. Oikos 53, 215-221.
Møller, A.P., Adriaensen, F., Artemyev, A., Bańbura, J., Barba, E., Biard, C., et al., 2014. Clutch-size variation in Western Palaearctic secondary hole-nesting passerine birds in relation to nest box design. Method. Ecol. Evol. 5, 353-362. .
Moreno-Rueda, G., 2003. Seleccion de cajas-nido por aves insectivoras en Sierra Nevada. Zool. Baetica 13/14, 131-138.
Moreno-Rueda, G., 2021. Elevational patterns of blowfly parasitism in two hole nesting avian species. Diversity 13, 591. .
Morris, A.J., Gilroy, J.J., 2008. Close to the edge: predation risks for two declining farmland passerines. Ibis 150, 168-177. .
Nevo, E., 2006. “Evolution Canyon”: a microcosm of life’s evolution focusing on adaptation and speciation. Isr. J. Ecol. Evol. 52, 485-506. .
Nevo, E., 2009. Evolution in action across life at “Evolution Canyons”, Israel. Trends Evol. Biol. 1, 12-34. .
Nevo, E., 2012. “Evolution Canyon,” a potential microscale monitor of global warming across life. Proc. Natl. Acad. Sci. USA 109, 2960-2965. .
Nour, N., Currie, D., Matthysen, E., Van Damme, R., Dhondt, A.A., 1998. Effects of habitat fragmentation on provisioning rates, diet and breeding success in two species of tit (great tit and blue tit). Oecologia 114, 522-530. .
Nur, N., 1984a. The consequences of brood size for breeding blue tits II. Nestling weight, offspring survival and optimal brood size. J. Anim. Ecol. 53, 497-517. .
Nur, N., 1984b. The consequences of brood size for breeding blue tits I. Adult survival, weight change and the cost of reproduction. J. Anim. Ecol. 53, 479-496. https://doi.org/10.2307/2409238.
Orshan, G., 1989. Plant Pheno-morphological Studies in Mediterranean Type Ecosystems. Springer Netherlands, Dordrecht.
Ortego, J., García-Navas, V., Ferrer, E.S., Sanz, J.J., 2011. Genetic structure reflects natal dispersal movements at different spatial scales in the blue tit, Cyanistes caeruleus. Anim. Behav. 82, 131-137. .
Perrins, C.M., 1979. British Tits. Collins, Glasgow.
Perrins, C.M., Moss, D., 1975. Reproductive rates in the great tit. J. Anim. Ecol. 44, 695-706. .
Pettifor, R.A., 1993. Brood-manipulation experiments. I. The number of offspring surviving per nest in blue tits (Parus caeruleus). J. Anim. Ecol. 62, 131-144. .
Pettifor, R.A., Perrins, C.M., McCleery, R.H., 1988. Individual optimization of clutch size in great tits. Nature 336, 160-162. .
Pettifor, R.A., Perrins, C.M., McCleery, R.H., 2001. The individual optimization of fitness: variation in reproductive output, including clutch size, mean nestling mass and offspring recruitment, in manipulated broods of great tits Parus major. J. Anim. Ecol. 70, 62-79. .
Pettorelli, N., Vik, J.O., Mysterud, A., Gaillard, J-M., Tucker, C.J., Stenseth, N.C., 2005. Using the satellite-derived NDVI to assess ecological responses to environmental change. Trends Ecol. Evol. 20, 503-510. .
Pimentel, C., Nilsson, J.-Å., 2007. Breeding patterns of great tits (Parus major) in pine forests along the Portuguese west coast. J. Ornithol. 148, 59-68. .
Pinheiro, J., Bates, D., DebRoy, S., Sarkar, D., R Core Team, 2019. Nlme: linear and Nonlinear mixed effects models. R package version 3.1-141.
Pitala, N., Siitari, H., Gustafsson, L., Brommer, J.E., 2009. Ectoparasites help to maintain variation in cell-mediated immunity in the blue tit-hen flea system. Evol. Ecol. Res. 11, 79-94. https://doi.org/.
Porlier, M., Charmantier, A., Bourgault, P., Perret, P., Blondel, J., Garant, D., 2012. Variation in phenotypic plasticity and selection patterns in blue tit breeding time: between- and within-population comparisons. J. Anim. Ecol. 81, 1041-1051. .
Postma, E., van Noordwijk, A.J., 2005. Gene flow maintains a large genetic difference in clutch size at a small spatial scale. Nature 433, 65-68. .
Potti, J., 2008. Blowfly infestation at the nestling stage affects egg size in the pied flycatcher Ficedula hypoleuca. Acta Ornithol. 43, 76-82. .
Príncipe, A., Nunes, A., Pinho, P., Aleixo, C., Neves, N., Branquinho, C., 2022. Local-scale factors matter for tree cover modelling in Mediterranean drylands. Sci. Total Environ. 831, 154877. .
Przybylo, R., Sheldon, B.C., Merilä, J., 2000. Climatic effects on breeding and morphology: evidence for phenotypic plasticity. J. Anim. Ecol. 69, 395-403. .
Puchala, P., 2004. Detrimental effects of larval blow flies (Protocalliphora azurea) on nestlings and breeding success of tree sparrows (Passer montanus). Can. J. Zool. 82, 1285-1290. .
QGIS Development Team, 2020. QGIS Geographic Information System v. 3.10.5. Open Source Geospatial Foundation.
R Development Core Team, 2020. R: A language and environment for statistical computing.
Riddington, R., Gosler, A.G., 2008. Differences in reproductive success and parental qualities between habitats in the Great Tit Parus major. Ibis 137, 371-378. .
Rózsa, L., Reiczigel, J., Majoros, G., 2000. Quantifying parasites in samples of hosts. J. Parasitol. 86, 228-232. .
Sanz, J.J., 1998. Effect of habitat and latitude on nestling diet of pied flycatchers Ficedula hypoleuca. Ardea 86, 81-88. .
Schlicht, E., Kempenaers, B., 2015. Immediate effects of capture on nest visits of breeding blue tits, Cyanistes caeruleus, are substantial. Anim. Behav. 105, 63-78. .
Seki, S-I., Takano, H., 1998. Caterpillar abundance in the territory affects the breeding performance of great tit Parus major minor. Oecologia 114, 514-521. .
Senar, J.C., Borras, A., Cabrera, J., Cabrera, T., Björklund, M., 2006. Local differentiation in the presence of gene flow in the citril finch Serinus citrinella. Biol. Lett. 2, 85-87. .
Sillett, T.S., Rodenhouse, N.L., Holmes, R.T., 2004. Experimentally reducing neighbor density affects reproduction and behavior of a migratory songbird. Ecology 85, 2467-2477. .
Slatkin, M., 1987. Gene flow and the geographic structure of natural populations. Science 236, 787-792. .
Sparrow, A.D., 1999. A heterogeneity of heterogeneities. Trends Ecol. Evol. 14, 422-423. .
Stearns, S.C., 1992. The Evolution of Life Histories. Oxford University Press, New York.
Stenning, M., 2018. The blue tit, first ed. Bloomsbury Publishing Plc, London.
Stenning, M.J., 2008. Hatching asynchrony and brood reduction in blue tits Cyanistes caeruleus may be a plastic response to local oak Quercus robur bud burst and caterpillar emergence. Acta Ornithol. 43, 97-106. .
Tilgar, V., Mand, R., Leivits, A., 1999. Effect of calcium availability and habitat quality on reproduction in Pied Flycatcher Ficedula hypoleuca and Great Tit Parus major. J. Avian Biol. 30, 383. .
Tomás, G., Merino, S., Martínez-De La Puente, J., Moreno, J., Morales, J., Lobato, E., 2008a. A simple trapping method to estimate abundances of blood-sucking flying insects in avian nests. Anim. Behav. 75, 723-729. .
Tomás, G., Merino, S., Martínez-De la Puente, J., Moreno, J., Morales, J., Lobato, E., 2008b. Determinants of abundance and effects of blood-sucking flying insects in the nest of a hole-nesting bird. Oecologia 156, 305-312. .
Tomás, G., Zamora-Muñoz, C., Martín-Vivaldi, M., Barón, M.D., Ruiz-Castellano, C., Soler, J.J., 2020. Effects of chemical and auditory cues of hoopoes (Upupa epops) in repellence and attraction of blood-feeding flies. Front. Ecol. Evol. 8, 579667. .
Tremblay, I., Thomas, D., Blondel, J., Perret, P., Lambrechts, M.M., 2005. The effect of habitat quality on foraging patterns, provisioning rate and nestling growth in Corsican blue tits Parus caeruleus. Ibis 147, 17-24. .
Tremblay, I., Thomas, D.W., Lambrechts, M.M., Blondel, J., Perret, P., 2003. Variation in blue tit breeding performance across gradients in habitat richness. Ecology 84, 3033-3043. .
Trevail, A.M., Green, J.A., Bolton, M., Daunt, F., Harris, S.M., Miller, P.I., et al., 2021. Environmental heterogeneity promotes individual specialisation in habitat selection in a widely distributed seabird. J. Anim. Ecol. 90, 2875-2887. .
Tripet, F., Richner, H., 1997. Host responses to ectoparasites: food compensation by parent blue tits. Oikos 78, 557-561. .
Tye, A., 1992. Assessment of territory quality and its effects on breeding success in a migrant passerine, the wheatear Oenanthe oenanthe. Ibis 134, 273-285. .
van Balen, J.H., 1973. A comparative study of the breeding ecology of the great tit Parus major in different habitats. Ardea 55, 1-93. .
Vaugoyeau, M., Adriaensen, F., Artemyev, A., Banbura, J., Bańbura, E., Biard, C., et al., 2016. Interspecific variation in the relationship between clutch size, laying date and intensity of urbanization in four species of hole-nesting birds. Ecol. Evol. 6, 5907-5920. .
Votýpka, J., Oborník, M., Volf, P., Svobodová, M., Lukeš, J., 2002. Trypanosoma avium of raptors (Falconiformes): phylogeny and identification of vectors. Parasitology 125, 253-263. .
Wickman, H., 2016. ggplot2: elegant graphics for data analysis. Springer-Verlag, New York.
Ziane, N., Chabi, Y., Lambrechts, M.M., 2006. Breeding performance of blue tits Cyanistes caeruleus ultramarinus in relation to habitat richness of oak forest patches in north-eastern Algeria. Acta Ornithol. 41, 163-169. .
Zuur, A.F., Ieno, E.N., Elphick, C.S., 2010. A protocol for data exploration to avoid common statistical problems: data exploration. Method. Ecol. Evol. 1, 3-14. .
Zuur, A.F., Ieno, E.N., Walker, N., Saveliev, A.A., Smith, G.M., 2009. Mixed Effects Models and Extensions in Ecology with R. Statistics for Biology and Health. Springer, New York.
Table
1.
Results of the linear mixed-effects models (LMM) for clutch size, brood size and number of fledglings for the Blue Tit (Cyanistes caeruleus) population in the Sierra Nevada National Park, southern Spain, with the prevalence of different ectoparasites: blowflies, fleas, biting midges and black flies.
Predictor
Dependent variable
Clutch size
Brood size
Number of fledglings
Wald χ2
df
p-value
Wald χ2
df
p-value
Wald χ2
df
p-value
Models for nest-dwelling ectoparasites
Forest
17.73
3
<0.001
15.52
3
0.001
17.56
3
<0.001
Year
54.50
1
<0.001
24.48
1
<0.001
16.25
1
<0.001
Laying date
41.86
1
<0.001
18.47
1
<0.001
16.22
1
<0.001
Blowflies
0.33
1
0.56
2.92
1
0.09
3.03
1
0.08
Fleas
0.08
1
0.77
2.31
1
0.13
5.42
1
0.02
Models for flying ectoparasites
Forest
13.25
3
0.004
14.43
3
0.002
7.61
3
0.050
Year
19.06
1
<0.001
10.86
1
<0.001
7.89
1
0.005
Laying date
1.16
1
0.28
0.69
1
0.41
0.63
1
0.43
Biting midges
0.64
1
0.42
3.25
1
0.07
0.30
1
0.58
Black flies
0.42
1
0.51
0.91
1
0.34
0.95
1
0.33
Statistical significance was set at p < 0.05 (marked in bold).
Table
2.
Reproductive parameters for Blue Tits (Cyanistes caeruleus) and biometric measurements of Blue Tit nestlings in four forest types in the Sierra Nevada National Park, southern Spain.
Parameter
Holm Oak
Dry Pyrenean Oak
Scots Pine
Humid Pyrenean Oak
Laying date
a
19.56 ± 0.72 (25)
15.25 ± 0.91 (60)
21.16 ± 0.64 (25)
14.57 ± 0.99 (61)
Clutch size
7.42 ± 0.11 (26)
6.89 ± 0.14 (62)
5.88 ± 0.07 (25)
7.74 ± 0.14 (61)
Brood size
5.72 ± 0.18 (25)
5.39 ± 0.18 (62)
5.04 ± 0.13 (25)
6.35 ± 0.19 (60)
Number of fledglings
5.08 ± 0.21 (26)
4.58 ± 0.20 (59)
4.44 ± 0.14 (25)
5.92 ± 0.19 (61)
Hatching success (%)
92.00 ± 0.02 (25)
93.55 ± 0.02 (62)
96.00 ± 0.01 (25)
95.00 ± 0.02 (60)
Number of unhatched eggs
1.72 ± 0.18 (25)
1.50 ± 0.17 (62)
0.84 ± 0.09 (25)
1.26 ± 0.13 (60)
Number of eggs that failed to produce a fledgling
2.34 ± 0.21 (26)
2.22 ± 0.18 (59)
1.44 ± 0.13 (25)
1.82 ± 0.15 (61)
% eggs that produced fledglings
b
81.74 ± 0.01 (22)
76.20 ± 0.02 (52)
81.10 ± 0.02 (23)
81.08 ± 0.02 (57)
Fledging success (%)
84.62 ± 0.03 (26)
88.14 ± 0.02 (59)
92.00 ± 0.02 (25)
93.44 ± 0.02 (61)
Nestling body mass (g)
9.79 ± 0.05 (76)
9.83 ± 0.05 (145)
9.47 ± 0.05 (47)
10.09 ± 0.04 (176)
Nestling tarsus length (mm)
16.52 ± 0.03 (76)
16.44 ± 0.03 (144)
16.25 ± 0.03 (47)
16.47 ± 0.03 (176)
Reproductive parameters include data for 2017 and 2018, but nestling biometry is for 2017 only. The table shows the mean values, standard error and sample size (n) in parentheses. a 0 = day the first egg was laid each year. b Nests without fledglings (predated, deserted, etc.) were excluded.

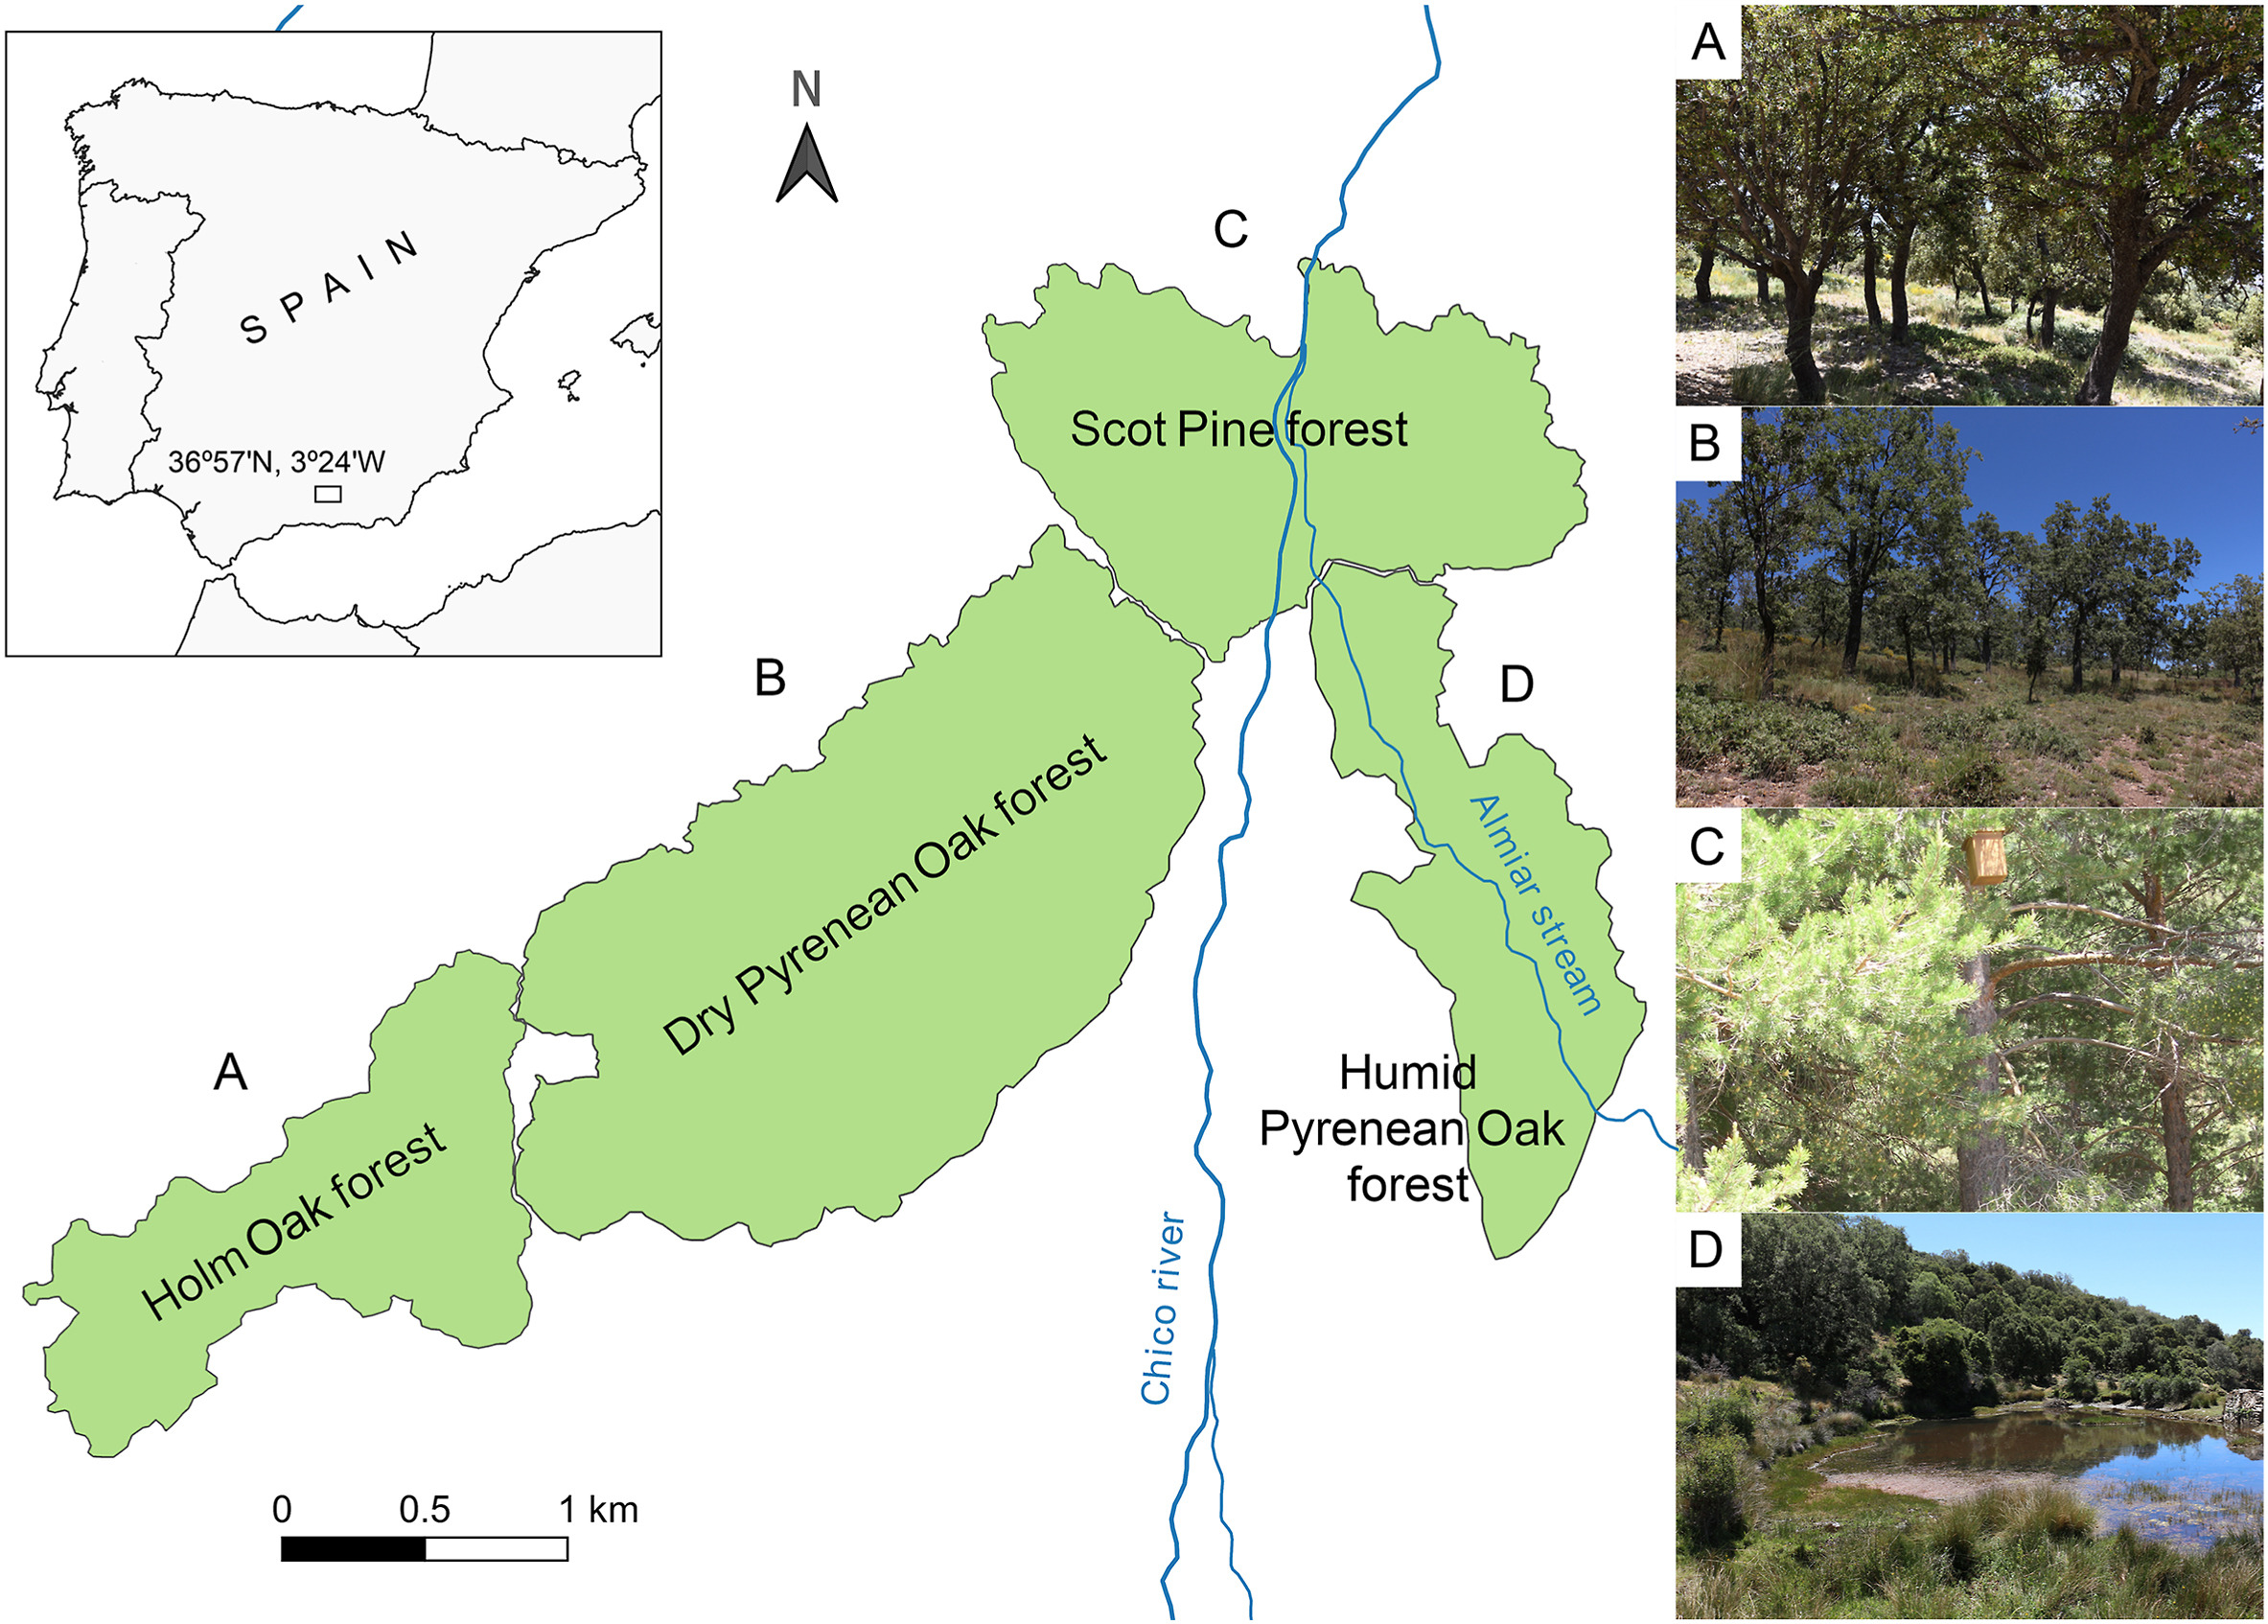
 DownLoad:
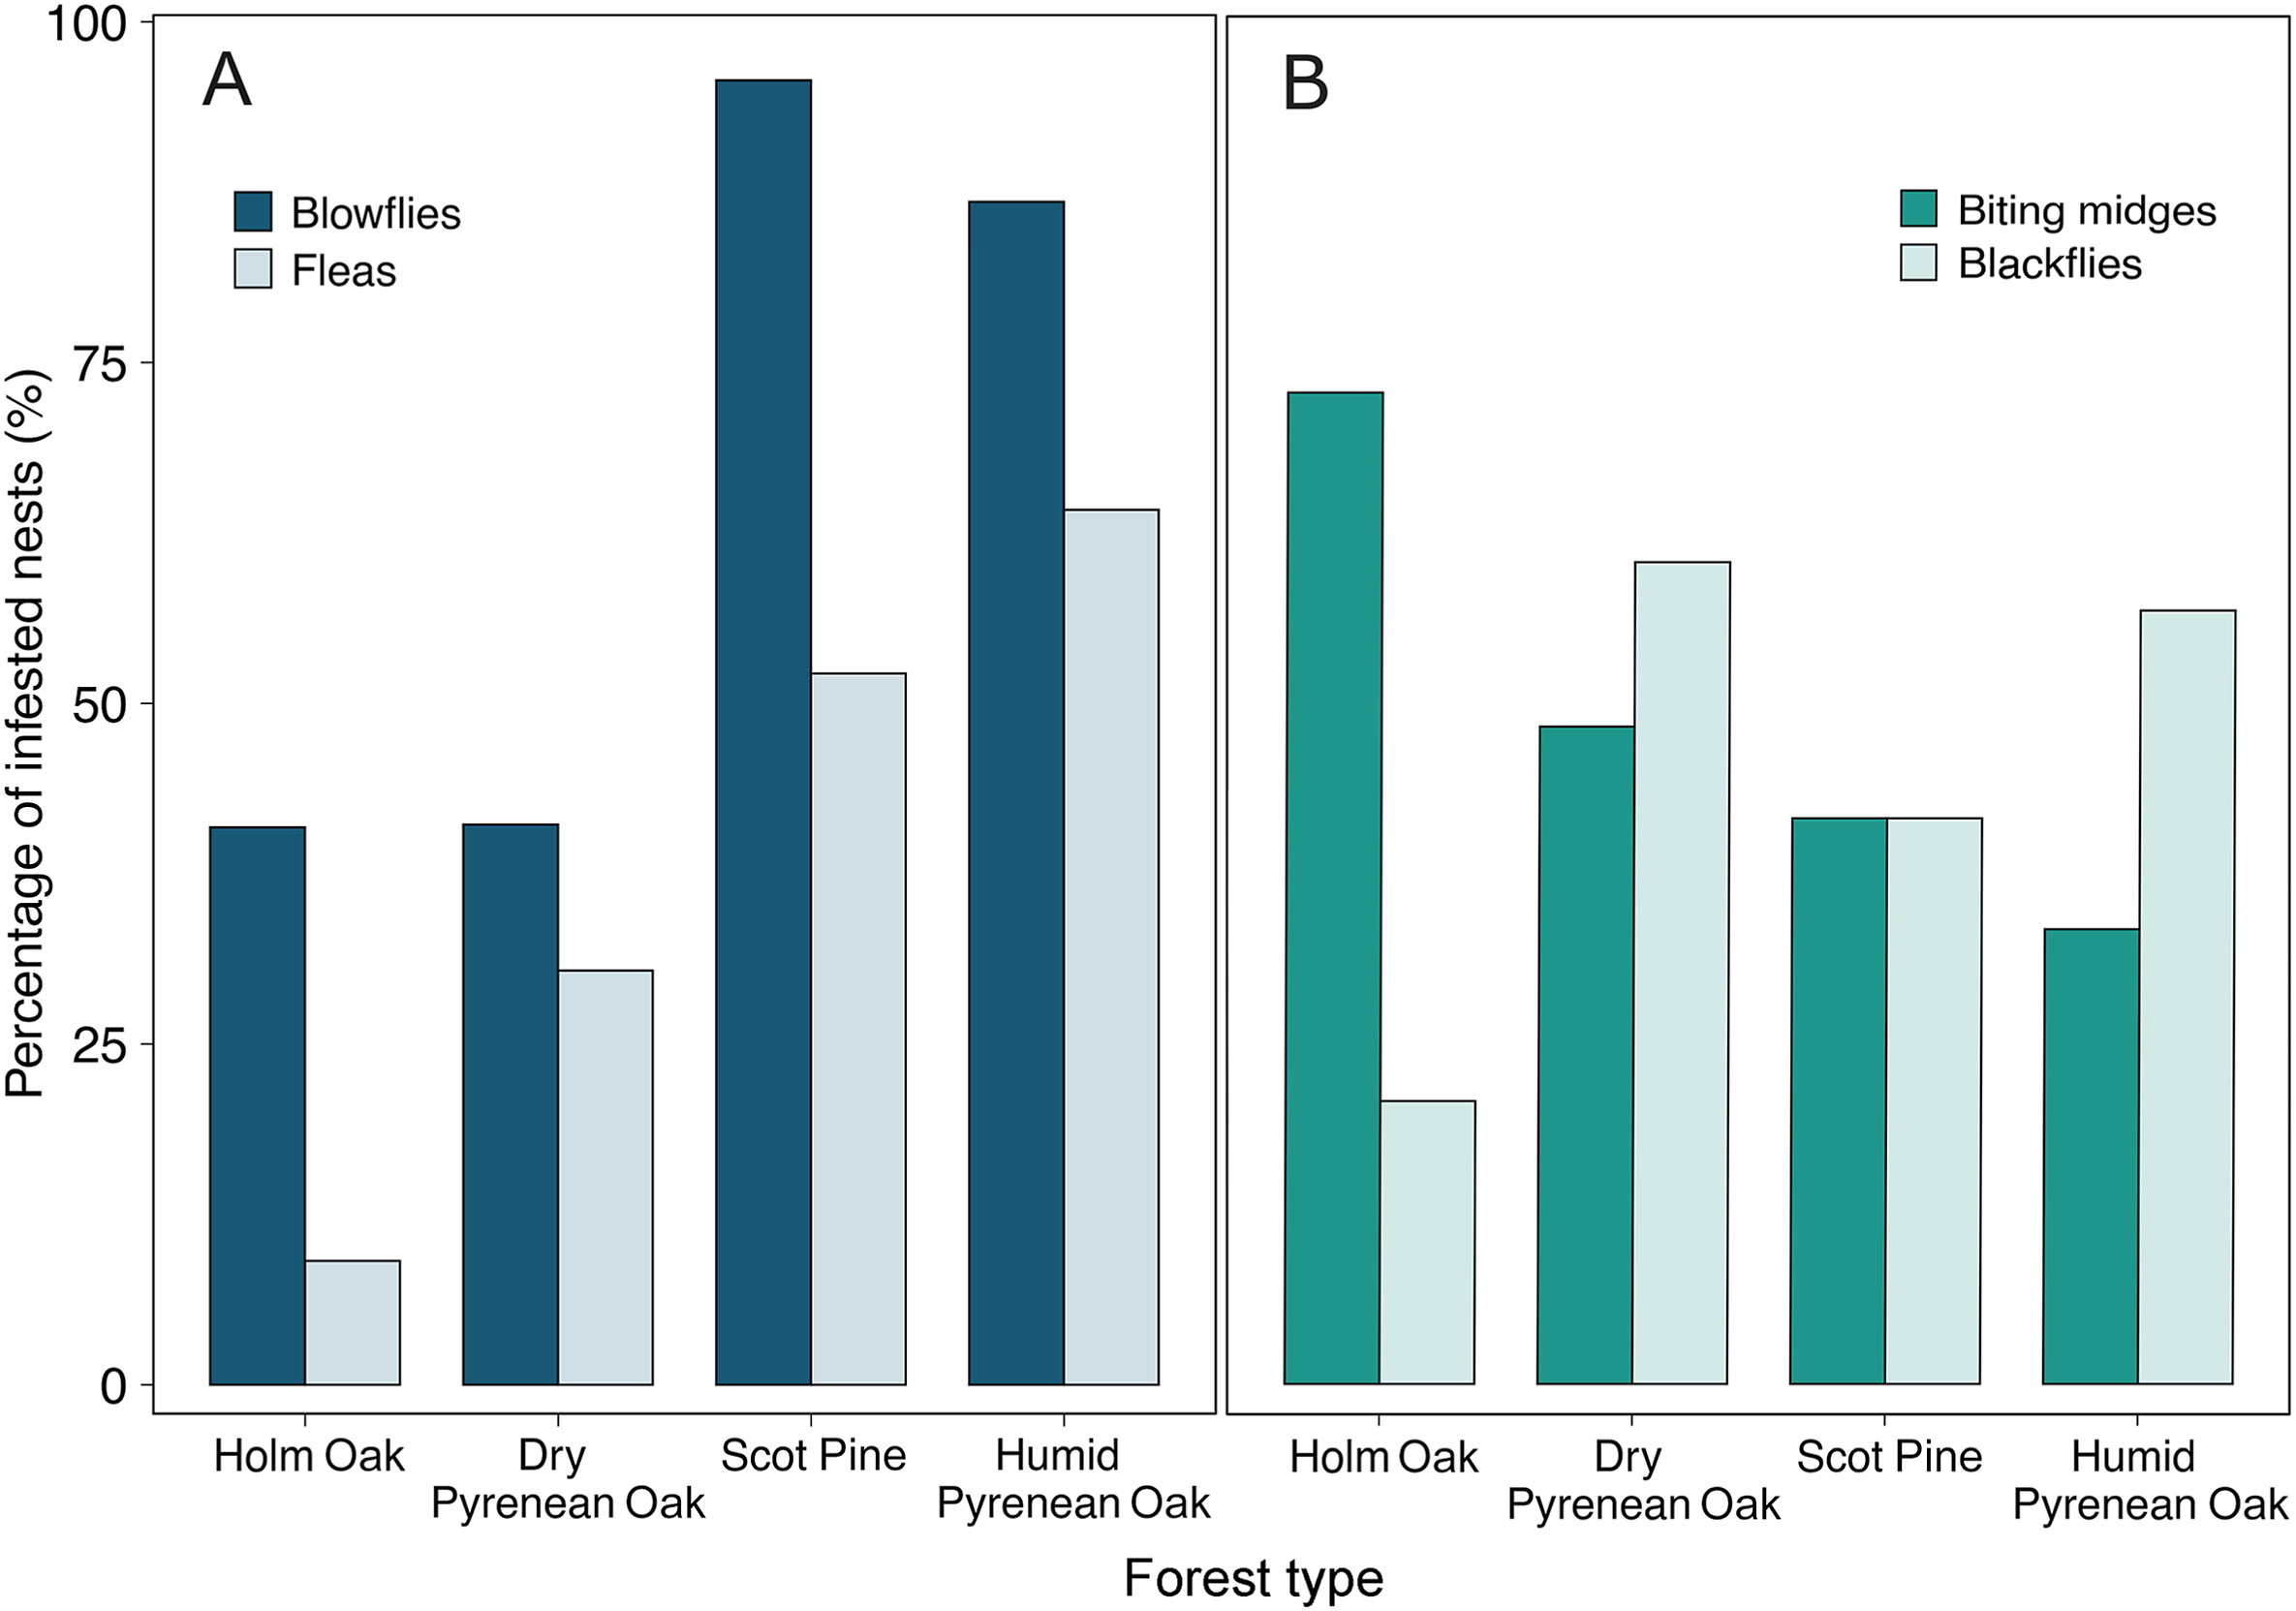
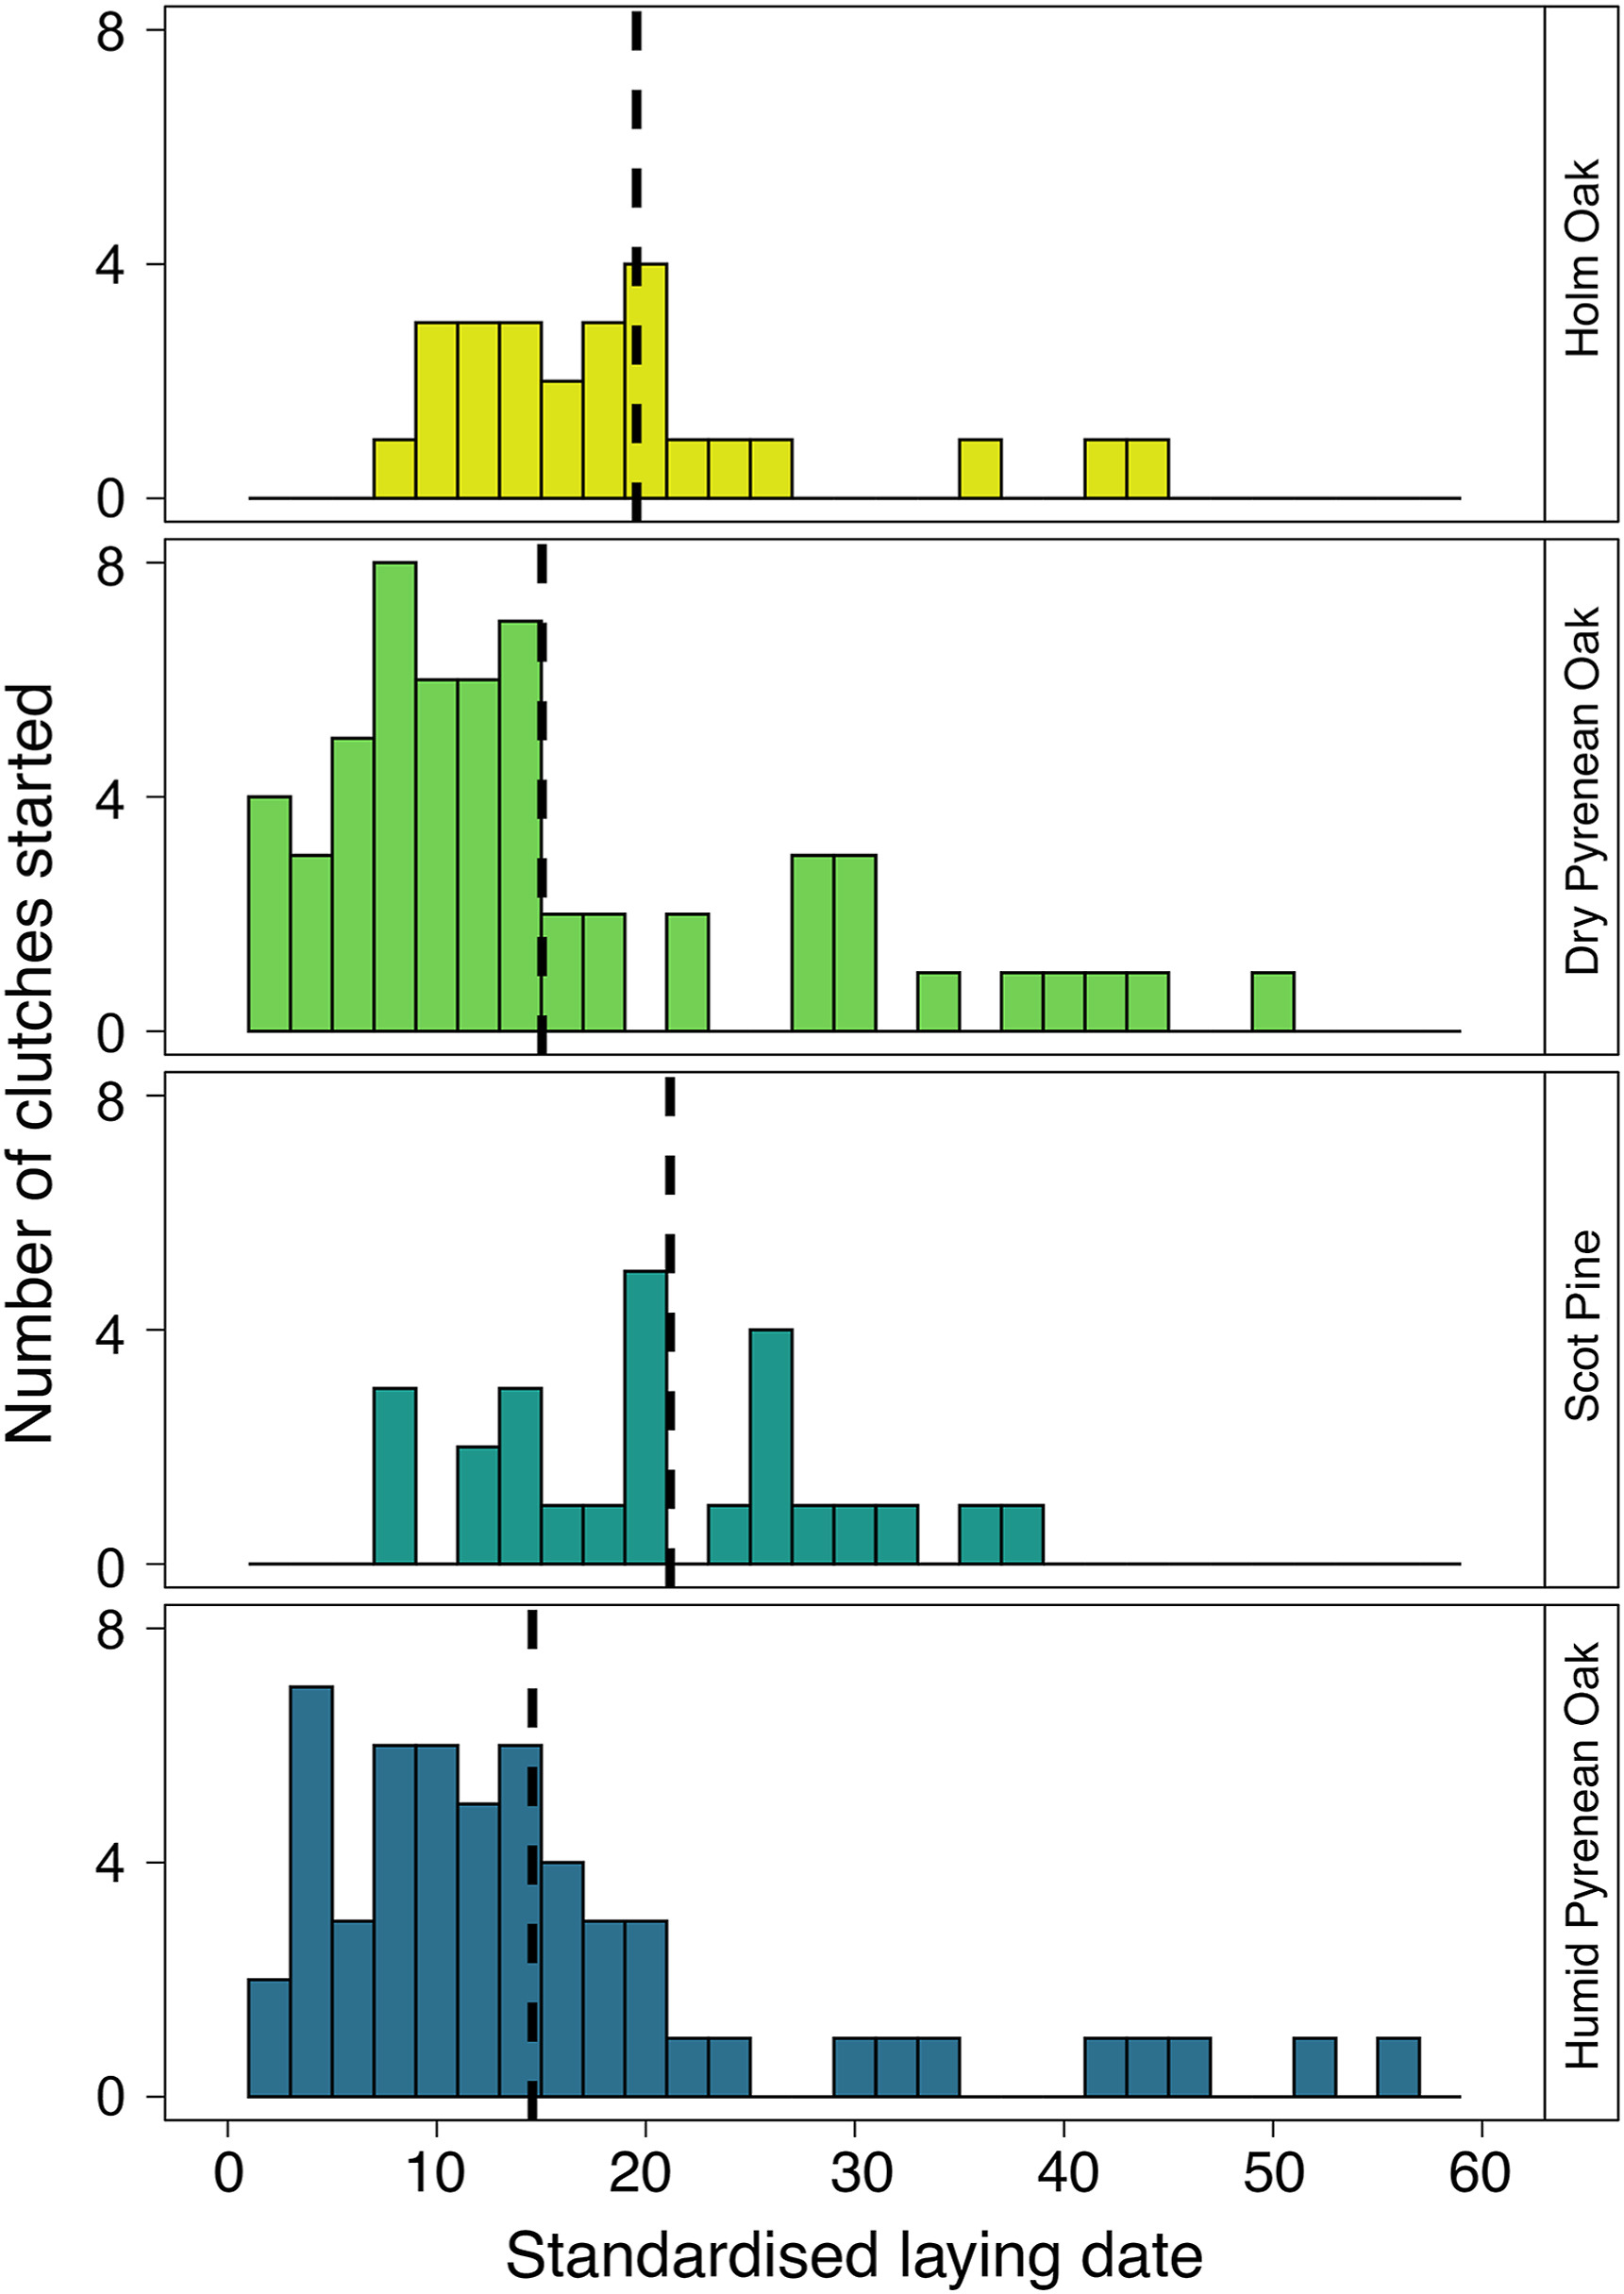
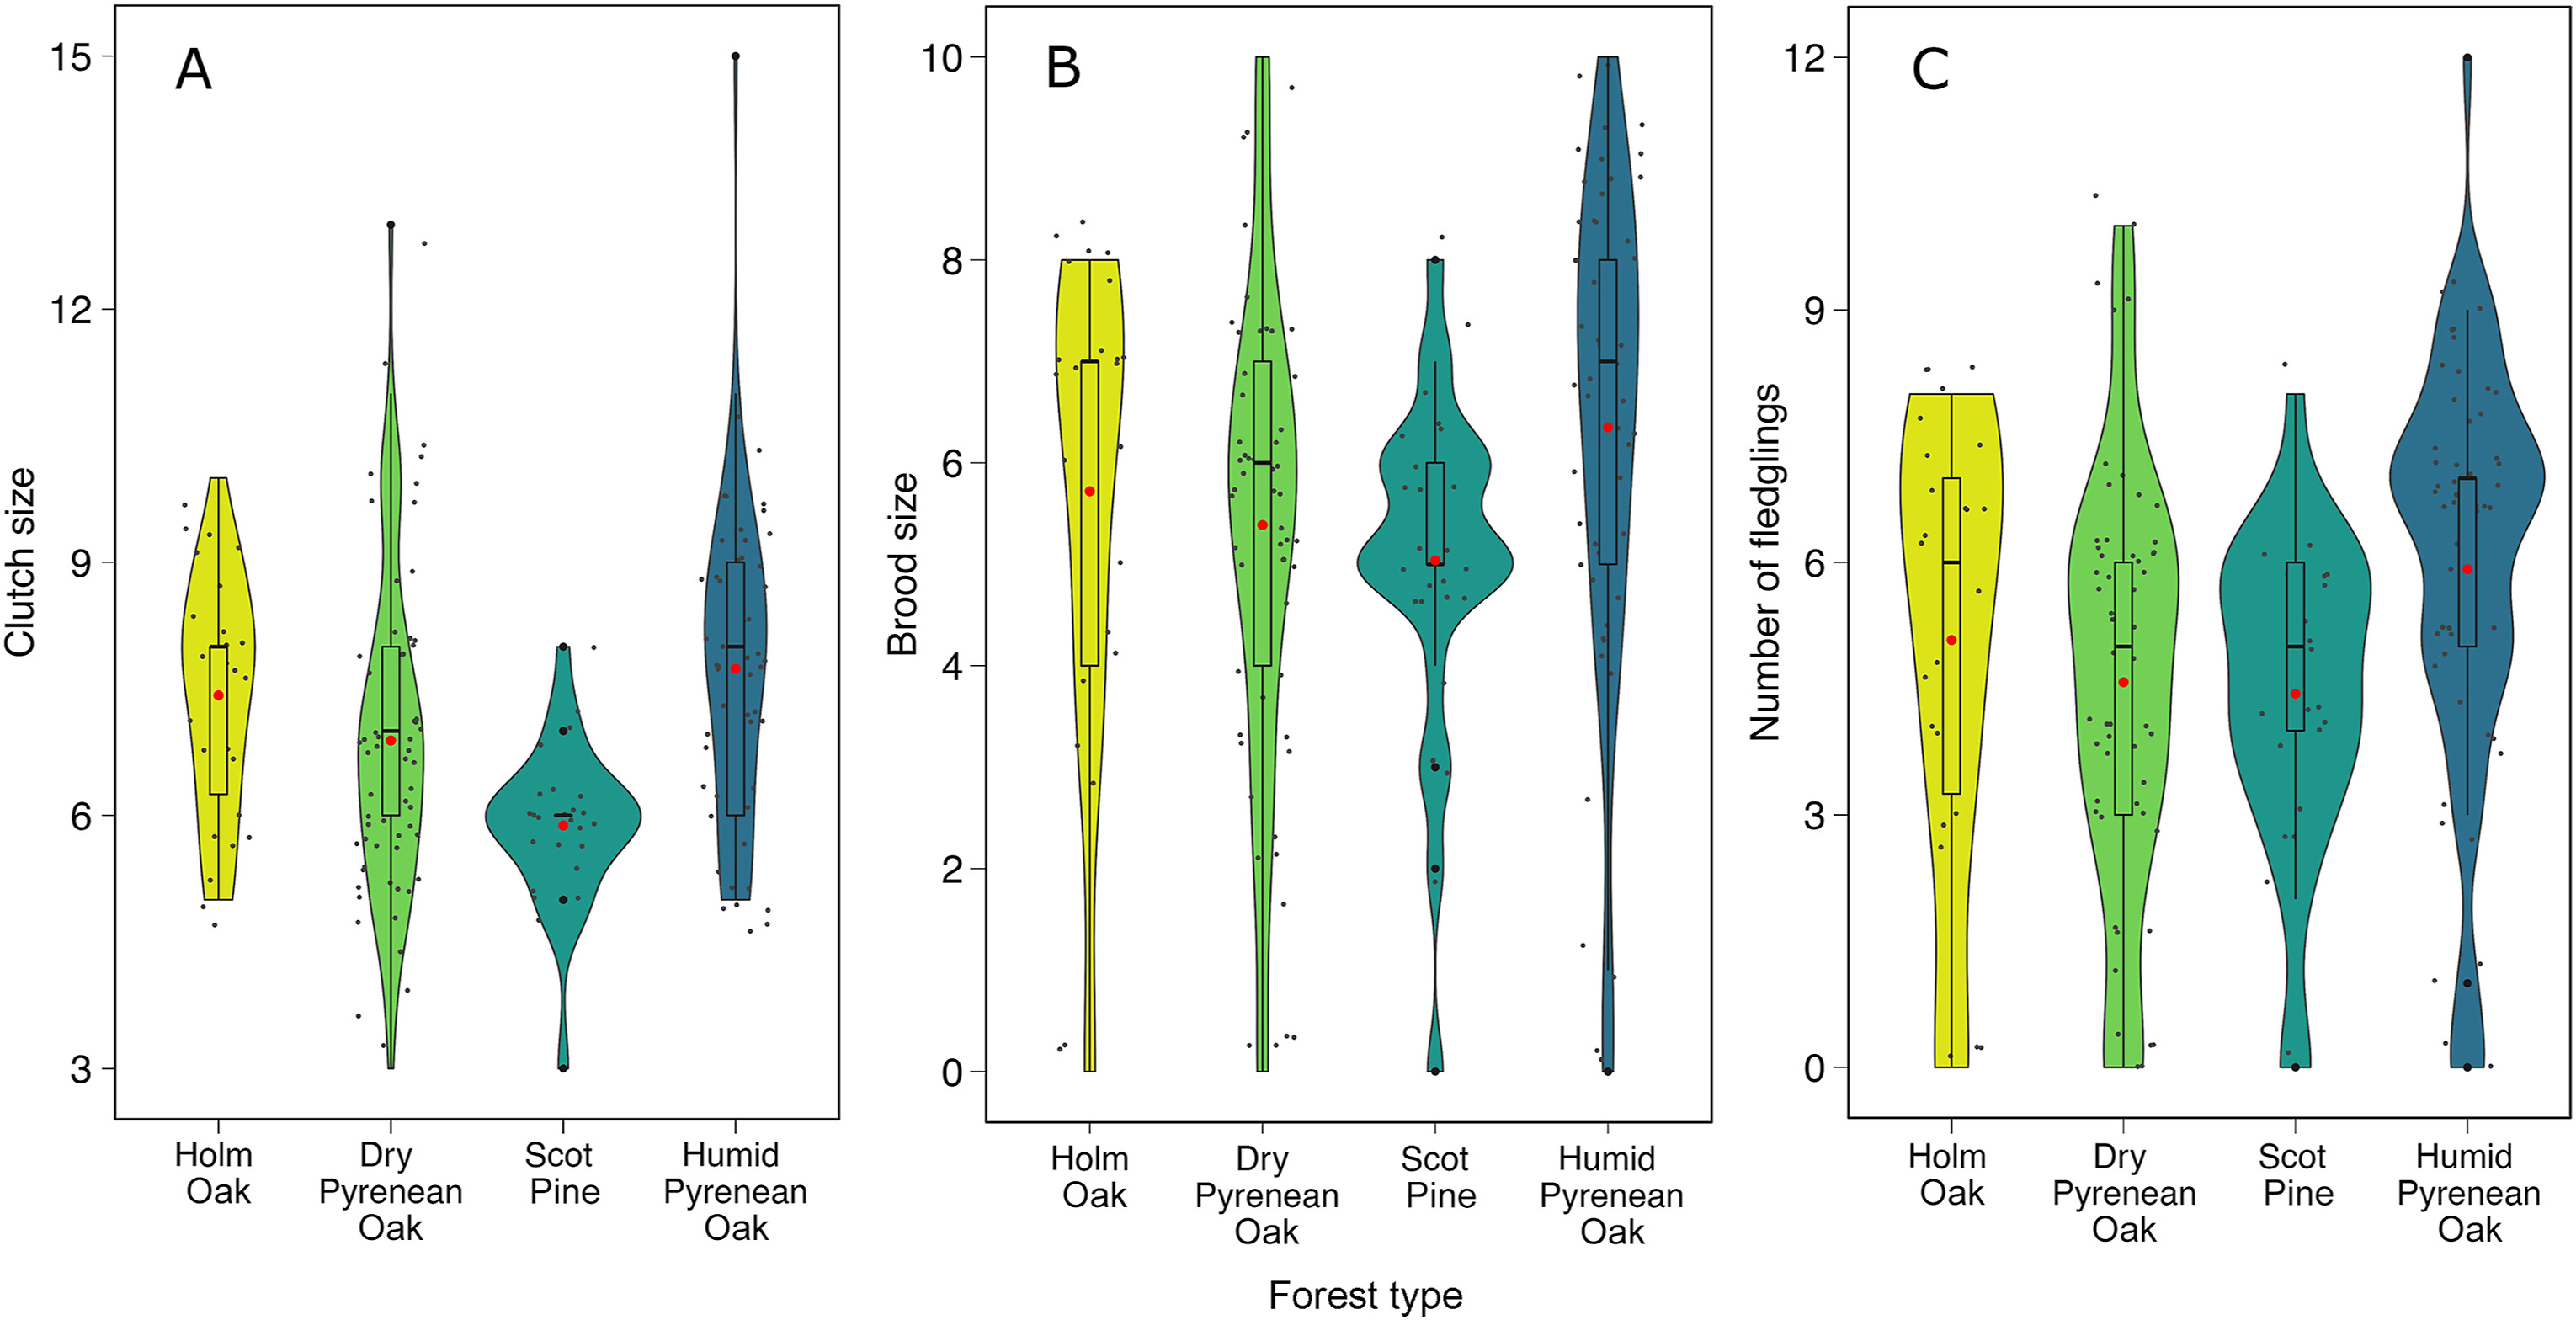


 Email Alerts
 RSS Feeds