Urbanization brings new selection pressures to wildlife living in cities, and changes in the life-history traits of urban species can reflect their responses to such pressures. To date, most of the studies investigating the impacts of urbanization on avian life-history traits are conducted in Europe and North America, while such studies are often lacking in quickly developing countries in Asia (e.g., China). In this study, we examined the variations in reproductive life-history traits of Chinese Bulbuls (Pycnonotus sinensis) along the urbanization gradient in Hangzhou, China. We detected 234 natural nests of Chinese Bulbuls and continuously monitored them in two continuous breeding seasons from 2012 to 2013. We collected data on seven life-history traits (laying date, incubation period, nestling period, clutch size, egg volume, hatching success rate, and fledging success rate). We used infrared cameras to record the number of feedings per hour as the measure of food resources for the nestlings. We measured nest predation pressure by monitoring 148 natural breeding nests during breeding seasons and 54 artificial nests immediately after breeding seasons. We then calculated the urbanization synthetic index (USI) as a measure of the level of urbanization and examined its relationship with the seven life-history traits. We found that Chinese Bulbuls laid eggs significantly earlier with increasing USI. However, the other six life-history traits did not vary significantly with the USI. Moreover, the feeding frequency of chicks increased significantly with the USI, but the nest predation pressure of Chinese Bulbuls decreased significantly with the USI. Increased food resources and reduced nest predation pressure in cities may lead to earlier laying date of Chinese Bulbuls. Further study should test whether the earlier laying date of Chinese Bulbuls is the result of phenotypic plasticity or genetic change.
Urbanization is a global active research field involving extreme land-use change (Ibáñez-Álamo and Soler, 2010). The replacement of large numbers of natural habitats and rapid increase in human populations put enormous pressures on the survival of organisms in urban environments (Miller and Hobbs, 2002). For example, artificial light at night may disorient migrating birds (van Doren et al., 2017); traffic noise can reduce signal transmission efficiency and social connectivity between Red-backed Fairywren (Malurus melanocephalus) (Hawkins et al., 2020); changes brought about by the urban heat island effect may change bird migratory habits (Tryjanowski et al., 2013). It is important to study how species cope with the changes in the survival pressures brought about by urbanization.
Urbanization brings new selection pressures to wildlife (Shochat et al., 2006; Partecke et al., 2006; Lowry et al., 2013), which often led to corresponding changes in life-history traits of wild animals in cities. Life history is the whole process of development and reproduction process experienced by organisms throughout their lifetime, which can well reflect the changes in species adaptability (Martin, 2004). Investigating birds’ life history helps reveal the relationship between birds and the environment and their place and roles in the ecosystem (Sepp et al., 2017), which may have important implications for the protection of birds (Wang et al., 2021). To date, there are many studies investigating the impacts of urbanization on avian life-history traits (Chamberlain et al., 2009; Sepp et al., 2017; Kettel et al., 2018; Capilla-Lasheras et al., 2022). However, most of these studies were conducted in Europe and North America (Chamberlain et al., 2009), while such studies are often lacking in quickly developing countries in Asia (e.g., China).
Many factors in cities can affect the life history of birds, with food restrictions being the most common one (Lack, 1947; Martin, 1987, 2004). Many studies have identified food restrictions as a critical factor in explaining the diversity of life history (Castro et al., 2003; de Neve et al., 2004; Benharzallah et al., 2022; Kumar et al., 2022). Most studies often found that birds tend to lay more eggs when food is plentiful but have a smaller clutch size when food is scarce (Millon et al., 2008; Chamberlain et al., 2009). Increased artificial food in cities can make urban birds less afraid of humans and reduce their defense against predators (Feng and Liang, 2020). Artificial food can also affect potential nest predators, posing a risk of predation for birds (Hanmer et al., 2017). The higher food supply causes the Florida Scrub-Jay (Aphelocoma coerulescens) to breed earlier and alter bird physiology (Bridge et al., 2009). However, food restriction during the nestling rearing period has a strong negative impact on the breeding success of urban Great Tits (Parus major) (Seress et al., 2020).
Nest predation pressure is also considered as one of the essential factors influencing the life-history traits of urban birds (Roper et al., 2010; Young et al., 2017). Nest predation is one of the main reasons influencing bird reproductive failure (Ricklefs, 1969; Chen et al., 2022), and thus helps shape the life history of birds (Robinson et al., 2000; Nana et al., 2014). Nest predation pressure may increase or decrease in cities (Vincze et al., 2017). For example, artificial night illumination can increase the ability of predators to detect prey in dark conditions (Gaston et al., 2013). In addition, nest predation pressure affects the investment choices of parent birds for reproduction and survival (Ghalambor and Martin, 2001). When nest predation pressure is too high, parent birds may reduce the visitation rates to reduce the risk by not attracting the predator's attention (Ghalambor and Martin, 2000), which may change certain life-history traits, such as incubation period. However, in some urban areas where predation pressure is lower than in other rural habitats (Chen et al., 2022), birds can increase nesting success rates such as hatching success rate and fledging success rate (Morgan et al., 2011).
Birds are one of the most commonly studied taxa in urbanization studies (Chamberlain et al., 2009; Yang et al., 2020; Patankar et al., 2021). Numerous studies have explored the adaptation of bird species to urbanization, including the Chinese Bulbul (Pycnonotus sinensis; Wang et al., 2009; Chen et al., 2022). Previous studies found Chinese Bulbuls can adapt to urbanization by changing nest materials (Wang et al., 2009), using artificial human food (Wang, 2003), and changing flushing distance in the city (Wang et al., 2004). However, so far, it is unclear whether and how Chinese Bulbuls change life-history traits in cities to adapt to urbanization.
In this study, we monitored 234 breeding nests of Chinese Bulbuls to examine the changes in life-history traits along the urbanization gradient in Hangzhou, China. We addressed the following three questions: (1) How did the seven life-history traits of Chinese Bulbuls (laying date, incubation period, nestling period, clutch size, egg volume, hatching success rate, and fledging success rate) vary with urbanization? (2) Whether the two selective pressure factors, food restrictions and nest predation pressure, varied with urbanization? (3) How did food restrictions and nest predation pressure affect the life-history traits of Chinese Bulbuls?
2.
Methods
2.1
Study area
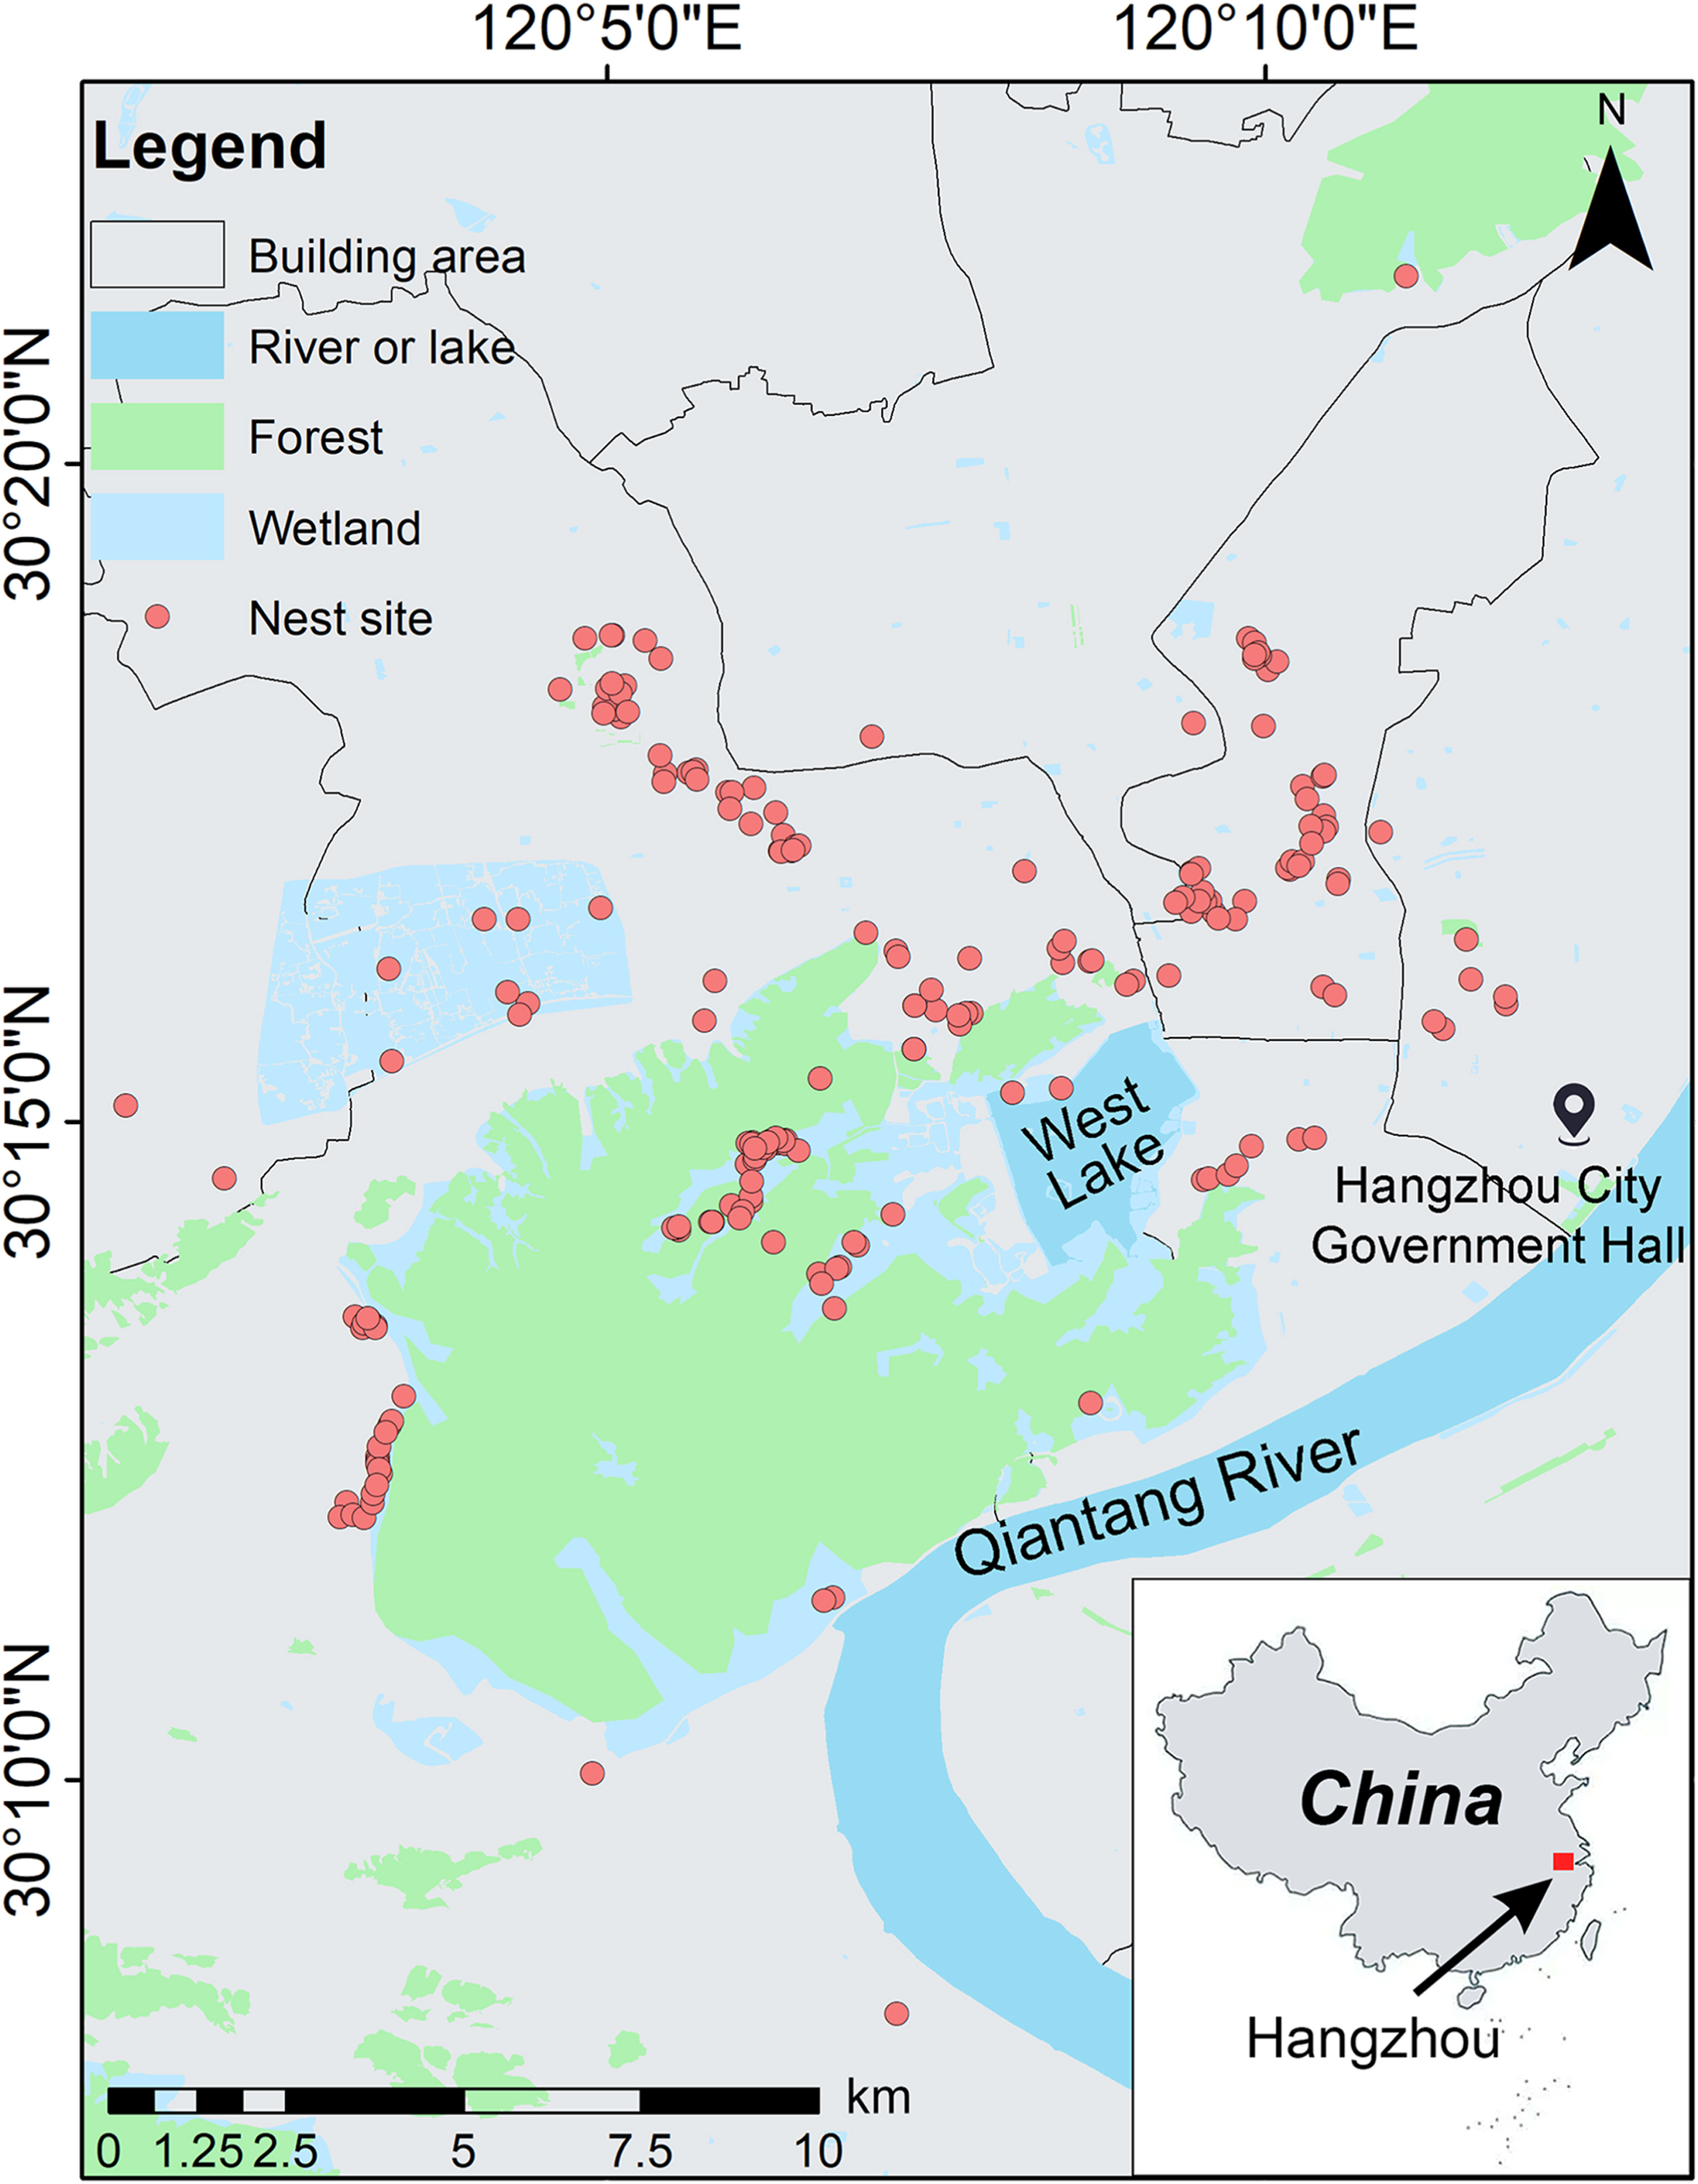
We conducted this study in the city of Hangzhou (29°11′–30°33′ N, 118°21′–120°30′ E), Zhejiang Province, China (Fig. 1). Hangzhou is the economic and cultural center of Zhejiang Province and one of the most urbanized cities in the Yangtze River Delta region of China (Wang et al., 2008). Our study sites cover an area of 774.82 km2 and has a total population of 3.614 million by 2019 (http://www.hangzhou.gov.cn/). The urban human population of Hangzhou accounted for 78.5% of the total population, suggesting a high urbanization rate. The city is covered with hills, plains and water systems (e.g., rivers, lakes and ponds), representing 65.6%, 26.4% and 8.0% of the total area, respectively (Chen et al., 2000).
Figure
1.
Distribution map of the nest sites of the Chinese Bulbul (Pycnonotussinensis) in Hangzhou, China.
From March to July in 2012 and 2013, we searched natural breeding nests of Chinese Bulbuls along the urbanization gradient in Hangzhou, from urban centers with dense buildings to western mountains with an excellent natural environment (Fig. 1). Whether Chinese Bulbuls begun to reproduce was determined by listening to the chirps and observing the behavior of carrying nest materials with a telescope. The nests of Chinese Bulbuls were identified according to their nest-site selection (Wang, 2003; Chen et al., 2006), favorite nesting trees (e.g., Osmanthus trees) (Lan et al., 2013), and the emergence of nesting materials (Wang et al., 2009). After locating a breeding nest, we recorded its position with the GPS and marked it on the nest tree for further monitoring. The nests are usually 2–4 m above the ground and are made of hay stems, fine roots, and plant fibers in a tall cup (Zhuge, 1990).
2.3
Life-history data collection
2.3.1
Breeding time
We started observing breeding behaviors of Chinese Bulbuls in mid-March (Lan et al., 2013). When courtship behavior was found, we recorded it and started looking for the nests. Depending on the finding time of the nest, the laying date, incubation period, nestling period, and departure time were recorded. The laying date began on the date when the first egg was laid, and one egg was usually laid in the early hours in the morning every day. The earliest and latest laying date recorded in 2012 was April 9 and May 30, respectively. In 2013, the earliest laying time was April 1, while the latest date was June 4. The incubation period was counted from the first day after laying the last egg to the time when the first chick hatched successfully (Ibáñez-Álamo and Soler, 2010). The nestling period was defined as the time when the first chick hatched until the fledging date.
2.3.2
Clutch size and egg volume
We defined clutch size as the number of eggs laid in each nest (Bailly et al., 2015). The Chinese Bulbul usually lays one egg per day, and the clutch size is often 3–4 (Zhuge, 1990). Therefore, after finding the breeding nest of Chinese Bulbuls, we tracked the number of eggs in its nest for at least four days. We measured the eggs within two days after the end of egg spawning. We wore gloves to complete the measurement process to reduce the potential human impacts. We weighed the eggs using a spring weighing with a measuring range of 10 g and a minimum scale of 0.1 g (Lan et al., 2013). The weight of fresh bird eggs can only be determined when spawning because the eggs gradually become weightless by water vapor diffusion (Drent, 1970). Therefore, we use the volume of the egg, rather than egg mass, to quantify the egg size. We measured the long and short radii of the eggs with Vernier calipers, accurate to the millimeter. Egg volume was then calculated using the formula: Volume (V) = Kv × mean egg length × mean egg width2, in which Kv is the volume coefficient (Hoyt, 1979). We conducted egg measurements when parent birds were not in the nests (Zhang, 2014).
2.3.3
Reproduction rate
During each time of nest monitoring, we determined whether the eggs were hatched or preyed upon, and whether the chicks were missing or dead (Lan et al., 2013; Zhang, 2014). We calculated the reproduction rate after the end of breeding for each nest. The hatching success rate was calculated as the number of hatchlings divided by the clutch size. The fledging success rate is defined as the number of fledglings divided by the number of hatchlings (Corsini et al., 2017).
2.4
Food resources and nestling feedings
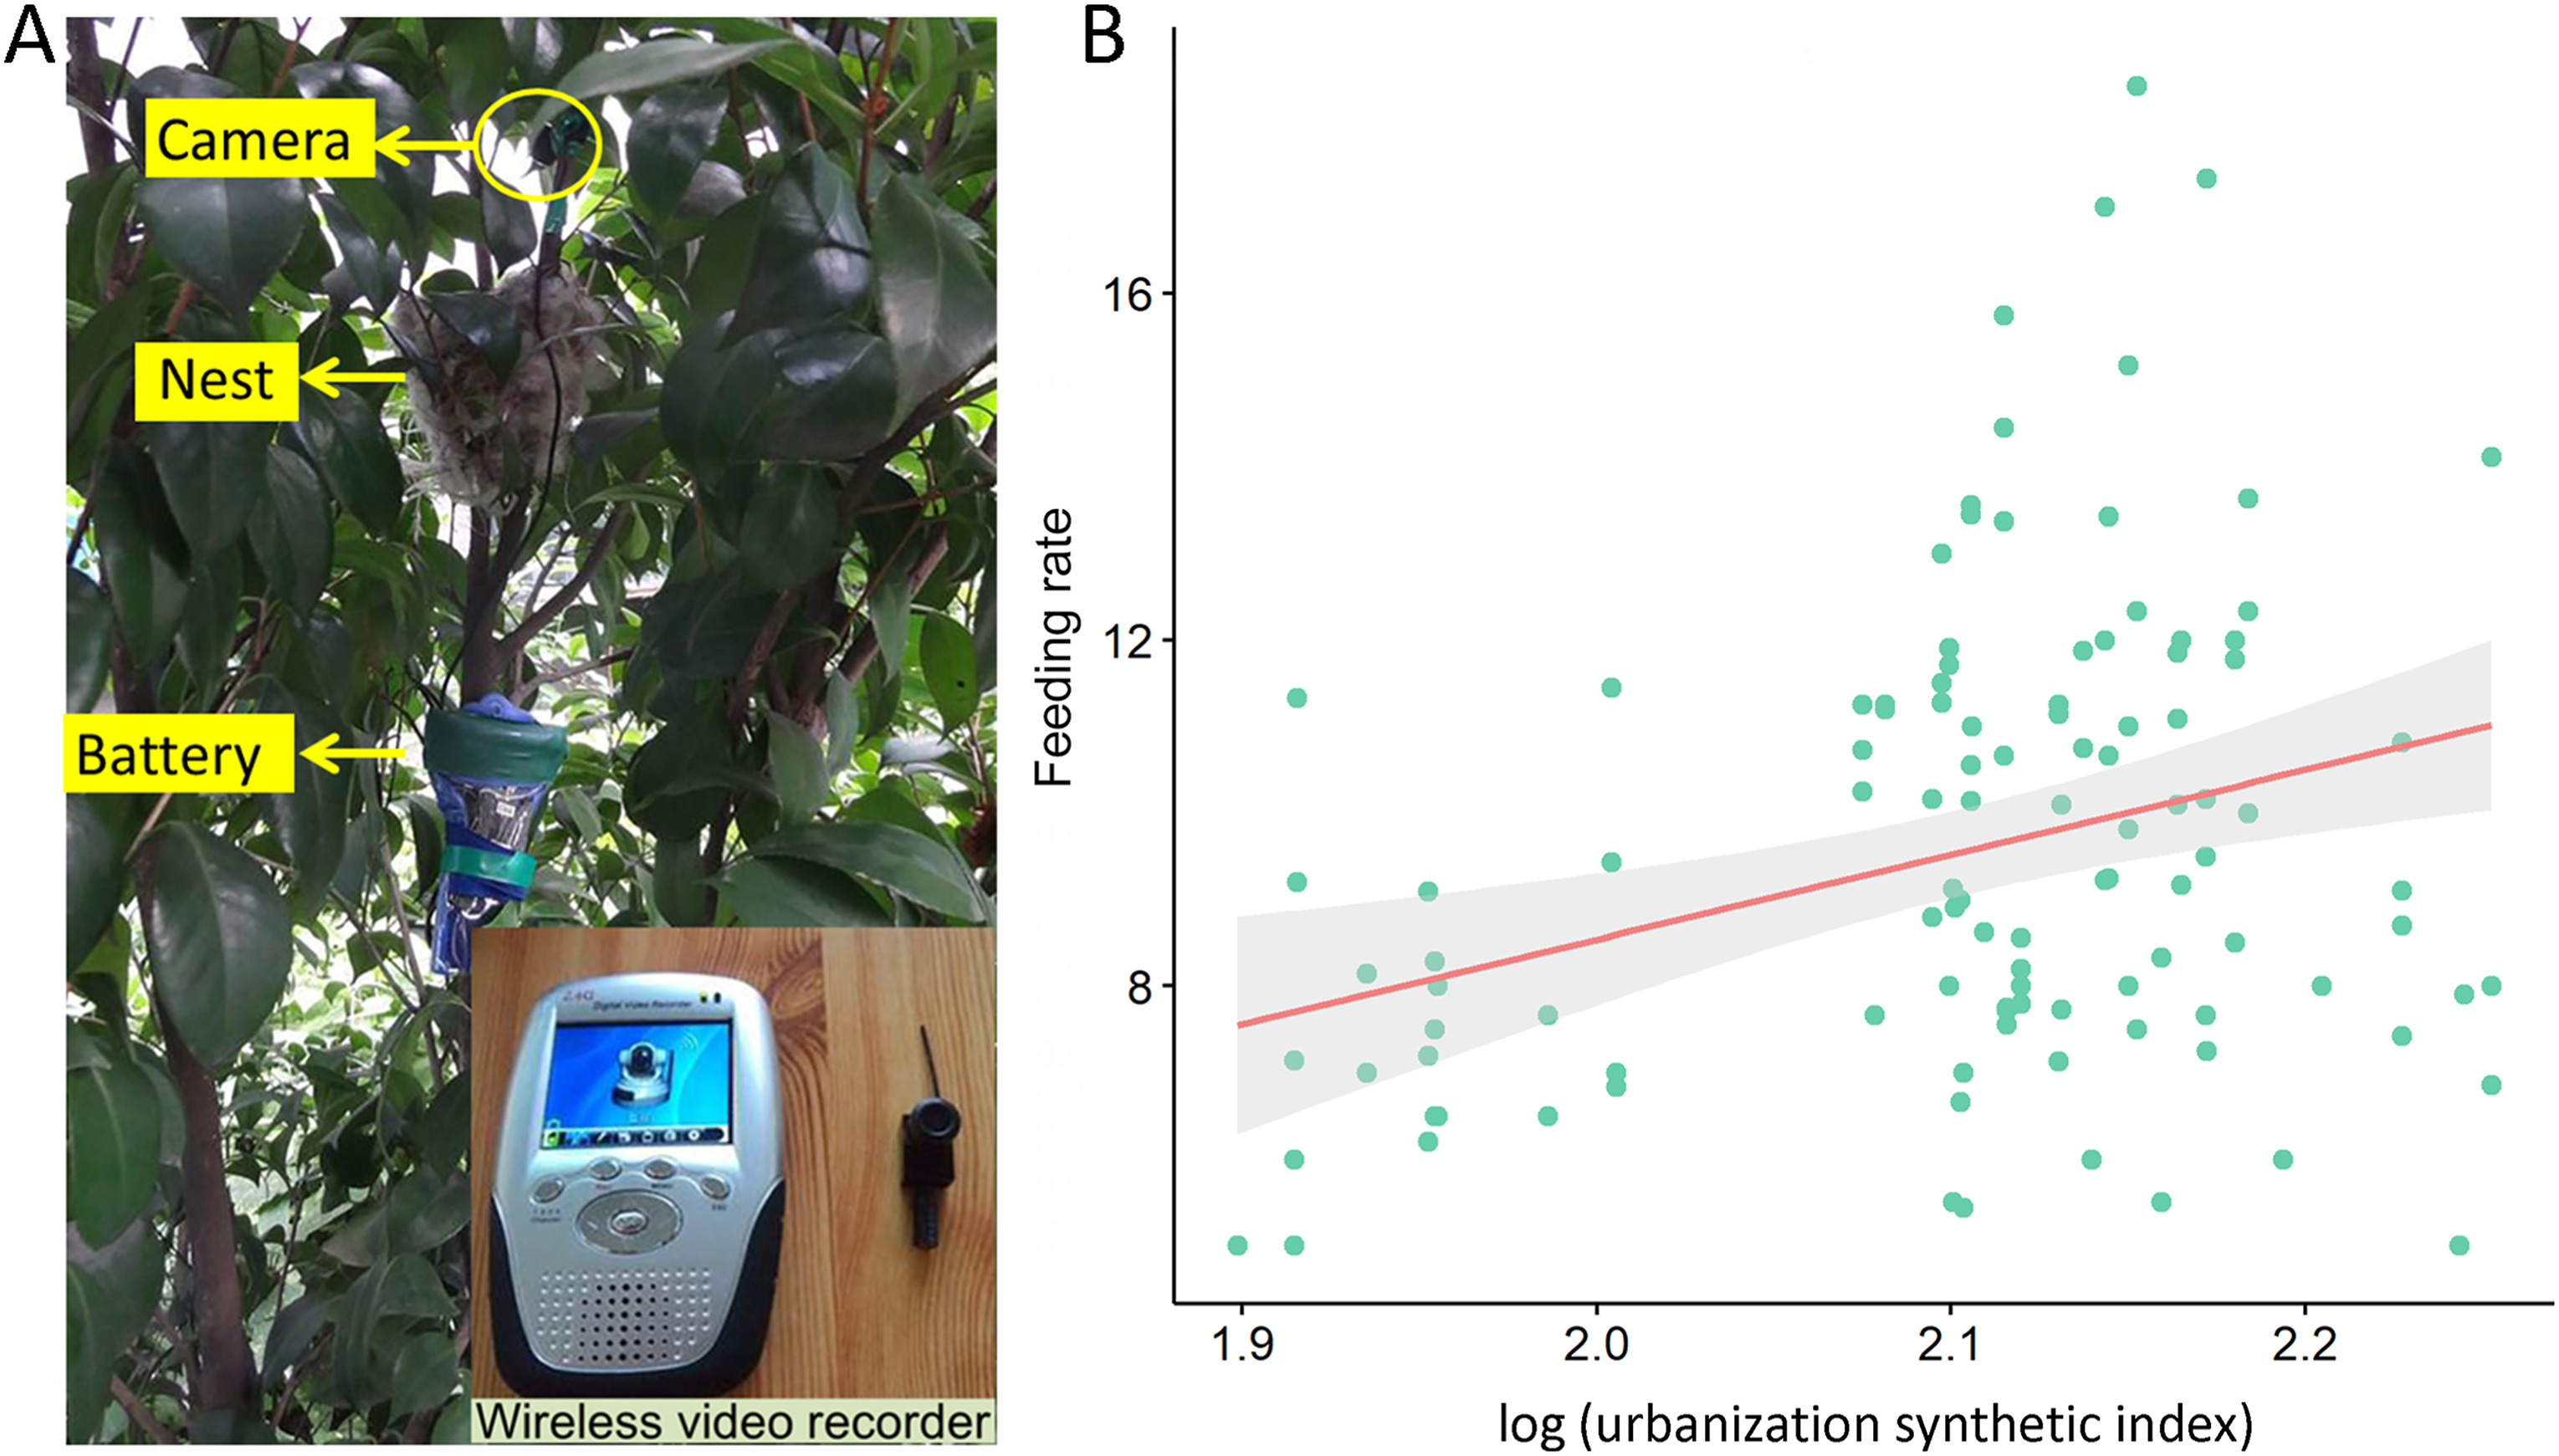
After the hatching of chicks, we used infrared cameras to record the number of feedings and food types for the selected 31 nests that were distributed along the urbanization gradient in Hangzhou (Zhang, 2014). We installed a camera 10–15 cm above the nest and connected it with green tape and branches to make it easier for the parent birds to accept this radio receiver (Fig. 2A). We videotaped the feeding activities of parent birds at the age of 3, 6, 9, and 12 days of the chicks for 12 consecutive days. However, we stopped video recording if the chicks in the nests were died or were preyed upon.
Figure
2.
(A) Schematic of camera monitoring of feeding events of Chinese Bulbuls; (B) Relationship between the feeding rate of parent birds and the urbanization synthetic index (USI).
When the video recording was over, we organized and analyzed the content of the video. We recorded the number and type of feedings in hourly increments and obtained the number of feedings and food types per day. We divided all the food types into four general types, i.e., animal, plant, artificial, and unknown foods. The animal foods included beetles, spiders, dragonflies, butterflies, moths, caterpillars, etc. Plant foods specifically included cinnamon seeds, cherries, mulberries, and other plant fruits. There were also some artificial foods such as bread crumbs. The other food cannot be classified as the above three types were grouped as unknown foods. When bad weather or other reasons that caused the abnormal feeding activities of parent birds (e.g., nestling died), we excluded these abnormal data (Zhang, 2014).
2.5
Nest predation survey
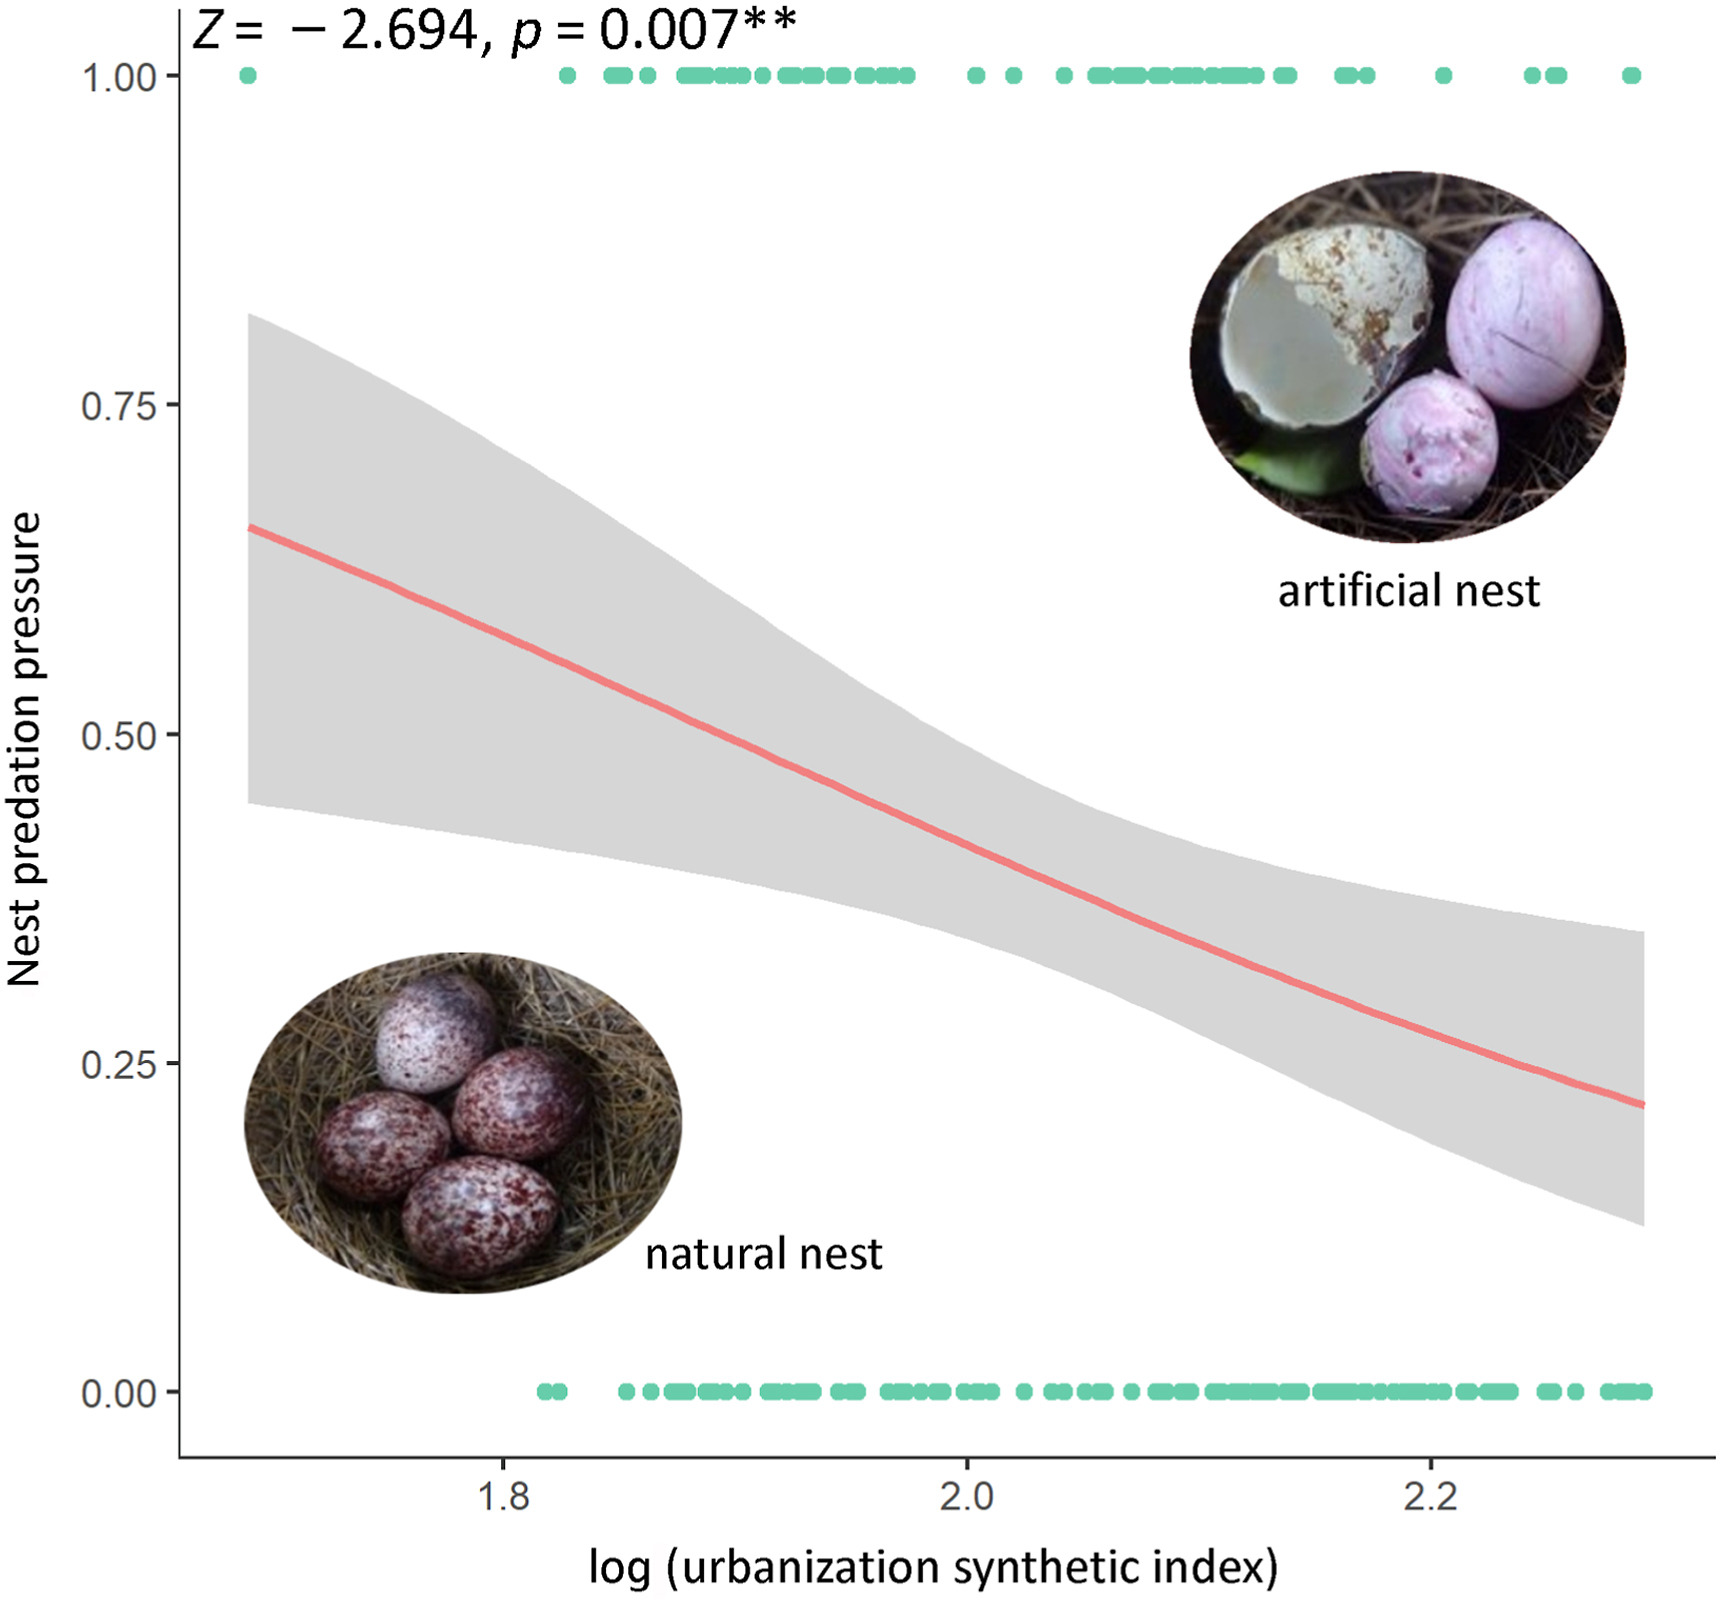
We measured nest predation events by monitoring 148 natural breeding nests during the breeding seasons and 54 artificial nests immediately after the breeding seasons. The specific experimental methods have been described in detail in our previous work (Chen et al., 2022).
2.6
Urbanization characteristic parameters
In early urbanization studies, researchers often relied on one of the following relatively simple measures such as the percentage of the landscape that was urban, the distance to human settlement, or the density of houses surrounding the study area (Marzluff et al., 2001), while they rarely considered other important urban characteristics that have adverse effects on urban birds, such as environmental noise (Slabbekoorn and Peet, 2003) and human disturbance (Fernández-Juricic, 2000). However, such measures do not reflect the overall degree of urbanization because of the complexity of urban habitats (McDonnell and Pickett, 1990) and few studies have combined these measures to provide quantitative measures of urbanization (Chen et al., 2000; Marzluff et al., 2001). To improve on these shortcomings in describing urban habitats, we selected four urban characteristic variables, including distance to city center, human disturbance, environmental noise, and building index, to provide a quantitative measure of urbanization intensity (Chen et al., 2000; Wang et al., 2008).
The Hangzhou City Government Hall (30°14′54.39″ N, 120°12′22.47″ E) is considered as the city center of Hangzhou (Fig. 1; Wang et al., 2008, 2009). The distance to city center (DCC) was measured as the straight-line distance from the nest site of Chinese Bulbuls to the Hangzhou City Government Hall (km) with Google map.
We constructed the building index following the method of Bolger et al. (1997). We imported the located nest into the GIS (ArcView 3.3) and measured the proportion of area covered by buildings around each nest with a radius of 250 m, 500 m, 1000 m, and 2000 m. We assigned different weights to the proportion of building areas of different radii. The weighted proportions were then summed to form the building index (Wang et al., 2009): Building Index (BI) = 250 m of building area% × 1 + 500 m of building area% × 0.5 + 1000 m of building area% × 0.25 + 2000 m of building area% × 0.125.
The environmental noise and disturbance index represent the level of ambient noise and the flow of people and vehicles on weekdays and weekends, respectively. We used a HS5633A digital sound level meter to measure the value of ambient noise (dBA) on one day in weekdays and one day in weekends within 10 m of the nest from 8:00 to 10:00 in the morning (Wang et al., 2008, 2013). The environmental noise (EN) was then calculated as average ambient noise on weekdays × 5/7 + average ambient noise on weekends × 2/7. We also counted the total number of people and the number of vehicles passing by within 10 m of the nests in 1 min from 8:00 to 10:00 a.m. Average foot traffic was calculated as foot traffic on weekdays × 5/7 + foot traffic on weekends × 2/7 (Zhang, 2014). Similarly, average traffic flow = traffic flow on weekdays × 5/7 + traffic flow on weekends × 2/7. Disturbance Index (DI) was then calculated as the sum of average traffic flow and average foot traffic (Chen et al., 2022).
We standardized the above four characteristic parameters of urbanization by adjusting them to the value that increases from 0 to 100 with the increase of urbanization (Chen et al., 2000; Wang et al., 2008). We then combined them to construct the urbanization synthetic index (USI) = BI × 100/2 + EN + DI/3 + 1/DCC × 100 (Wang et al., 2008; Chen et al., 2022).
2.7
Data analyses
Since the earliest recorded laying time was April 1 during survey periods, April 1 was given the value of 1 (Bailly et al., 2015). We used an arcsine square-root transformation for the hatching success rate and fledging success rate (Zar, 1999). The urbanization synthetic index and laying date were log-transformed to achieve normality. Prior to statistical analyses, we used the “fitdistrplus” package (Delignette-Muller and Dutang, 2015) to check the distribution of dependent variables. However, the feeding rate of parent birds and the seven life-history traits did not follow normal distribution even after data transformation.
We constructed generalized linear mixed model (GLMM) (Bolker et al., 2008) to examine the relationship between the USI and the feeding rate of parent birds. We used the GLMM analysis because feeding rate calculated in different days for the same nest are not independent. We conducted GLMM analyses with the USI as the fixed effect and tree species as random effect.
We performed binary logistic regression to analyze the influence of USI on clutch size. The reason for using the logistic regression is due to the fact that we only observed 3 or 4 eggs in the nests of Chinese Bulbuls after removing the invalid data such as abandoned nests or predated nests. Therefore, we converted clutch size into a two-valued response variable (three eggs = 0, four eggs = 1) and then analyzed its relationship with the USI (Fig. 3).
Figure
3.
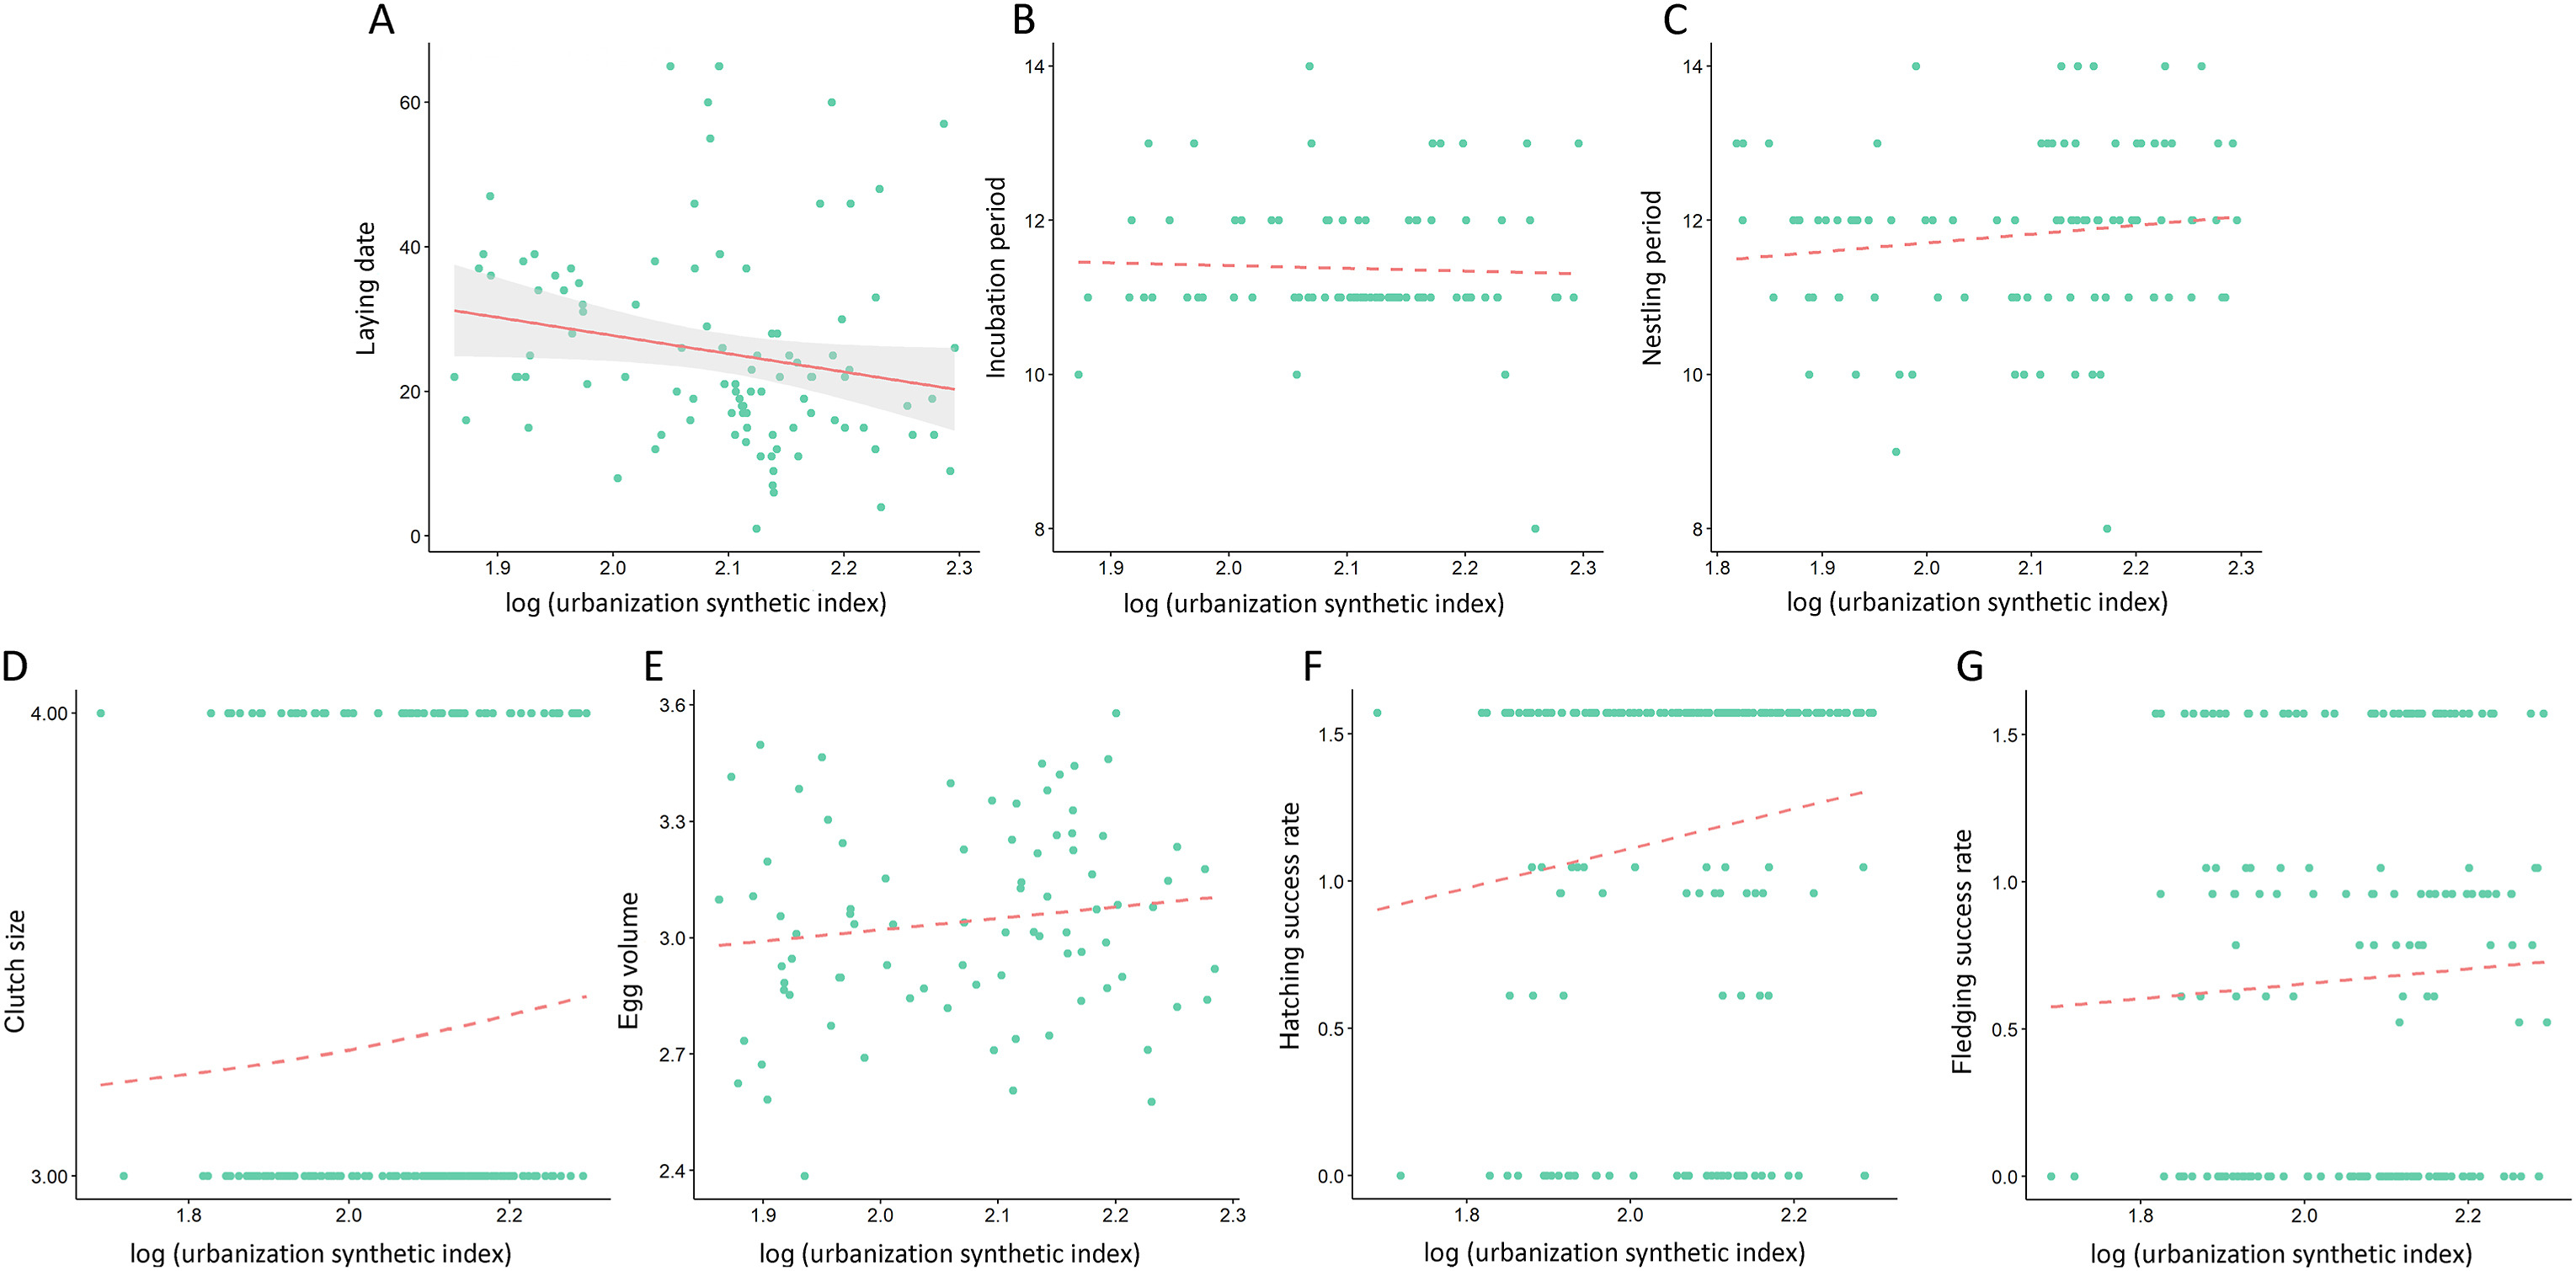
The relationship between life-history traits of Chinese Bulbuls and the urbanization synthetic index (USI). (A) laying date; (B) incubation period; (C) nestling period; (D) clutch size; (E) egg volume; (F) hatching success rate, arcsine square root transformed; (G) fledging success rate, arcsine square root transformed. The solid regression line indicates a significant result. The figure for clutch size is represented using raw data for convenience, but in the logistic regression model clutch size was classified into a two-valued response variable (three eggs = 0, four eggs = 1).
For the other six life history variables, we constructed GLMMs with a Gaussian error structure and an identity link function(Bolker et al., 2008). In these GLMMs, we used the USI as the fixed effect and tree species as random factor. Chinese Bulbuls are found to build their nests in several tree species, such as Osmanthus fragrans, Photinia serrulata, Bambusoideae sp., Elaeocarpus sylvestris (Lan et al., 2013).
For the nest predation experiments, following Chen et al. (2022), we transformed the nest predation events into a two-valued response variable (no nest predation = 0, nest predation occurred = 1). We then performed binary logistic regression to analyze the influence of USI on nest predation pressure (Lewis, 2004; Chen et al., 2022). All analyses were performed in R 4.1.0 (R Core Team, 2021).
3.
Results
3.1
Variation in reproductive life-history traits with urbanization
During the two breeding seasons in 2012 and 2013, we monitored a total of 234 breeding nests of Chinese Bulbuls (Table 1). For the laying date, most of the dates were concentrated between April 15 and May 10. The GLMM analyses showed that the laying date of Chinese Bulbuls was negatively correlated with the urbanization synthetic index (Table 2; see Appendix Table S1 for details of random effect). Therefore, Chinese Bulbuls started laying eggs early as the urbanization synthetic index increased (Fig. 3A).
Table
1.
Distribution of the sample size of 234 nests for life-history traits of Chinese Bulbuls.
Table
2.
Results of generalized linear mixed model (GLMM) analysis and binary logistic regression of variation in life-history traits of Chinese Bulbuls with the urbanization synthetic index (USI).
Variables
Intercept
Estimate ±SE
t/Z
p
Laying date
2.622
−0.530 ± 0.220
−2.414
0.018*
Incubation period
11.968
−0.162 ± 0.921
−0.176
0.861
Nestling period
8.629
1.375 ± 0.862
1.595
0.114
Clutch size
−3.826
1.476 ± 1.172
1.259
0.208
Egg volume
2.320
0.312 ± 0.227
1.378
0.172
Hatching success rate
−0.234
0.672 ± 0.353
1.904
0.059
Fledging success rate
0.147
0.253 ± 0.374
0.678
0.498
Parameters with significant result are reported in bold.
However, the other six life-history traits, i.e., incubation period, nestling period, clutch size, egg volume, hatching success rate, and fledging success rate, did not vary significantly with the urbanization synthetic index (Fig. 3B–G; Table 2).
3.2
Variation in feeding rate with urbanization
We recorded a total of 111 videos of food feeding for nestlings. We recorded valid data for 78 days for 31 nests, with 667 h of effective recording and 5076 feeding activities observed. After processing each video recording into the total number of feedings per hour, we found that it was significantly increased with the urbanization synthetic index using the GLMM analysis (Intercept = −7.076, Estimate = 7.683, SE = 3.466, t = 2.217, p = 0.032; Fig. 2B).
3.3
Variation in nest predation pressure with urbanization
According to our previous results (Chen et al., 2022), the binary logistic regression analysis showed that the nest predation pressure of Chinese Bulbuls decreased significantly with the urbanization synthetic index (USI) for the combined data of natural and artificial nests (N = 202, Z = −2.694, p < 0.007; Fig. 4).
Figure
4.
The relationship between the nest predation pressure of Chinese Bulbuls and the urbanization synthetic index (USI).
In this study, we investigated the changes in reproductive life-history traits of Chinese Bulbuls along the urbanization gradient in Hangzhou, China. Among the seven life-history traits we measured, only the laying date of Chinese Bulbuls was significantly correlated with the urbanization synthetic index. In addition, feeding frequency per hour increased with the urbanization synthetic index, while the nest predation pressure of Chinese Bulbuls decreased with the urbanization synthetic index.
To date, most previous studies investigating the impacts of urbanization on life-history traits only recorded and analyzed one to three reproductive traits (de Jong et al., 2018; Callaghan et al., 2019; Batisteli et al., 2020). We measured seven life-history traits of Chinese Bulbuls simultaneously and found that only the laying date was significantly correlated with the urbanization synthetic index. Had we only examined the laying date, we would mistakenly reach the conclusion that urbanization significantly affected all the life-history traits of Chinese Bulbuls. Therefore, our study has obvious advantages by examining seven life-history traits simultaneously, which can control the above bias effectively and help to comprehensively understand the impacts of urbanization on life-history traits.
We found that Chinese Bulbuls laid eggs early with the increase in the level of urbanization. Our result is consistent with many similar studies that have found early laying date for many other bird species in cities (Peach et al., 2008; Chamberlain et al., 2009; Corsini et al., 2017; Caizergues et al., 2018). At least three reasons may explain our result. First, the early laying date of Chinese Bulbuls may be related to increased food resources in our study city. We found that feeding frequency of Chinese Bulbuls increased with the urbanization synthetic index, indicating an increase in food resources available to parent birds (Chamberlain et al., 2009; Lothery et al., 2014). Second, our result may be related to the heat island effect in cities (Arnfield, 2003). The heat island effect makes cities warmer than the natural environment, alters phenology and may cause insects in cities to start activity earlier (Tüzün et al., 2017; Chick et al., 2019). Chinese Bulbuls in the city may be able to obtain insect food resources earlier and therefore start breeding early (Eden, 1985). Finally, compared with rural sites, the predation pressure of Chinese Bulbuls was significantly lower in our study city (Chen et al., 2022), which may also improve the feeding rates and lead to earlier layding date.
However, the other six life-history traits we investigated did not vary significantly with the level of urbanization. This result suggests that the adaptation of Chinese Bulbuls to urbanization is not reflected in all the reproductive traits. By contrast, some changes of the life-history traits with urbanization are not noticeable, such as clutch size or egg volume. According to our observations, the clutch size of Chinese Bulbuls is relatively fixed (either three or four; Zhang, 2014), so it may be difficult for the birds to adjust clutch size to adapt to urbanization. Similarly, if there was no much change in the clutch size, the volume of the eggs will not change accordingly. In a recent review, Sepp et al. (2017) also found mixed or no significant impacts of urbanization on many life-history traits of birds, including clutch size and egg volume.
One main caveat of our study is that the sample size for all the life-history traits among the 234 breeding nests was not consistent (Table 1). However, such inconsistency in sample size is caused by several uncontrollable or logical reasons. On the one hand, some breeding nests may encounter predatory conditions or bad weathers, leading parent birds to abandon nests. This results in some breeding nests having only values for laying date, clutch size, or egg volume, but missing the other life-history traits (Zhang, 2014). On the other hand, because most of the 234 nests of Chinese Bulbuls are breeding at about the same time, our limited number of researchers and volunteers cannot monitor all the nests simultaneously. Finally, since some breeding nests have already hatched when we found them, the laying date, hatching date and egg volume are not available, which may also lead to an inaccurate estimate of clutch size (Zhang, 2014).
In our study, we selected four urban characteristic variables, i.e., distance to city center, human disturbance, environmental noise and building index, and used them to compute the urbanization synthetic index to provide an overall measure of urbanization intensity (Chen et al., 2000; Wang et al., 2008). The urbanization synthetic index is important for measuring the overall degree of urbanization because of the complexity of urban habitats (McDonnell and Pickett, 1990). However, we found some different outcomes when analyzing life-history traits using the four specific urban characteristic variables (Appendix Tables S2–S5). Besides laying date, other life-history traits such as clutch size, nestling period, egg volume, hatching success rate, and fledging success rate, were also significantly correlated with the four urban characteristic variables (Appendix Tables S2–S5). These results suggest that how urbanization affects avian life-history traits depends on the definition of urbanization. Therefore, future studies should clearly define how they measure urbanization.
5.
Conclusions
Among the seven life-history traits we measured, only the laying date of Chinese Bulbuls changed significantly with the level of urbanization. Increased degree of urbanization results in an increase in food resources and a decline in nest predation rates, leading to an earlier laying date of Chinese Bulbuls. Although Chinese Bulbuls have been found to adapt to urbanization, our results indicate that they do not alter all the life-history traits. However, it is not clear whether the earlier laying date of Chinese Bulbuls in our study city is the result of phenotypic plasticity or genetic change. The idea needs to be tested in future. We also recommend that further studies should investigate as many life-history traits as possible so as to reach reliable conclusion and comprehensively understand the impacts of urbanization on life-history traits. In addition, future studies should clearly define the measurement of urbanization as it can influence avian life-history traits in different ways. Finally, further studies should try to ensure the consistency of sample size for the investigated life-history traits so that we can directly analyze the trade-off relationship among these traits (Sepp et al., 2017), and test the impacts of selecting pressure factors on multiple life-history traits simultaneously.
Author's contributions
YW and SC conceived the study; QZ, QH and SL collected data and conducted the research; XC and YW developed methods, analyzed data, and wrote the manuscript. All authors read and approved the final manuscript.
Ethics statement
Our study was carried out in agreement with the current law of China on the protection of wildlife.
Declaration of competing interest
The authors declare that they have no competing interests.
Acknowledgements
We are grateful for Tengda Zhu, Yafei Ma, Jianwei Zhou, Chao Chen, Xiang Yu, Wen Xu, Mingming Hu and Chenchen Zhu for their field assistance in finding and monitoring bird nests. We thank two anonymous reviewers for their helpful comments on the manuscript.
Arnfield, A.J., 2003. Two decades of urban climate research: a review of turbulence, exchanges of energy and water, and the urban heat island. Int. J. Climatol. 23, 1-26.
Bailly, J., Scheifler, R., Berthe, S., Clement-Demange, V., Leblond, M., Pasteur, B., et al., 2015. From eggs to fledging: negative impact of urban habitat on reproduction in two tit species. J. Ornithol. 157, 377-392.
Batisteli, A.F., Costiuc, M.Y., Santieff, I.Z., Costa, R.O., Sarmento, H., Pizo, M.A., et al., 2020. Breeding biology of the Creamy-bellied Thrush (Turdus amaurochalinus) in southeast Brazil. Stud. Neotrop. Fauna Environ. 55, 233-241.
Benharzallah, N., Bachir, A.S., Barbraud, C., 2022. Nest characteristics and food supply affect reproductive output of white storks Ciconia ciconia in semi-arid areas. Biologia 77, 997-1006.
Bolger, D.T., Scott, T.A., Rotenberry, J.T., 1997. Breeding bird abundance in an urbanizing landscape in coastal southern California. Conserv. Biol. 11, 406-421.
Bolker, B.M., Brooks, M.E., Clark, C.J., Geange, S.W., Poulsen, J.R., Stevens, M.H.H., White, J.S.S., 2008. Generalized linear mixed models: a practical guide for ecology and evolution. Trends Ecol. Evol. 24, 127–135.
Bridge, E.S., Schoech, S.J., Bowman, R., Wingfield, J.C., 2009. Temporal predictability in food availability: effects upon the reproductive axis in Scrub-Jays. J. Exp. Zool. 311, 35-44.
Caizergues, A.E., Gregoire, A., Charmantier, A., 2018. Urban versus forest ecotypes are not explained by divergent reproductive selection. Proc. R. Soc. B 285, 20180261.
Callaghan, C.T., Major, R.E., Wilshire, J.H., Martin, J.M., Kingsford, R.T., Cornwell, W.K., et al., 2019. Generalists are the most urban-tolerant of birds: a phylogenetically controlled analysis of ecological and life history traits using a novel continuous measure of bird responses to urbanization. Oikos 128, 845-858.
Capilla-Lasheras, P., Thompson, M.J., Sánchez-Tójar, A., Haddou, Y., Branston, C.J., Réale, D., et al., 2022. A global meta-analysis reveals higher variation in breeding phenology in urban birds than in their non-urban neighbours. Ecol. Lett. 25, 2552–2570.
Castro, I., Brunton, D.H., Mason, K.M., Ebert, B., Griffiths, R., 2003. Life history traits and food supplementation affect productivity in a translocated population of the endangered Hihi (Stitchbird, Notiomystis cincta). Biol. Conserv. 114, 271-280.
Chamberlain, D.E., Cannon, A.R., Toms, M., Leech, D., Hatchwell, B.J., Gaston, K.J., et al., 2009. Avian productivity in urban landscapes: a review and meta-analysis. Ibis 151, 1-18.
Chen, S., Ding, P., Zheng, G., Zhuge, Y., 2000. Effects of urbanization on wetland waterbird communities in Hangzhou. Zool. Res. 21, 279-285.
Chen, W., Wu, Y., Hu, J., Yu, Z., Guo, Z., 2006. Nest site selection and materials of Pycnonotus sinensis in Nanchong, Sichuan. Sichuan J. Zool. 25, 590-593.
Chen, X., Zhang, Q., Lan, S., Chen, S., Wang, Y., 2022. Nest predation pressure on Chinese Bulbuls decreases along the urbanization gradient in Hangzhou, China. Avian Res. 13, 100049.
Chick, L.D., Strickler, S.A., Perez, A., Martin, R.A., Diamond, S.E., 2019. Urban heat islands advance the timing of reproduction in a social insect. J. Therm. Biol. 80, 119-125.
Corsini, M., Dubiec, A., Marrot, P., Szulkin, M., 2017. Humans and tits in the city: quantifying the effects of human presence on great tit and blue tit reproductive trait variation. Front. Ecol. Evol. 5, 82.
de Jong, M., van den Eertwegh, L., Beskers, R.E., de Vries, P.P., Spoelstra, K., Visser, M.E., 2018. Timing of avian breeding in an urbanised world. Ardea 106, 31-38.
Delignette-Muller, M.L., Dutang, C., 2015. Fitdistrplus: an R package for fitting distributions. J. Stat. Softw. 64, 1-34.
de Neve, L., Soler, J.J., Soler, M., Perez-Contreras, T., Martin-Vivaldi, M., Martinez, J.G., et al., 2004. Effects of a food supplementation experiment on reproductive investment and a post-mating sexually selected trait in magpies Pica pica. J. Avian Biol. 35, 246-251.
Drent, R.H., 1970. Functional aspects of incubation in the herring gull (Larus argentatus Pont.). Behaviour 17, 1-132.
Eden, S.F., 1985. The comparative breeding biology of magpies Pica pica in an urban and a rural habitat (Aves: Corvidae). J. Zool. 205, 325-334.
Feng, C., Liang, W., 2020. Behavioral responses of Black-headed Gulls (Chroicocephalus ridibundus) to artificial provisioning in China. Global Ecol. Conserv. 21, e00873.
Fernandez-Juricic, E., 2000. Local and regional effects of pedestrians on forest birds in a fragmented landscape. Condor 102, 247-255.
Ghalambor, C.K., Martin, T.E., 2000. Parental investment strategies in two species of nuthatch vary with stage-specific predation risk and reproductive effort. Anim. Behav. 60, 263-267.
Ghalambor, C.K., Martin, T.E., 2001. Fecundity-survival trade-offs and parental risk-taking in birds. Science 292, 494-497.
Gaston, K.J., Bennie, J., Davies, T.W., Hopkins, J., 2013. The ecological impacts of nighttime light pollution: a mechanistic appraisal. Biol. Rev. 88, 912-927.
Hanmer, H.J., Thomas, R.L., Fellowes, M.D.E., 2017. Provision of supplementary food for wild birds may increase the risk of local nest predation. Ibis 159, 158-167.
Hawkins, C.E., Ritrovato, I.T., Swaddle, J.P., 2020. Traffic noise alters individual social connectivity, but not space-use, of Red-backed Fairywrens. Emu 120, 313-321.
Hoyt, D.F., 1979. Practical methods of estimating volume and fresh weight of bird eggs. Auk 96, 73-77.
Ibanez-Alamo, J.D., Soler, M., 2010. Does urbanization affect selective pressures and life-history strategies in the common blackbird (Turdus merula L.)? Biol. J. Linn. Soc. 101, 759-766.
Kettel, E.F., Gentle, L.K., Quinn, J.L., Yarnell, R.W., 2018. The breeding performance of raptors in urban landscapes: a review and meta-analysis. J. Ornithol. 159, 1–18.
Kumar, V., Sharma, A., Tripathi, V., 2022. Physiological effects of food availability times in higher vertebrates. J. Exp. Biol. 225, jeb239004.
Lack, D., 1947. The significance of clutch-size. Ibis 89, 302-352.
Lan, S.S., Zhang, Q., Huang, Q., Chen, S., 2013. Breeding ecology of Chinese Bulbul in the urban environment of Hangzhou, China. Zool. Res. 34, 182-189.
Lewis, K.P., 2004. How important is the statistical approach for analysing categorical data? A critique using artificial nests. Oikos 104, 305-315.
Lothery, C.J., Thompson, C.F., Lawler, M.L., Sakaluk, S.K., 2014. Food supplementation fails to reveal a trade-off between incubation and self-maintenance in female House Wrens. PLoS One 9, e106260.
Lowry, H., Lill, A., Wong, B.B., 2013. Behavioural responses of wildlife to urban environments. Biol. Rev. 88, 537-549.
Martin, T.E., 1987. Food as a limit on breeding birds: a life-history perspective. Ann. Rev. Ecol. Syst. 18, 453-487.
Martin, T.E., 2004. Avian life-history evolution has an eminent past: does it have a bright future? Auk 121, 289-301.
Marzluff, J.M., Bowman, R., Donelly, R., 2001. A historical perspective on urban
birdresearch: trends, terms, and approaches. In: Marzluff, J.M., Bowman, R.,
Donelly, R. (Eds.), Avian Ecology and Conservation in an Urbanizing World. Kluwer
Academic Publishers, Boston, pp. 1–17.
McDonnell, M.J., Pickett, S.T.A., 1990, Ecosystem structure and function along urban-rural gradients: an unexploited opportunity for ecology. Ecology 71, 1232-1237.
Miller, J., Hobbs, R., 2002. Conservation where people live and work. Conserv. Biol. 16, 330-337.
Millon, A., Arroyo, B.E., Bretagnolle, V., 2008. Variable but predictable prey availability affects predator breeding success: natural versus experimental evidence. J. Zool. 275, 349-358.
Morgan, D.K.J., Waas, J.R., Innes, J., Fitzgerald, N., 2011. Identification of nest predators using continuous time-lapse recording in a New Zealand city. New Zealand J. Zool. 38, 343-347.
Nana, E.D., Sedlacek, O., Vokurkova, J., Horak, D., 2014. Nest position and type affect predation rates of artificial avian nests in the tropical lowland forest on Mount Cameroon. Ostrich 85, 93-96.
Partecke, J., Schwabl, I., Gwinner, E., 2006. Stress and the city: urbanization and its effects on the stress physiology in European blackbirds. Ecology 87, 1945-1952.
Patankar, S., Jambhekar, R., Suryawanshi, K.R., Nagendra, H., 2021. Which traits influence bird survival in the city? A Review. Land 10, 92.
Peach, W.J., Vincent, K.E., Fowler, J.A., Grice, P.V., 2008. Reproductive success of House Sparrows along an urban gradient. Anim. Conserv. 11, 493-503.
R Core Team, 2021. R: a Language and Environment for Statistical Computing. R
Foundation for Statistical Computing, Vienna. URL. .
Ricklefs, R., 1969. Analysis of nesting mortality in birds. Smithsonian Contrib. Zool. 9, 1-48.
Robinson, W.D., Robinson, T.R., Robinson, S.K., Brawn, J.D., 2000. Nesting success of understory forest birds in central Panama. J. Avian Biol. 31, 151-164.
Roper, J.J., Sullivan, K.A., Ricklefs, R.E., 2010. Avoid nest predation when predation rates are low, and other lessons: testing the tropical-temperate nest predation paradigm. Oikos 119, 719-729.
Seress, G., Sandor, K., Evans, K.L., Liker, A., 2020. Food availability limits avian reproduction in the city: an experimental study on great tits Parus major. J. Anim. Ecol. 89, 1570-1580.
Sepp, T., McGraw, K.J., Kaasik, A., Giraudeau, M., 2017. A review of urban impacts on avian life-history evolution: does city living lead to slower pace of life? Global Change Biol. 24, 1452-1469.
Shochat, E., Warren, P.S., Faeth, S.H., McIntyre, N.E., Hope, D., 2006. From patterns to emerging processes in mechanistic urban ecology. Trends Ecol. Evol. 21, 187-191.
Slabbekoorn, H., Peet, M., 2003. Birds sing at a higher pitch in urban noise. Nature 424, 267.
Tryjanowski, P., Sparks, T.H., Kuzniak, S., Czechowski, P., Jerzak, L., 2013. Bird migration advances more strongly in urban environments. PLoS One 8, e63482.
Tuzun, N., de Beeck, L.O., Brans, K.I., Janssens, L., Stoks, R., 2017, Microgeographic differentiation in thermal performance curves between rural and urban populations of an aquatic insect. Evol. Appl. 10, 1067-1075.
van Doren, B.M., Horton, K.G., Dokter, A.M., Klinck, H., Elbin, S.B., Farnsworth, A., et al., 2017. High-intensity urban light installation dramatically alters nocturnal bird migration. P. Nat. Acad. Sci. USA 114, 11175-11180.
Vincze, E., Seress, G., Lagisz, M., Nakagawa, S., Dingemanse, N.J., Sprau, P., et al., 2017. Does urbanization affect predation of bird nests? A meta-analysis. Front. Ecol. Evol. 5, 29.
Wang, Y., 2003. A Study of the Adaptability of Birds to Urbanization. Master’s Thesis..
Zhejiang University, Hangzhou.
Wang, Y., Chen, S., Ding, P., 2004. Flush distance: birds tolerance to human intrusion in Hangzhou. Zool. Res. 25, 214-220.
Wang, Y., Chen, S., Jiang, P., Ding, P., 2008. Black-billed Magpies (Pica Pica) adjust nest characteristics to adapt to urbanization in Hangzhou, China. Can. J. Zool. 86, 676-684.
Wang, Y., Chen, S., Blair, R.B., Jiang, P., Ding, P., 2009. Nest composition adjustments by Chinese Bulbuls (Pycnonotus Sinensis) in an urbanized landscape of Hangzhou (E China). Acta Ornithol. 44, 185-192.
Wang, Y., Ding, P., Chen, S., Zheng, G., 2013. Nestedness of bird assemblages on urbanwoodlots: implications for conservation. Lands. Urban Plan. 111, 59-67.
Wang, Y., Song, Y., Zhong, Y., Chen, C., Zhao, Y., Zeng, D., et al., 2021. A dataset on the life-history and ecological traits of Chinese birds. Biodivers. Sci. 29, 1149-1153. (in Chinese).
Yang, X., Tan, X., Chen, C., Wang, Y., 2020. The influence of urban park characteristics on bird diversity in Nanjing, China. Avian Res. 11, 45.
Table
2.
Results of generalized linear mixed model (GLMM) analysis and binary logistic regression of variation in life-history traits of Chinese Bulbuls with the urbanization synthetic index (USI).
Variables
Intercept
Estimate ±SE
t/Z
p
Laying date
2.622
−0.530 ± 0.220
−2.414
0.018*
Incubation period
11.968
−0.162 ± 0.921
−0.176
0.861
Nestling period
8.629
1.375 ± 0.862
1.595
0.114
Clutch size
−3.826
1.476 ± 1.172
1.259
0.208
Egg volume
2.320
0.312 ± 0.227
1.378
0.172
Hatching success rate
−0.234
0.672 ± 0.353
1.904
0.059
Fledging success rate
0.147
0.253 ± 0.374
0.678
0.498
Parameters with significant result are reported in bold.

 DownLoad:


 Email Alerts
 RSS Feeds