Research Institute of Forest Ecology, Environment and Protection, Key Laboratory of Forest Protection of the State Forestry Administration, Chinese Academy of Forestry, Beijing 100091, China
2.
Northeast Institute of Geography and Agricultural Ecology, Chinese Academy of Sciences, Changchun 130012, China
3.
College of Wildlife Resources, Northeast Forestry University, Harbin 150040, China
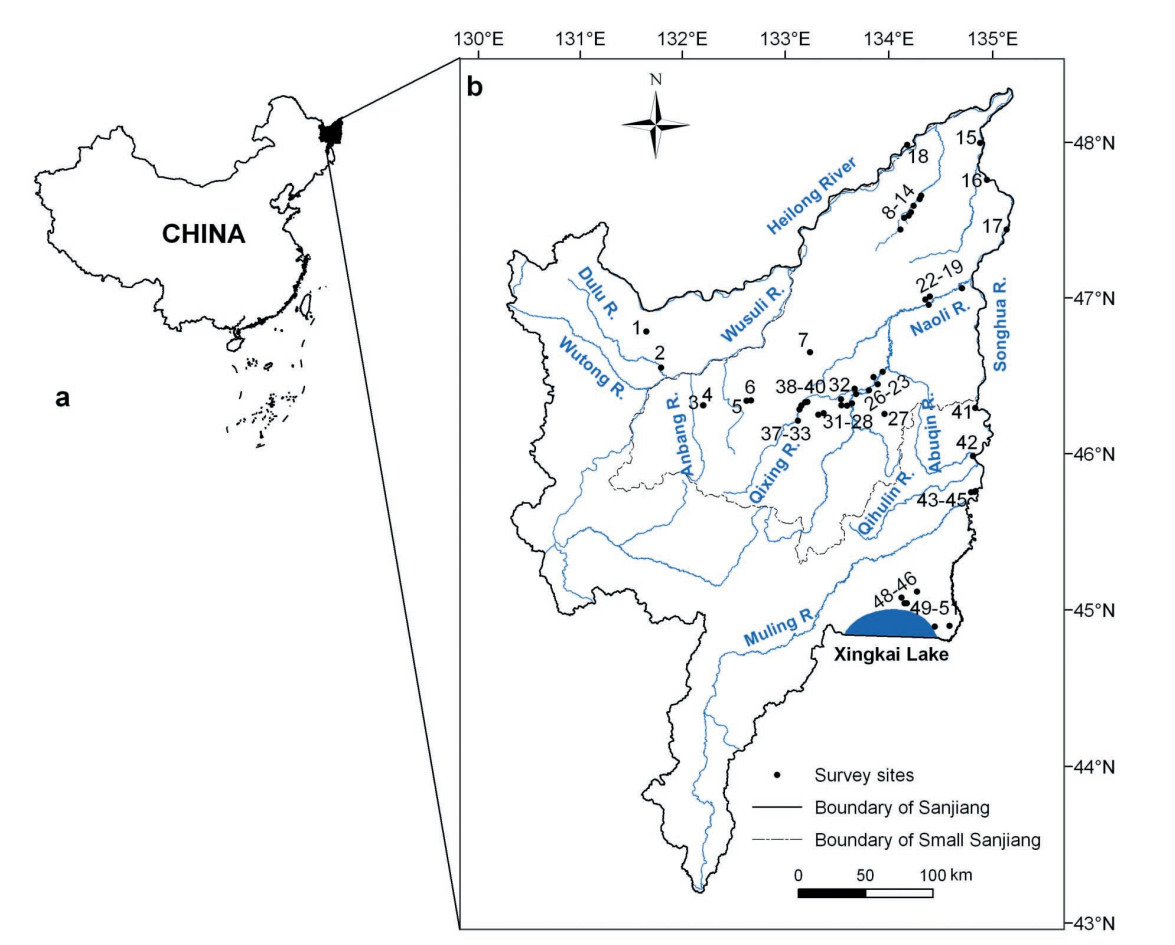
In order to measure the impact of changes in the marsh on breeding Red-crowned Cranes (Grus japonensis) and White-naped Cranes (G. vipio) in the Sanjiang Plain, we conducted a complete crane survey in each of the summers of 2007 and 2008, and obtained information on the changes in its marsh through interpretation of satellite images in 1986, 1995, 2000 and 2005. A comparison between the 1984 and 2008 census shows that: 1) the number of Red-crowned Cranes remained stable at about 300 birds, while the number of White-naped Cranes increased markedly; 2) the estimates of nests of Red-crowned cranes are close to the numbers of 1984, while approximately 90% of the nests of these two crane species were distributed over five national nature reserves (NNRs); 3) the two crane species became more concentrated in three regions, i.e., the Fuyuan Delta, the middle reaches of the Naoli and Qixing rivers, and the Xingkai Lake wetlands, rather as formerly in six regions. The area of the marsh decreased by 45% within the 20-year period from 1986 to 2005. The major loss of the marsh area was in the form of a conversion to paddy fields and dry land, which can be primarily attributed to direct human activity under various economic and policy drivers. The disappearance of cranes in the Dulu and Abuqin rivers was induced by large-scale agricultural development. The fragmentation into and isolation of small areas of the marsh became increasingly more serious, which resulted in unsuitable condtions for crane breeding in small patches of the marsh. The number of cranes declined from 1984-1995 but had recovered remarkably by 2008, which may be due to the establishment of a system of nature reserves, in place since 2000. The land ownership of the reserve plays a key role in maintaining the integrity of the wetland ecosystem, especially in Sanjiang, Honghe, Naolihe and Qixinghe NNRs, which together accommodated approximately 80% of the population of cranes. However, we did not discover any nests at all in the provincial and municipal reserves, which may be attributed to high human disturbances in these areas. In the end, we propose some recommendations on reserve management.
Montane glacial shifts and environmental changes during the Pleistocene are the main reasons to phylogeographical patterns and population dynamics (Fang et al. 2017). However, different phylogeographical patterns in closely related species might have been caused by different habitat preferences and altitude specificity (Qu et al. 2009). Especially, sister species, which shared recent ancestry, may show different patterns of population genetic structure due to biological, ecological, behavioural, or environmental factors (Bermingham and Moritz 1998). Hence, comparative analysis of the population genetic structures of sister species may provide the chance to disclose factors impacting evolutionary processes. Comparative phylogeography can reveal concordant phylogeographical patterns across sympatrically distributed species, demonstrating a relative historical stability of communities and reflections to resemble external (e.g. climatic) factors or incongruent patterns, showing a prevalence of particular, species-specific reflections (Correa Ribeiro et al. 2016).
The Qinghai-Tibetan plateau (QTP) is one of the most prominent topographical features on Earth. There is a growing understanding that avian evolution in the QTP region has been firmly associated with the orogenetic history of the flanking mountain chains (An et al. 2009, 2015; Qu et al. 2009; Lei et al. 2014). The Tibetan Plateau stretches from the Himalayan Mountains in the south to the Kunlun, Altun and Qilian Mountains in the north and from the Pamirs and the Hindu Kush in the west to the western part of the Qinling Mountain in the east (Zhang et al. 2018). However, the investigation on origin and evolutionary history of Tibetan endemic bird species has long been limited to the central plateau region, southern and eastern fringes (Prum et al. 2015). Although the biogeographical avian history of the western part of Tibetan Plateau has little information, research on the Snow Leopard (Panthera uncial) showed a clear biogeographical pattern in the distribution of three subspecies with Northern (the Altai region), Central (core Himalaya and Tibetan Plateau), and Western (Tien Shan, Pamir, Janecka et al. 2017). Previous research also found that differences among species in body size, shape as well as in foraging and feeding strategies had been involved in the initiative stages of SE Asian passerine radiations long before ancestors of extant species occupied their altitudinal niches in response to Sino-Himalayan vegetation belts (Kennedy and Price 2012; Price et al. 2014).
Tibetan Snowcock (Tetraogallus tibetanus) and Himalayan Snowcock (T. himalayensis) inhabit the alpine and subalpine zone in the remote and rugged mountains on the Tibetan Plateau and its surrounding mountain ranges (Zheng 1978). They well adapt to the harsh climate, spending the hostile winter months in lower valleys and mostly moving in summer to high elevations for breeding as resident birds (An et al. 2015). They evolved in large mountains (Shen and wang 1963) and overlapped distribution in western Himalayan Mountains, Qilian Mountains, Qingha Nanshan and Kunlun Mountains (Liu 1999), with different ecological niches due to the body size (big vs small), habitat altitude (high vs moderately high), breeding time (late vs early) and diet spectrum (euryphagous vs stenophagous; Additional file 1: Table S1) (Liu 1999). T. tibetanus has a much less fragmented montane habitat and more cold tolerance than T. himalayensis. Based mainly on the head, abdomen, and adult plumage color, T. himalayensis and T. tibetanus were separately divided into dark-bellied and white-bellied groups (Bianki 1898). The voices of T. tibetanus and T. himalayensis are also distinct (Adeli et al. 1997). We hypothesize that the phylogeographical patterns and/or population dynamics of the two sister snowcock species may be different due to their different life history and habitat preferences, even though they share the same historical Pleistocene glacial fluctuations and environmental conditions. Habitat generalists with more ecological plasticity and broad geographic distributions have better chances to survive when in adverse conditions than specialists with specific habitats and narrow ranges (Zhang et al. 2012). Climate in high altitude mountains is usually cold and moist, and coniferous forests cover the mountains and higher elevation valleys, while low altitude foothills are warmer and drier (Zhang et al. 2013).
Snowcocks can survive only around the snow line or in low-temperature surroundings. Contrary to most other avian species, individuals spread only in glaciers and are isolated in interglacial locations (Liu 1999). Li et al. (2016) identified climate refugia of Snow Leopards due to the unique mountain environment, where snowcocks sympatrically distributed in High Asia, which maintains a relatively constant arid or semi-arid climate. With world climate changing, Snow Leopards' suitable zones will move up towards mountaintops, causing the loss of Snow Leopard habitat and habitat fragmentation along (Li et al. 2016).
Although Ruan et al. (2005) and Liu (1999) documented that the two species never coexist on a hill in overlapped regions due to strong competition, an intriguing phenomenon was observed that the two species were mixed together based on recent years' field observation in Qinghai-Tibetan Plateau (Ma et al. 2013; Zhang et al. 2015), and sympatrically distributed in Ladakh, Jammu and Kashmir, India (Namgail 2005). In this study, we examined the phylogeographical patterns and population structure and inferred the evolutionary history of T. himalayensis and T. tibetanus. The comparison of the two sister species, with different ecological habitat preferences, and altitude specificity, will offer more insights into the interaction between historical population dynamics and geological events in this region.
Methods
Sampling and DNA extraction
A total of 25 sample sites covered the distribution ranges of T. himalayensis and T. tibetanus on the QTP (Fig. 1). According to T. tibetanus geographical origin, the samples were divided into five regional groups: QLS (Qilian Mountain region), QDM (Qiadam Basin region), BKL (Baryan Har Mountains region), TGL (Tanggula Mountains region) and WKL (western Kunlun Mountains region) and according to T. himalayensis geographical origin, the samples were divided into six regional groups: HETS (eastern Tien Shan region), HWTS (western Tien Shan region), HWKL (western Kunlun Mountains region), HQDM (Qiadam Basin region), HQLS (Qilian Mountain region), HPME (Pamir Plateau) (Fig. 1 and Additional file 1: Table S2). The sample size of each population is shown in Table 1. Voucher specimens are held in the Lanzhou University Nature Museum. The research was conducted under permission, by the Forest Department of Gansu Province (China, Gansu), Xinjiang (China, Xingjiang Autonomous Region), Xizang (China, Xizang Autonomous Region). DNA was extracted using whole genome kit (Qiagen, Inc., Valencia, CA) except for some individuals of T. himalayensis specimens where DNA was already available (Wang et al. 2011). One hundred and nine T. himalayensis samples were genotyped at seven polymorphic microsatellite primers that were isolated originally from the Chicken (Gallus gallus) genome: (MCW135, MCW323, AB121114, GUJ0028, UBC0005, UBC0006 and GUQ0001).
Figure
1.
Distributions and sample locations for the two snowcock species: aTetraogallus himalayensis, marked with blue rectangular solid, bT. tibetanus, marked with pink triangular solid. Sample sites are abbreviated as follows: Datong (DT), Sunan (SN), Tianzhu (TZ), Atushi (AT), Wuqia (WQ), Yecheng (YC), Haixi (THX), Delingha (TDL), Zhiduo (ZD), Biru (BR), Baqin (BQ), Anduo (AD), Suoxian (SX), Qumalai (QM) for T. tibetanus sampling sites, Subei (SB), Pishan (PS), Hetian (HT), Kashi (KS), Germ (GM) Delinha (HDL), Qitai (QT), Houxia (HHX), Akesu (AK), Zhaosu (ZS), Taxkorgan (TS) for T. himalayensis. Group definitions see Additional file 1: Table S2. QLS (Qilian Mountains region), QDM (Qiadam Basin region), BKL (Baryan Har Mountains region), TGL (Tanggula Mountains region) and WKL (western Kunlun Mountains region) for Tetraogallus tibetanus, and for T. himalayensis geographical origin, the samples were divided into six regional groups: HETS (eastern Tien Shan region), HWTS (western Tien Shan region), HWKL (western Kunlun Mountains region), HQDM (Qiadam Basin region), HQLS (Qilian Mountain region), HPME (Pamir Plateau)
Table
1.
Genetic diversity of populations of T. tibetanus and T. himalayensis, with mitochondria DNA control sequences (mtDNA) and 7 nuclear microsatellite markers (STR)
Group
mtDNA
Microsatellite
N
n
K
h
π (%)
Tajima'D (p)
Fu's FS (p)
N
NA
AR
HO
HE
FIS
Tetraogallus tibetanus
BKL
11
6
0.55
0.35
0.06
- 0.54 (0.13)
- 1.59 (0.03)
9
4.14
4.0
0.57
0.73
0.02
WKL
7
5
4.0
0.71
0.45
- 0.99 (0.18)
1.25 (0.71)
7
4.14
4.1
0.57
0.72
0.02
TGL
29
22
2.61
0.92
0.30
- 1.37 (0.07)
- 11.48 (0.00)
33
9.43
6.6
0.47
0.69
0.19
QDM
14
12
5.86
0.95
0.67
0.39 (0.67)
- 1.98 (0.14)
14
5.43
4.6
0.50
0.66
0.13
QLS
19
9
3.17
0.89
0.36
- 0.28 (0.41)
- 1.72 (0.19)
19
9.29
5.3
0.53
0.81
0.02
Tetraogallus himalayensis
HETS
12
5
3.47
0.86
0.39
0.20 (0.61)
1.146 (0.73)
19
15.45
5.57
0.05
0.71
0.74
HWKL
24
9
6.45
0.91
0.73
- 1.02 (0.14)
1.43 (0.76)
36
24.29
8.71
0.12
0.83
0.69
HWTS
10
5
3.11
0.87
0.35
0.43 (0.67)
0.41 (0.60)
10
11.29
4.71
0
0.71
0.67
HQDM
7
4
9.81
0.85
1.13
1.13 (0.91)
3.38 (0.94)
7
11.68
3.86
0.14
0.74
0.46
HQLS
9
5
6.39
0.83
0.74
- 1.52 (0.06)
1.81 (0.79)
23
19.43
6.86
0.10
0.77
0.70
HPME
5
3
1.40
0.80
0.16
- 0.17 (0.46)
0. 06 (0.31)
14
13.14
5.57
0.20
0.70
0.67
N: sample size, n: number of haplotypes, K: average number of nucleotide differences, h: haplotype diversity, π: nucleotide diversity, NA: number of alleles per locus, AR: allelic richness, HO: observed heterozygosity, HE: expected heterozygosity, FIS: inbreeding coefficient
PCR was performed in 50 μL reaction mixtures containing 1.5 mM of MgCl2, 0.6 μM of primer pair, 0.4 mM dNTP, 100 ng of the DNA template, 0.4 U of Taq DNA polymerase (Sigma) and 1 × PCR buffer (Sigma). The PCR protocol used was: (1) initial DNA denaturation at 94 ℃ for 4 min; (2) 35 successive cycles of strand denaturation at 94 ℃ for 40 s; (3) primer annealing at 45-60 ℃ for 40 s and (4) DNA extension at 72 ℃ for 45 s. A prolonged extension step at 72 ℃ for 6 min was added after the final cycle. Amplified products, which ran on 8% polyacrylamide gel by electrophoresis, could be visualized by silver staining. PUC19 DNA/MspI (HpaII), as a size standard, ran on each gel to determine fragment size using Bandscan 4.30 software (http://moleco.sjtu.edu.cn).
Genetic diversity and phylogeographic structure
All 67 T. himalayensis mitochondrial control region sequences from Wang et al. (2011) were aligned with 80 sequences of T. tibetanus in An et al. (2015). We identified haplotypes and calculated standard genetic indices (haplotype diversity (h) and nucleotide diversity (π)) for each population and combined diversity for all populations using DNASP 5.0 (Librado 2009). The sequence of Alectoris magna was used as outgroup. Evolutionary relationships among all haplotypes were performed by constructing phylogenetic tree using Bayesian (BA) Markov chain Monte Carlo (MCMC) phylogenetic analyses (Drummond and Rambaut 2007). The computer program jMODELTEST 2.1.1 (Darriba et al. 2012) was used to select the best-fit model of evolution. For Bayesian analyses, four independent MCMCs were initiated with random starting trees and each run for 5 × 10⁶ generations, sampling every 100 generations. A 50% strict consensus tree was computed for the 1000 bootstrap trees. We further constructed unrooted haplotype networks using the median-joining algorithm (Bandelt et al. 1999) as implemented in Network v4.6.1.1 (http://www.fluxus-engineering.com). This method allows the visualization relationships and frequencies among mtDNA haplotype.
All T. himalayensis microsatellite data and fragment lengths were analysed with the internal size marker GENESCAN-500 ROX (Applied Biosystems), and scored with GENEMARKER 3.7 (SoftGenetics). The published microsatellite data (An et al. 2009) were involved in this study. For microsatellite data, we estimated the standard genetic diversity for each group using the following indices: the number of alleles at each locus (NA), average allelic richness (AR), and observed heterozygosity (HO); heterozygosity expected from the Hardy-Weinberg assumption (HE) and exact tests of linkage disequilibrium (LD) between pairs of loci for each population were calculated with ARLEQUIN 3.5 (Excoffier and Lischer 2010) and FSTAT 2.9.4 (Goudet 2001). STRUCTURE 2.3.4 (Pritchard et al. 2000) was used to determine the most probable number of genetic clusters (K). Analyses were performed using an admixture model, correlated allele frequencies, a burn-in period of 50, 000 cycles, and 500, 000 additional cycles (determined from test runs to be enough for parameter stabilization). The admixture model with correlated allele frequencies was applied and with sampling locality priors for magnifying the signals as suggested by Hubisz et al. (2009). Analyses were repeated 20 times for each species with K = 1 to 5 or 6, and the two species together with K = 1 to 11, where K is the number of genetic populations, and posterior probability, ln[P(D)], was used to infer the most likely number of genetic populations as described in Pritchard et al. (2000). We used STRUCTURE HARVESTER to process the results from multiple runs of STRUCTURE (Earl and vonHoldt 2012).
Genetic differentiation between regional groups was evaluated based on pairwise values of FST. The statistical significance of the estimates was assessed after 10, 000 permutations. Gene flow (Nm) was calculated to ascertain the conditions of gene communication among populations and was estimated as follows: Nm = (1 - FST)/4 FST (Rogers and Harpending 1992). FST and Nm were calculated using the software ARLEQUIN.
Historical demography and divergence time estimate
The dynamics of population size fluctuations and divergence time were estimated using the Bayesian skyline plot (BSP) method implemented in BEAST 1.7.4 (Drummond and Rambaut 2007). This approach incorporated uncertainty in the genealogy by using Markov chain Monte Carlo (MCMC) integration under a coalescent model, in which the timing of dates provided information about effective population sizes through time. Chains were run for 100 million lengths and the first 10% discarded as 'burn-in'. The substitution model was selected according the result of jMODELTEST 2.1.1 (Darriba et al. 2012). We applied 10 grouped coalescent intervals and constant growth for the skyline model. Because no fossil data were available to calibrate the mutation rate, we assumed a conventional molecular clock for the avian mitochondrial DNA gene (2 × 10⁻⁸ per site per million years; Weir and Schluter 2008). Demographic history through time was reconstructed using Tracer 1.5 (Drummond and Rambaut 2007).
We conducted two types of analyses for mtDNA in T. tibetanus and T. himalayensis as implemented in Arlequin to examine possible demographic expansions with each population in the species. First, Tajima's D (Tajima 1989) and Fu's FS (Fu 1997) were calculated to assess possible expansions; large negative values of D and FS statistics are in accordance with the expansion hypothesis. Significance was calculated using 10, 000 replicates. Second, pairwise mismatch distributions (Rogers and Harpending 1992) were calculated to examine the demographic expansions of three sympatric locations of the two snowcock species.
Results
Genetic diversity
Genetic diversity parameters, revealed with microsatellites and mitochondria DNA in the two snowcock species, are presented in Table 1. In addition, the compilation of mitochondria genes from GenBank yielded 30 haplotypes of T. tibetanus (Table 1, accession number: JX136799-JX1368336) and 27 haplotypes of T. himalayensis (Table 1, accession number: GQ343513-GQ343549). T. tibetanus in mtDNA showed considerably less haplotype and nucleotide diversity, and fewer polymorphic sites than T. himalayensis (h: 0.83 vs 0.97; π%: 0.43 vs 1.23; S: 34 vs 48). Microsatellites were polymorphic in all populations of T. tibetanus and T. himalayensis. Both average allele number and expected heterozygosity of T. tibetanus were lower than T. himalayensis (Table 1).
Phylogeographical reconstruction
In T. himalayensis, a significant phylogeographical structure and high level of genetic differentiation across the whole range were supported by mtDNA (FST = 0.66, p < 0.001) and microsatellites (FST = 0.11, p < 0.001). By comparison, the level of genetic differentiation across the whole range of T. tibetanus was lower (mtDNA: FST = 0.41, p < 0.001; microsatellite: FST = 0.09, p < 0.001). The values of FST in T. tibetanus between KLS group and the other groups are much higher than the other pairwise FST values based on microsatellite and mitochondria data (Tables 2 and 3). However, the values of FST in T. himalayensis between HQLS group and the other groups are much higher than the other pairwise FST values based on microsatellite and mitochondria data (Tables 2 and 3).
Table
2.
Group pairwise FST estimates based on mitochondria DNA in Tetraogallus
Despite the broad geographic sampling (Fig. 1), there was little phylogenetical structure in T. tibetanus (Fig. 2). The haplotype network in T. tibetanus revealed no major branching events (Fig. 2), although two groups of haplotypes could be differentiated. The first cluster in T. tibetanus was mostly connected with haplotype T4, which was observed in 25% of individuals and distributed in all groups except WKL. All haplotypes from WKL group were unique and clustered together in other groups with low branch. Interestingly, haplotype H9, which was shared by one individual of T. himalayensis from HQLS and two individuals of T. himalayensis from HWKL group, was clustered in T. tibetanus in the second cluster. For T. himalayensis, HWKL group has some haplotypes, which individually shared with HQLS group or HWTS group.
Figure
2.
Phylogenetic relationships among mitochondrial DNA haplotypes. a Mitochondrial DNA Bayesian phylogeny for T. himalayensis and T. tibetanus. The two species structured clades are separated. Each haplotype of T. himalayensis was named Capital H before numbers and T. tibetanus was named capital T before numbers. The color and the source population of haplotypes are as follows: light blue from QLS, dark blue from TGL, dark pink from BKL, dark blue from QDM, green from KLS, brown from WTS, light pink from ETS, dark green from PME. Abbreviations see details in Fig. 1. Numbers above branches indicate BI posterior probabilities. Only bipartitions with bootstrap or posterior probability values above 50 and 0.5, respectively, are shown. b Median-joining network among mitochondrial DNA haplotypes. The haplotypes are indicated by circles, the size of each circle being proportional to the observed frequency of each haplotype. Lines drawn between haplotypes represent mutation events and small red circles represent missing alleles that were not observed
In the two snowcock species, the FCA plotting of individual microsatellite genotypes (Fig. 3) and the results of STRUCTURE (Fig. 4) detected similar patterns as mtDNA without clean geographic clusters. Although the best-fit K for T. tibetanus was five, and for T. himalayensis it was three, we compared the results from K = 2 to 6. For T. tibetanus, at K = 2 to 5, with WKL groups remained as a single cluster. At K higher than three, the QDM split out, while the QLS fell into the rested clusters with no clear relation to geographic locations (Fig. 4). For T. himalayensis, the bar plots showed three-clade structure (HETS, HQDM and HPME) when K was set to 3. At K = 4, HQLS was separated from the rest clusters, while the other clades showed no significant structure (Fig. 4).
Figure
3.
Principal co-ordinates analyses (PCoA) and genetic structure of the two Tetraogallus species. Factorial correspondence analysis (Benzecri 1973), computed using GENETIX 4.02, shows relationships among the multilocus genotypes of different T. himalayensis and T. tibetanus populations. Axis 1, Axis 2 and Axis 3 are the first, second and third principal factors of variability
Figure
4.
Bar plot derived from Bayesian-based cluster analysis in STRUCTURE. Posterior probabilities (q) for T. himalayensis and T. tibetanus groups are analyzed by STRUCTURE. The proportion of color in each bar represents the assignment probability of an individual, corresponding to different groups of T. tibetanus and T. himalayensis
Historical demography and divergence time estimate
The effective population sizes and demographic trends estimated by the Bayesian skyline plot (BSP) analysis indicated recent population size increases in T. tibetanus (Fig. 5a). Bayesian skyline plots indicated that T. himalayensis maintained a relatively stable population size from 0.06 to 0.003 million years (Mys) ago, after which its population size decreased rapidly (Fig. 5b). The total effective population size of T. tibetanus was always larger than T. himalayensis (Fig. 5). The divergence time between T. tibetanus and T. himalayensis was estimated to be 2.0 Mys ago (95% HPD: 0.9-3.7 Mys ago).
Figure
5.
Bayesian skyline plot representing historical demographic trends in sampled Tetraogallus tibetanus (a) and T. himalayensis (b). Time is reported on the X-axis as years before present. Estimations were based on a mutation rate of 2 × 10⁻⁸ substitutions per site per year. Ne, the product of the effective female population size and the generation time (in years, log-transformed), is reported on the Y-axis. Estimates are joined by a solid line, whereas dashed lines mark the 95% highest probability density limits
The pairwise comparisons of two snowcocks with their respective outgroup species found no significant deviation from neutrality (p > 0.05) in the McDonald-Kreitman neutrality test (McDonald and Kreitman 1991). The significantly negative values of Tajima's D and Fu's FS support a recent demographic expansion of T. tibetanus (Additional file 1: Figure S1) but stable population size of T. himalayensis with insignificantly positive values of Tajima's D and Fu's FS (see Table 1 and Additional file 1: Figure S1).
Discussion
Genetic variation and the influence of species-specific biological traits
In this study, we investigated phylogeographical patterns for two sister avian species of the Qinghai-Tibetan Plateau and adjacent mountains, which showed a distinct difference in genetic diversity, despite some similar life history traits. Thirty haplotypes with 80 individuals were found in mitochondria DNA regions in T. tibetanus whereas 27 haplotypes with only 67 individuals were detected in the same mitochondria DNA regions in T. himalayensis. The lack of consistency in genetic patterns of sympatric species could reflect historical differences between the species possibly attached historical population isolation and sizes of refugial populations, response to biogeographical barriers, rates of molecular evolution or selective pressures. In 3 of the 25 sampled areas where the two species co-occur, T. himalayensis is more abundant in the western QTP and Pamir Plateau than T. tibetanus (Fig. 1), where the dry season is longer and more severe than in the center of QTP. T. himalayensis was documented to be more tolerant to drought than T. tibetanus (Liu 1999). It is probable that the two sister species might have evolved different tolerances to stresses for cold, hypoxia and drought.
We conducted a comparative assessment of phylogeographical structure in the two snowcocks with biological differences in the Qinghai-Tibetan Plateau and adjacent regions. A striking difference was observed in the genetic diversity, phylogeographic and population dynamics of the two species, which highlights the importance of species-special biological traits, such as breeding behavior and habitat preference on genetic variation and distribution patterns (Fang et al. 2017). It supported previous comparisons of the phylogeography in sympatrically distributed birds, which have revealed the influence of species-specific features on the genetic variation of populations (Qu et al. 2009; Zhang et al. 2012).
Effect of the quaternary glaciations on the phylogeographic pattern and historical demography of two species
Phylogeny and network both point to the importance of intrinsic biological features in structuring genetic diversity and population dynamics. T.tibetanus and T. himalayensis haplotypes are clearly distinct except for H9 from T. himalayensis, which presented in T. tibetanus clusters. It might indicate that at least 4.5% (3/67) of wild T. himalayensis individuals were offspring of female T. tibetanus (Fig. 2). In general, pairwise FST was relatively high, with few localities sharing haplotypes in T. himalayensis. T. himalayensis exhibits divergent and structured lineages. Species on the western low-elevation region, with its north extending mountains, appear to have experienced colonization via dispersal followed by isolation and divergence, which has many discontinuous mountain ranges. They appear to have experienced fragmentation, sometimes staged, of wide-ranging ancestral populations. The most extensive divergence occurred within Gansu, Qinghai and Xinjiang, separating eastern and western populations (Wang et al. 2011). For T. himalayensis, a vicariant event, as a consequence of geological isolation and desert expansion, might have produced the significant divergence between the groups from Gansu and Xinjiang (Janecka et al. 2017). We also found KLS group had the biggest pairwise values among other groups in T. tibetanus, which is consistent with the fragmented distribution of the Snow Leopard in this area (Li et al. 2016). As T. himalayensis inhabits middle to high elevation, human activities including mining and infrastructure are more harmful to T. himalayensis genetic diversity. Smaller effective population sizes in T. himalayensis than in T. tibetanus throughout history could also explain the differences between these two species.
The species T. tibetanus did not display a clear phylogeographic pattern. The lack of distinct mtDNA lineages is consistent with previous studies in the QTP region showing weaker Pleistocene refugia effects (Lei et al. 2014; Janecka et al. 2017). In the Central Asian mountains, the Quaternary glaciations have been well developed and intensively influenced the birds of this mountain region (Lei et al. 2014). During cold periods, many warm-adapted species were locally extirpated, due to the advance of major ice sheets. With respect to the mountain cold-adapted animals, the glacier during the cold glacial periods has created connectivity and interglacial refugia that might have served as a gene pool and maintained high levels of genetic diversity during the warming periods (An et al. 2015; Li et al. 2016). One of the haplotypes T4 existed in each group but WKL group (Fig. 2). It means the founder effect could be prevailing during the glacial cold in the QTP. Refugia usually have a relatively stable climate and complex landscape topography, and thus offer the best chance for survival of many taxa when climate changes (Ashcroft et al. 2012), which might explain no genetic structure in T. tibetanus. The absence of T. tibetanus genetic structure is also probably due to recent expansion, which can be seen in Bayesian skyline analysis and mismatch distribution of genetic variations. The two species are sympatric in the Kunlun Mountains and Qilian Mountains, although they have different habitat preferences. T. tibetanus prefers habitat with dwarf shrub and may not extend to areas with elevations lower than 3000 m. In contrast, T. himalayensis in the warmer and drier habitats in low-elevation environments appears to have been less affected by the relatively recent, milder glaciations, and more so by harsher and extensive glaciations (Liu 1999). Hence, the T. himalayensis is more influenced by geographical barriers to gene flow than T. tibetanus in higher altitude (more than 3000 m) and human activities, which are likely to decrease habitat connectivity and cause population decline. Notably, T. himalayensis populations experienced decline since 0.003 Mys ago due to habitat loss, fragmentation, and increasing human activities in the relatively low altitude. We consider these are the main factors shaping the genetic structure of T. himalayensis. The ridges and valleys of the mountains create physical barriers that limit animal dispersal and cause deterministic local variation in rainfall during periods of disturbances of its natural habitats. In contrast, with more plastic ecological requirements, better adaptability and less complex breeding behavior, T. tibetanus has better chances to expand its distribution, resulting in less geographically structured genetic patterns. T. tibetanus as a bird which inhabits the alpine zone between snow line and tree line, is less affected by human activities, which is consistent with the sympatric species Snow Leopards (Li et al. 2016). These results indicate that species with different life histories may respond differently when facing environmental fluctuations during ice ages as well as present-day habitat fragmentation (Qu et al. 2012).
With various behavioral and ecological characteristics, T. tibetanus is more of a habitat generalist than T. himalayensis, with less specific requirements on resources and with more plasticity in food selection (Liu 1999). Interaction between vicariance, dispersal and habitat fragmentation produced the current distribution and genetic diversity. Thus, elevation, topography and cold tolerance appear to drive evolutionary patterns of diversification and demography even among closely related taxa. The comparison of multiple species in genealogical analyses can lead to an understanding of the evolutionary drivers (Qu et al. 2012).
Our results showed low levels of species-level nuclear (FST = 0.098) and high mitochondria genetic differentiation (FST = 0.601), with no haplotype sharing between the two species. Phylogenetic tree and haplotype networks reaffirmed the sympatric population of H9 of physical barriers in structuring neutral genetic diversity. The two species might have experienced different evolutionary history throughout their current distribution. In the present study only a limited number of samples from Western Kunlun Mountain were analyzed, as the region is difficult to access. H9 shared with the three T. himalayensis individuals was clustered in T. tibetanus, but the fact that the unique mitochondria haplotype representative of these two species was not found elsewhere in the populations analyzed suggests at best a limited role of their coexistence. This could be further clarified by more extensive sampling in Western Kunlun Mountains.
In addition, we discuss the main probable factors maintaining species integrity. How do two snowcock sister species T. tibetanus and T. himalayensis coexist? In the last decades, natural breeding in combination with artificial rearing and massive relocations either for harvesting purposes (hunting or fishing) or for sustaining populations of non-game species mostly dealt with vertebrates. This impressive pace of wildlife relocation is raising increasing conservation concern, as the consequential reshuffling may affect taxa in the wild to such an extent that it results into the loss of biological distinctiveness among regions following the replacement of native biotas by locally expanding non-natives.
Conclusion
By comparing genetic structures estimated from mtDNA and nuclear microsatellite DNA, we show that T. himalayensis and T. tibetanus display different spatial genetic structure and demographic history in response to past climate changes. This study supports the hypothesis that the difference in the snowcocks' habitat preference would drive their different phylogeographical patterns, even after experiencing several similar geological events, which might have contributed to the different genetic patterns.
Additional file 1: Table S1. Priori biological differences between Tetraogallus tibetanus and Tetraogallus himalayensis. Table S2. Information of Tibetan Snowcock and Himalayan Snowcock samples used in this study.
Figure S1. Mismatch distribution for mitochondria DNA in three sympatric locations of Tetraogallus tibetanus and T. himalayensis.
Acknowledgements
We sincerely thank the past Prof. Naifa Liu of School of Life Sciences, Lanzhou University for instructions on snowcock project and sample accumulations, Dr. Bo Cao of College of Earth and Environmental Sciences, Lanzhou University for map drawing. Special thanks go to the three anonymous reviewers for their valuable comments and suggestions.
Authors' contributions
LZ and YW did the fieldwork. LZ and BA conceived and designed the research and wrote the manuscript. LZ and BA organized the collection of the specimens and species identification. SS and BA performed laboratory experiments and analysed the data. All authors read and approved the final manuscript.
Availability of data and materials
The datasets used and/or analyzed during the current study are available from the corresponding author on reasonable request.
Ethics approval and consent to participate
This study was approved by the Animal Ethics Committee of the Chinese Academy of Medical Sciences at Lanzhou University. All avian specimens were collected and handled in accordance with good animal practice as required by the Animal Ethics Procedures and Guidelines of the People’s Republic of China.
Consent for publication
Not applicable.
Competing interests
The authors declare that they have no competing interests.
BirdLife International. 2012. Grus japonensis and G. vipio. In: IUCN 2012. IUCN Red List of Threatened Species. Version 2012.1. . Accessed on 09 July 2012.
Bradter U, Gombobaatar S, Uuganbayar C, Grazia TE, Exo KM. 2005. Reproductive performance and nest-site selection of White-naped Cranes Grus vipio in the Ulz river valley, north-eastern Mongolia. Bird Conserv Int, 15: 313-326.
Cheng L, Li XM. 2006. The status and conservation of Cranes in Heilongjiang Province. Territ Nat Resour Study, 1: 90-91. (in Chinese with English abstract)
Feng KM, Li JL. 1985. Aerial surveys of the Red-crowned Cranes and other waterflowls in China. J Northeast Forest Univ, 13(1): 80-87. (in Chinese with English abstract)
Feng SZ, Liu HJ, Yu WT, Jiang ZD. 2005. The survey on bird diversity in Xingkai Lake, China. Wetland Sci, 3(2): 149-153. (in Chinese with English abstract)
Frederick PC, Towles T, Sawicki RJ, Bancroft TG. 1996. Comparison of aerial and ground techniques for discovery and census of wading bird (Ciconiiformes) nesting colonies. Condor, 98: 837-841.
Fujita G, Harris J, Bold A, Tseveenmayadag N, Chuluunbatar S. 1994. Habitat preference of Demoiselle and White-napped Cranes, Anthropoides virgo and Grus vipio, breeding in Mongolia. In: Higuchi H, Minton J (eds) The Future of Cranes and Wetlands. Wild Bird Society of Japan, Tokyo, Japan, pp 93-96.
Han YL, Ge DN, Zhang YX. 2003. The research about birds resource and conservation in Sanjiang Plain. Territ Nat Resour Study, 1: 76. (in Chinese with English abstract)
Hanski I. 1998. Metapopulation dynamics. Nature, 396: 41-49.
Harris J. 1994. Cranes, people and nature: preserving the balance. In: Higuchi H, Minton J (eds) The Future of Cranes and Wetlands. Wild Bird Society of Japan, Tokyo, Japan, pp 1-14.
Hilton-Taylor C. 2000. IUCN Red List of Threatened Species. Gland, Switzerland and Cambridge, UK: IUCN.
Hua Y, Li XM, Liu XC, Sun ZY. 2006. Comparison of bird diversity during spring and autumn in Honghe Nature Reserve. J Northeast Forest Univ, 34(3): 23-28. (in Chinese with English abstract)
Jiang HX, Liu CY, Qian FW, Li CY, Qiu FC. 2009. A model of nest-site selection of Red-crowned crane based on RS, GIS and GPS techniques at Zhalong wetland, China. Sci Silv Sin, 45(7): 76-83. (in Chinese with English abstract)
Lee SD, Jablonski PD, Higuchi H. 2007. Winter foraging of threatened cranes in the Demilitarized Zone of Korea: behavioral evidence for the conservation importance of unplowed rice fields. Biol Conserv, 139(1-2): 286-289.
Li FM, Li PX. 1998. A comparative study on territories of White-napped Crane and Red-crowned Crane. Acta Zool Sin, 44(1): 109-111. (in Chinese with English abstract)
Li FM, Li PX. 1999. A comparative study on territories of White-napped Crane and Red-crowned Crane. China J Ecol, 18(6): 33-37. (in Chinese with English abstract)
Li XM, Hu YM, Ma YJ, Jia JL. 2003. Status and conservation of cranes in Sanjiang Plain. Territ Nat Resour Study, 1: 74-75. (in Chinese with English abstract)
Liu HY, Li ZF. 2008. Effects of landscape change of wetlands on habitats of waterfowls within Honghe Nature Reserve by its surrounding area. Acta Ecol Sin, 28(10): 5011-5019. (in Chinese with English abstract)
Liu HY, Zhang SK, Li ZF, Lv XG, Yang Q. 2004. Impacts on wetlands of large-scale land-use changes by agricultural development: The small Sanjiang Plain, China. Ambio, 33(6): 284-288. (in Chinese with English abstract)
Liu XT. 1997. Marsh resource and its sustainable utility in the Songnen-Sanjiang Plain. Sci Geogr Sin, 16(Suppl. ): 451-460. (in Chinese with English abstract)
Liu XT. 2000. Influence of large-scale reclamation on natural environment and regional environmental protection in the Sanjiang Plain. Sci Geogr Sin, 20: 14-19. (in Chinese with English abstract)
Liu XT, Ma XH. 2002. Natural Environmental Changes and Ecological Protection in the Sanjiang Plain. Science Press, Beijing. (in Chinese)
Ma YQ, Jin LR. 1987. The numerical distribution of the Red-crowned Crane in Sanjiang Plain area of Heilongjiang Province. Acta Zool Sin, 33(1): 82-87. (in Chinese with English abstract)
Masatomi H, Ogawa S, Miyama K. 1990. The relations between land cover monitored by satellite remote sensing and distribution of the Tancho's nests in Kushiro Marsh, Hokkaido. J Hokkaido Coll, Sensu Univ, 23: 209-223.
Mcgarigal K, Cushman SA, Neel MC, Ene E. 2002. FRAGSTATS v3: Spatial Pattern Analysis Programme for Categorical Maps. Computer software programme produced by the authors at the University of Massachusetts, Amherst. . Accessed on 10 October 2008.
Noss RF, Murphy DD. 1995. Endangered species left homeless in sweat home. Conserv Biol, 9: 229-231.
Pang SL. 2000. The report on the aerial survey of Red-crowned Crane in the Zhalong Nature Reserve. J Sci Teach Coll Univ, 20(2): 59-60. (in Chinese)
Piao RZ, Han AH, Zhang MH. 2000. Remote sensing and geographic information system to estimate habitat selection of red-crowned crane in Sanjiang Plain of Northeastern China. In: China Ornithology Association, Wild Bird Society of Taipei and China Wildlife Conservation Association (eds) Studies on Chinese Ornithology — Proceedings of the 4th Ornithological Symposium of Mainland and Taiwan, China. China Forestry Publishing House, Beijing, pp 170-197. (in Chinese with English abstract)
Prugh LR, Hodges KE, Sinclair ARE, Brashares JS. 2008. Effect of habitat area and isolation on fragmented animal populations. PNAS, 105(52): 20770-20775.
Rodgers JA, Kubilis PS, Nesbitt SA. 2005. Accuracy of aerial surveys of waterbird colonies. Waterbirds, 28(2): 230-237.
Schmidt BD, Roland J. 2006. Moth diversity in a fragmented habitat: importance of functional groups and landscape scale in the boreal forest. Ecol Popul Biol, 99: 1110-1120.
Smirenski SM. 1988. Chick relationships and brood sizes in Red-crowned (Grus japonensis) and White-napped (Grus vipio) Cranes. In: Litvinenko NM, Neufeldt IA (eds). The Palearctic Cranes. Amur-Ussuri Branch of the USSE Ornithological Society, Vladivostok. USSR, pp 49-53.
Smirenski SM, Harris J, Gray C, Strom K, Ichida N. 1995. Report of the Amur program of the Socio-Ecological Union. In: Halvorson CH, Harris JT, Smirenski SM (eds) Cranes and storks of the Amur River: the Proceedings of the International Workshop. Arts Literature Publishers, Moscow, Russia, pp 205-212.
Song KS, Liu DW, Wang ZM, Zhang B, Jin C, Li F, Liu HJ. 2008. Land use change in Sanjiang Plain and its driving forces analysis since 1954. Acta Geogr Sin, 63(1): 94-104. (in Chinese with English abstract)
Su LY, Xu J, Zhou DS. 1991. Breeding habitats of White-napped Cranes at Zhalong Nature Reserve. In: Harris J (eds) Prodeedings of 1987 International Crane Workshop. International Crane Foundation, Baraboo, Wisconsin, USA, pp 51-57. (in Chinese)
Su LY, Wang QS. 2010. The mainland population of the red-crowned crane faces growing threat. China Crane News, 14(1): 3-8.
Swift TL, Hannon SJ. 2010. Critical thresholds associated with habitat loss: a review of the concepts, evidence, and applications. Biol Rev, 85: 35-53.
Temple SA. 1986. The problem of avian extinctions. Curr Ornithol, 3: 453-485.
Wang QS. 2008. Threats for Red-crowned Crane. China Crane News, 12(2): 7-12.
Yang XJ, Zhang SM, Zhang XX, Feng WY. 2005. The composing and analysis of large waterbirds diversity in the Sanjiang Plain. J Northeast For Univ, 33(3): 56-58. (in Chinese with English abstract)
Zhang GC, Deng W, Lu XG, Song KS, Li HD, Zhang HY. 2007. The dynamic change of wetland landscape patterns in Xinkai River Basin. J Nat Resour, 22(2): 204-210. (in Chinese with English abstract)
Zhang SQ, Na XD, Kong B, Wang ZM, Jiang HX, Yu H, Zhao ZC, Li XF, Liu CY, Patricia D. 2009. Identifying wetland change in China's Sanjiang Plain Using Remote Sensing. Wetlands, 29(1): 302-313.
Zhao KY (ed). 1999. Chinese Mire Records. Science Press, Beijing. (in Chinese)
Zhou DS, Su LY. 1990. Preliminary study on the territory behavior of Red-crowned Crane. In: Heilongjiang Forestry Department (ed) Conservation and Research of International Cranes. China Forestry Publishing House, Beijing, pp 54-58. (in Chinese)
Zou HF, Wu QM, Ma JZ. 2003. The nest-site selection of Red-crowned crane in Zhalong Nature Reserve after burning and irrigating. J Northeast Norm Univ, 35(1): 54-59. (in Chinese with English abstract)
Marcel M. Lambrechts, D. Charles Deeming. Nest Design and Breeding Success: Replicability of Methodologies and Research Findings in Secondary Hole Nesting Passerines. Birds, 2024, 5(2): 278.
DOI:10.3390/birds5020019
2.
D. Charles Deeming, Morgan Merrils-Brown. Architecture differentially affects thermal properties of Song Thrush Turdus philomelos nest walls. Bird Study, 2024, 71(3): 277.
DOI:10.1080/00063657.2024.2358873
3.
Kevin B. Briggs, Mark C. Mainwaring. Anthropogenic material in pied flycatcher (Ficedula hypoleuca) nests varies with local habitat features and between nest sections. Environmental Advances, 2024, 15: 100486.
DOI:10.1016/j.envadv.2024.100486
4.
Michael E. Akresh, David Mandell, Peter P. Grima, et al. Differential use of nest materials and niche space among avian species within a single ecological community. Ecology and Evolution, 2024, 14(9)
DOI:10.1002/ece3.70142
5.
Denis Charles Deeming. A Review of the Roles Materials Play in Determining Functional Properties of Bird Nests. Acta Ornithologica, 2023, 58(1)
DOI:10.3161/00016454AO2023.58.1.001
6.
Yihenew Aynalem, Afework Bekele, Bezawork Afework Bogale. Breeding biology of the helmeted guineafowl (Numida meleagris meleagris, Linnaeus 1758) in Western Ethiopia. Ornithology Research, 2023, 31(3): 173.
DOI:10.1007/s43388-023-00132-6
7.
Kevin B. Briggs, D. Charles Deeming, Mark C. Mainwaring. Plastic is a widely used and selectively chosen nesting material for pied flycatchers (Ficedula hypoleuca) in rural woodland habitats. Science of The Total Environment, 2023, 854: 158660.
DOI:10.1016/j.scitotenv.2022.158660
8.
Tatiana V. Shupova, Serhii M. Koniakin, Tetiana O. Grabovska. Multi-species settlement by secondary hollow-nesting passerine birds in a European Bee-eater (Merops apiaster) colony. Ornis Hungarica, 2022, 30(1): 179.
DOI:10.2478/orhu-2022-0014
9.
Marcel M. Lambrechts, Samuel P. Caro. Egg cooling associated with nest size in a passerine bird. Journal of Thermal Biology, 2022, 110: 103383.
DOI:10.1016/j.jtherbio.2022.103383
10.
Kevin B. Briggs, D. Charles Deeming. Effects of Year and Box Size on Construction of Eurasian Nuthatch Sitta europaea Nests. Ardea, 2022, 110(1)
DOI:10.5253/arde.v110i1.a5
11.
Amy M Dickinson, Emily Locke, Liberty A Gray, et al. Composition of nests constructed by species in the Motacillidae, Sylviidae and Prunellidae. Avian Biology Research, 2022, 15(1): 21.
DOI:10.1177/17581559211066083
12.
Kevin B. Briggs, D. Charles Deeming, Mark Mainwaring. Plastic is a Widely Used and Preferentially Chosen Nest Material for Birds in Rural Woodland Habitats. SSRN Electronic Journal, 2022.
DOI:10.2139/ssrn.4122959
13.
Kevin B. Briggs, D. Charles Deeming. Localized habitat affects size and materials used in the construction of Common Redstart Phoenicurus phoenicurus nests. Bird Study, 2021, 68(1): 9.
DOI:10.1080/00063657.2021.1958197
14.
D. Charles Deeming, Eve Humphreys. Insulation of Common Chaffinch Fringilla coelebs Nests is Largely Driven by Animal-Derived Materials in the Cup Lining. Acta Ornithologica, 2021, 55(2)
DOI:10.3161/00016454AO2020.55.2.010
15.
Anne L. Goodall, D. Charles Deeming, Lucia E. Biddle. Use of ‘tree tin’ nesting sites by the Eurasian Treecreeper Certhia familiaris, with notes on nest composition. Ringing & Migration, 2019, 34(2): 124.
DOI:10.1080/03078698.2019.1887669
Table
1.
Genetic diversity of populations of T. tibetanus and T. himalayensis, with mitochondria DNA control sequences (mtDNA) and 7 nuclear microsatellite markers (STR)
Group
mtDNA
Microsatellite
N
n
K
h
π (%)
Tajima'D (p)
Fu's FS (p)
N
NA
AR
HO
HE
FIS
Tetraogallus tibetanus
BKL
11
6
0.55
0.35
0.06
- 0.54 (0.13)
- 1.59 (0.03)
9
4.14
4.0
0.57
0.73
0.02
WKL
7
5
4.0
0.71
0.45
- 0.99 (0.18)
1.25 (0.71)
7
4.14
4.1
0.57
0.72
0.02
TGL
29
22
2.61
0.92
0.30
- 1.37 (0.07)
- 11.48 (0.00)
33
9.43
6.6
0.47
0.69
0.19
QDM
14
12
5.86
0.95
0.67
0.39 (0.67)
- 1.98 (0.14)
14
5.43
4.6
0.50
0.66
0.13
QLS
19
9
3.17
0.89
0.36
- 0.28 (0.41)
- 1.72 (0.19)
19
9.29
5.3
0.53
0.81
0.02
Tetraogallus himalayensis
HETS
12
5
3.47
0.86
0.39
0.20 (0.61)
1.146 (0.73)
19
15.45
5.57
0.05
0.71
0.74
HWKL
24
9
6.45
0.91
0.73
- 1.02 (0.14)
1.43 (0.76)
36
24.29
8.71
0.12
0.83
0.69
HWTS
10
5
3.11
0.87
0.35
0.43 (0.67)
0.41 (0.60)
10
11.29
4.71
0
0.71
0.67
HQDM
7
4
9.81
0.85
1.13
1.13 (0.91)
3.38 (0.94)
7
11.68
3.86
0.14
0.74
0.46
HQLS
9
5
6.39
0.83
0.74
- 1.52 (0.06)
1.81 (0.79)
23
19.43
6.86
0.10
0.77
0.70
HPME
5
3
1.40
0.80
0.16
- 0.17 (0.46)
0. 06 (0.31)
14
13.14
5.57
0.20
0.70
0.67
N: sample size, n: number of haplotypes, K: average number of nucleotide differences, h: haplotype diversity, π: nucleotide diversity, NA: number of alleles per locus, AR: allelic richness, HO: observed heterozygosity, HE: expected heterozygosity, FIS: inbreeding coefficient


 DownLoad:


 Email Alerts
 RSS Feeds