Canwei XIA, Rong HUANG, Changchun WEI, Pinwen NIE, Yanyun ZHANG. 2011: Individual identification on the basis of the songs of the Asian Stubtail (Urosphena squameiceps). Avian Research, 2(3): 132-139. DOI: 10.5122/cbirds.2011.0024
Citation:
Canwei XIA, Rong HUANG, Changchun WEI, Pinwen NIE, Yanyun ZHANG. 2011: Individual identification on the basis of the songs of the Asian Stubtail (Urosphena squameiceps). Avian Research, 2(3): 132-139. DOI: 10.5122/cbirds.2011.0024
Canwei XIA, Rong HUANG, Changchun WEI, Pinwen NIE, Yanyun ZHANG. 2011: Individual identification on the basis of the songs of the Asian Stubtail (Urosphena squameiceps). Avian Research, 2(3): 132-139. DOI: 10.5122/cbirds.2011.0024
Citation:
Canwei XIA, Rong HUANG, Changchun WEI, Pinwen NIE, Yanyun ZHANG. 2011: Individual identification on the basis of the songs of the Asian Stubtail (Urosphena squameiceps). Avian Research, 2(3): 132-139. DOI: 10.5122/cbirds.2011.0024
We analyzed the songs of the Asian Stubtail (Urosphena squameiceps), a migratory passerine that breeds in northeast Asia. The possibility of individual identification of this species by songs was examined in a population in northern China during the breeding season of 2010. Individuality was determined using discriminant function analysis, artificial neural networks and spectrographic cross-correlation. Our results show that, the rate of correct classification is satisfactory in this species, regardless of methods. From an applied perspective, spectrographic cross-correlation is most suitable. Besides its maximum rate of correct classification (89.4%), it does not require measurements of spectrograms, which is a necessity other methods and may introduce artificial errors. We hope that our result of individual identification on the basis of acoustic signals may open up a new research venue for this species.
Considerable work in wildlife research requires the identification of individuals (Terry et al., 2005; Fox, 2008). Many techniques for capturing and marking individuals are highly invasive and may have an effect on the behavior of target individuals (Rogers and Paton, 2005; Saraux et al., 2011), thus violating the assumption that the sample under study accurately reflects the ecology of the species population (Bernardo et al., 2011). Acoustically-mediated individual discrimination has been the focus of several recent investigations of avian taxa (Catchpole and Slater, 1995; McDonald et al., 2007). The use of vocalizations as a non-invasive method for 'marking' or identifying (recognizing) individual birds is also being increasingly used in ornithological research, especially in situations where the use of markers (e.g. colored rings) would be difficult to observe, where birds are extremely sensitive to disturbance, or where the capture and handling of birds poses many logistical or ethical issues (Rogers and Paton, 2005; Terry et al., 2005; Grava et al., 2008).
The Asian Stubtail (Urosphena squameiceps) is a small migratory passerine that is breeding in northeast Asia and overwinters in south and southeast Asia (del Hoyo et al., 2006). It is a co-operative breeding species (Ohara and Yamagishi, 1984). Due to its secret behavior in shrubs, it is difficult to detect the species by vision. During the breeding season, they sing a high-pitched cicada-like song as "see-see-see-see" (del Hoyo et al., 2006). Individuality is a common phenomenon, involving vision, smell and audio signals (Dale et al., 2001; Tibbetts and Dale, 2007). Considering its cryptic plumage color and its habitat in dense undergrowth, we infer that its individuality may be best guaranteed by their vocal communication. Hence, individual birds could be identified by features of their vocalizations.
Our aim was to reveal the vocal individuality in the Asian Stubtail. First, we tried to find out whether this species shows vocal individuality. Second, by carrying out discriminant function analysis, artificial neural networks and spectrographic cross-correlation, we assessed the feasibility of using acoustic signals to identify individual birds.
Material and methods
Study site and fieldwork
We conducted our research in the Xiao Longmen Forest Park (40°00′N, 115°26′E), 114 km west of Beijing, China. This forest park is 705.4 ha in size with elevations between 1000 and 1763 m. With a mean annual temperature of 4.8℃ and annual precipitation ranging between 500–700 mm, the vegetation is dominated by secondary temperate deciduous broad-leaf forests with patches of coniferous plantations (Wang et al., 2008). It has been our fieldwork station for more than twenty years.
The fieldwork was carried out from 26 May to 6 June 2010, during which the Asian Stubtail breeds in the study area and sings territorial songs intensively at dawn. Individual birds were located by their territorial song and mapped by GPS. We recorded several recordings from each of two individuals, and collected one recording from each of other males. To ensure different recordings from various individuals, each recording site was sufficiently far away from others and separated by a ridge or valley. We recorded songs with a TASCAM HD-P2 portable digital recorder (Tascam Co., Japan) and a Sennheiser MKH416 P48 external directional microphone (Sennheiser Co., Germany). Songs were recorded at a sampling rate of 44.1 kHz and 16 bits. Recordings were primarily collected within distances of 20 m; distances between the microphone and the singing bird were estimated. All the recordings we collected were spontaneous.
Date selection and song spectrograms
In total, we located 15 territorial individuals and obtained 317 bouts of songs from 10 birds. From one individual we managed to record only three bouts of songs and hence this data was removed from the analysis; one recording was accompanied by a high background noise and also removed from subsequent analysis. Finally, eight individuals (each with 12–84 bouts of song, with a mean of 36 bouts per individual) were used in our subsequent analysis. We analyzed the song sound files using a Avisoft-SASLab Pro 4.52 (Avisoft Bioacoustics, Germany). Using a band-pass filter, we filtered the noise to below 1 kHz, which is lower than the Asian Stubtail song frequency. Spectrograms were generated using the following settings: sampling frequency = 22.05 kHz; sample size = 16 bits; FFT length = 256 points; Hamming window: a frame size of 100% and an overlap of 50%; a frequency resolution of 86 Hz and a time resolution of 5.8 ms.
Statistical analyses
To clarify the best method on vocal individuality of the Asian Stubtail, we carried out three different methods, i.e., discriminant function analysis, artificial neural networks and spectrographic cross-correlation.
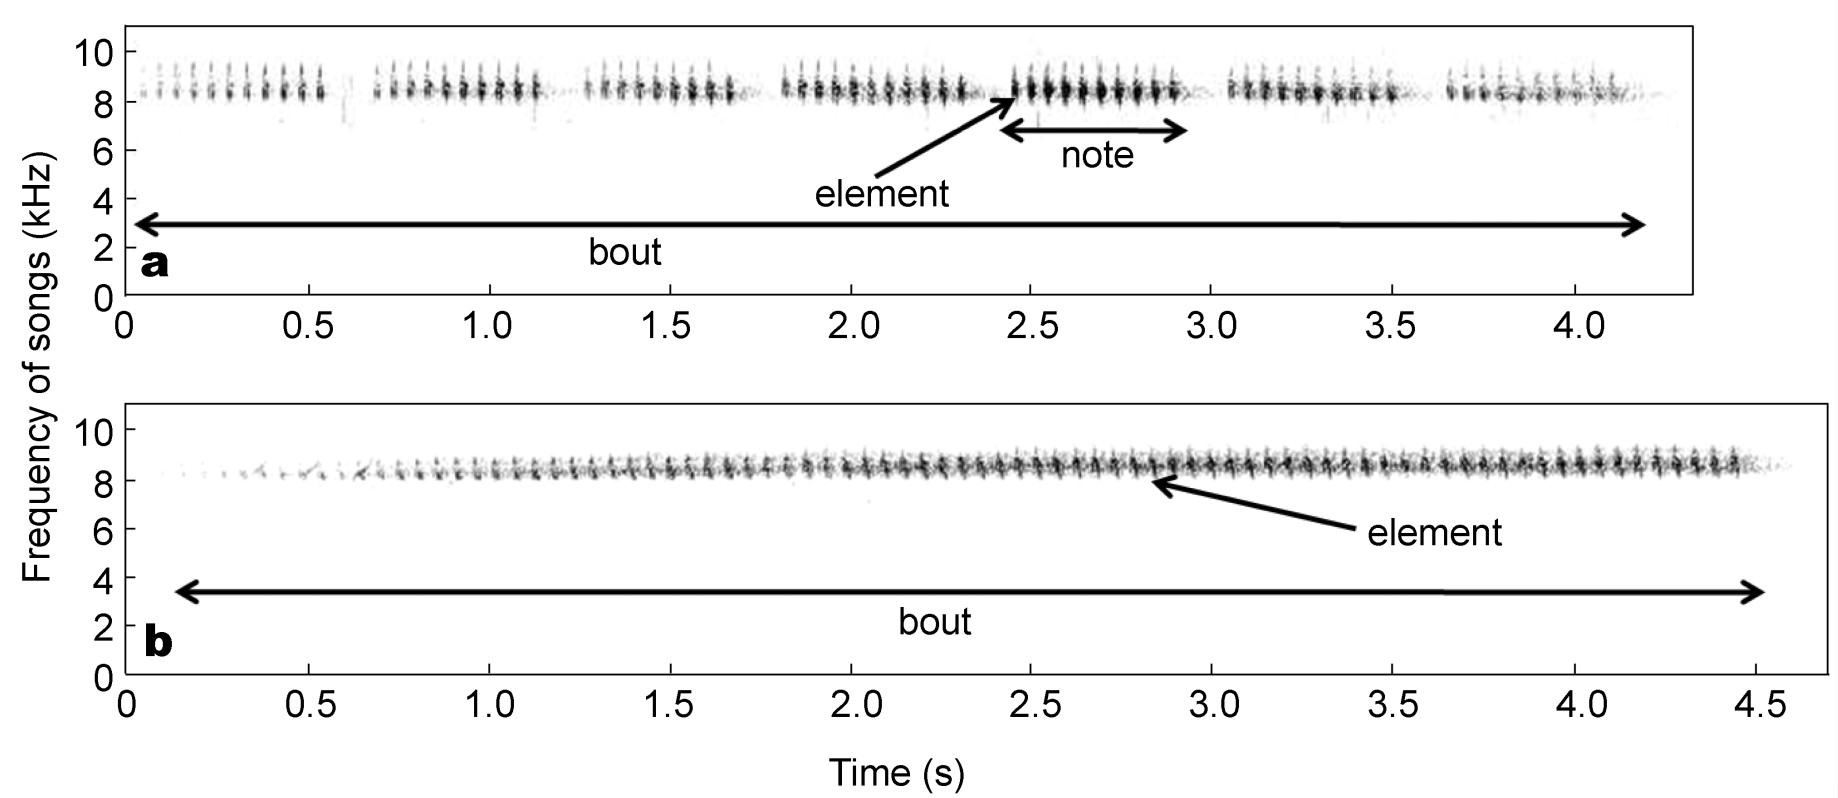
The Asian Stubtail emits their songs as discontinuous bouts, with each bout consisting of a cluster of notes (Fig. 1a) or elements (Fig. 1b). We divided the songs into sects with a duration of 0.25 s, given that the shortest duration of the notes was almost 0.25 s. For each individual bird, we chose 20 sects with a high signal-to-noise ratio. Temporal and frequency variables in sects were measured using automatic parameter measurements. The following variables were measured, referring to the Avisoft-SASLab software and related tools: disttomax (the duration from start to the location of the maximum amplitude); peakfreq (the frequency of the maximum amplitude of the spectrum); quart (the distribution of energy across the spectrum [quartile 25%, quartile 50% and quartile 75%]); entropy (the randomness of sounds). Peakfreq, quartile 25%, quartile 50%, quartile 75% and entropy were measured at five locations: start (the start of the sect); end (the end of the sect); max (the maximum amplitude of the sect); maxentire (the maximum frequency of the sect) and minentire (the minimum frequency of the sect). In total, we measured 26 variables for each sect (Table 1). Since these variables may be correlated, we applied principal component analysis.
Figure
1.
Sound spectrograms of Asian Stubtail (Urosphena squameiceps) songs. The Asian Stubtail emits his song as discontinuous bouts; each bout contains a cluster of notes (a) or elements (b).
Discriminant function analysis builds a predictive model for our eight individual birds. The model is composed of a set of discriminant functions based on linear combinations of the predictor variables that provide the best discrimination between the individuals. The functions are generated from 160 sects for which individuals are known. Results from jack-knifed classifications, in which each song was assigned to an individual, using discriminant functions, calculated from all songs in the data set except the one being classified, were reported as percentages of correctly assigned songs. This provides a conservative estimate of the power of the classification procedure (Xia et al., 2010).
Artificial neural networks
Artificial neural networks is characterized by a large parameter space and flexible structures, unlike traditional statistical methods which usually require a linear relationship between the dependent and independent variables (Fernandez-Juricic et al., 2009). We used a Radial Basis Function, a type of artificial neural network model, which produces a predictive model for dependent variables based on the values of predictor variables. For each individual, 70% sects were assigned to a training sample, while the remaining sects were assigned to a test sample. The results of classifications for training and test samples are reported as percentages of correctly assigned songs.
Spectrographic cross-correlation
Spectrographic cross-correlation produces a lower triangular half matrix in which each similarity value is the peak cross correlation value for a pair of sects. Similarity values for comparisons of a sect with itself and reciprocal comparisons between each pair of sects were omitted. The remaining 160 sects resulted in a half matrix of 12,720 (n(n−1)/2) comparisons of different pairs of sects of each type (Lein, 2008). The mean similarity value of a song with target individual was calculated using the average similarity value of this song with all the songs (excluding itself) from the targeted individual. So, for each song, eight mean similarity values were calculated. Songs are assigned to the individual with the maximum mean similarity value. The results of classifications are reported as percentages of correctly assigned songs.
Principal components analysis, discriminant function analysis and artificial neural networks were carried out using SPSS 17.0 (SPSS Inc.); spectrographic cross-correlation was carried out with the Avisoft Correlator within the Avisoft-SASLab Pro 4.52 (Avisoft Bioacoustics, Germany). All data are given as means ± SD.
Results
Vocal characteristics and individuality
The maximum frequency of songs from individuals who emit their song with a cluster of notes (Fig. 1a) was 8.49 ± 0.11 kHz (n = 5) and the minimum frequency of songs from these individuals 7.95 ± 0.16 kHz (n = 5). The maximum frequency of songs from individuals who emit their song with a cluster of elements (Fig. 1b) was 8.62 ± 0.12 kHz (n = 3) and the minimum frequency of songs from these individual birds 8.13 ± 0.07 kHz (n = 3).
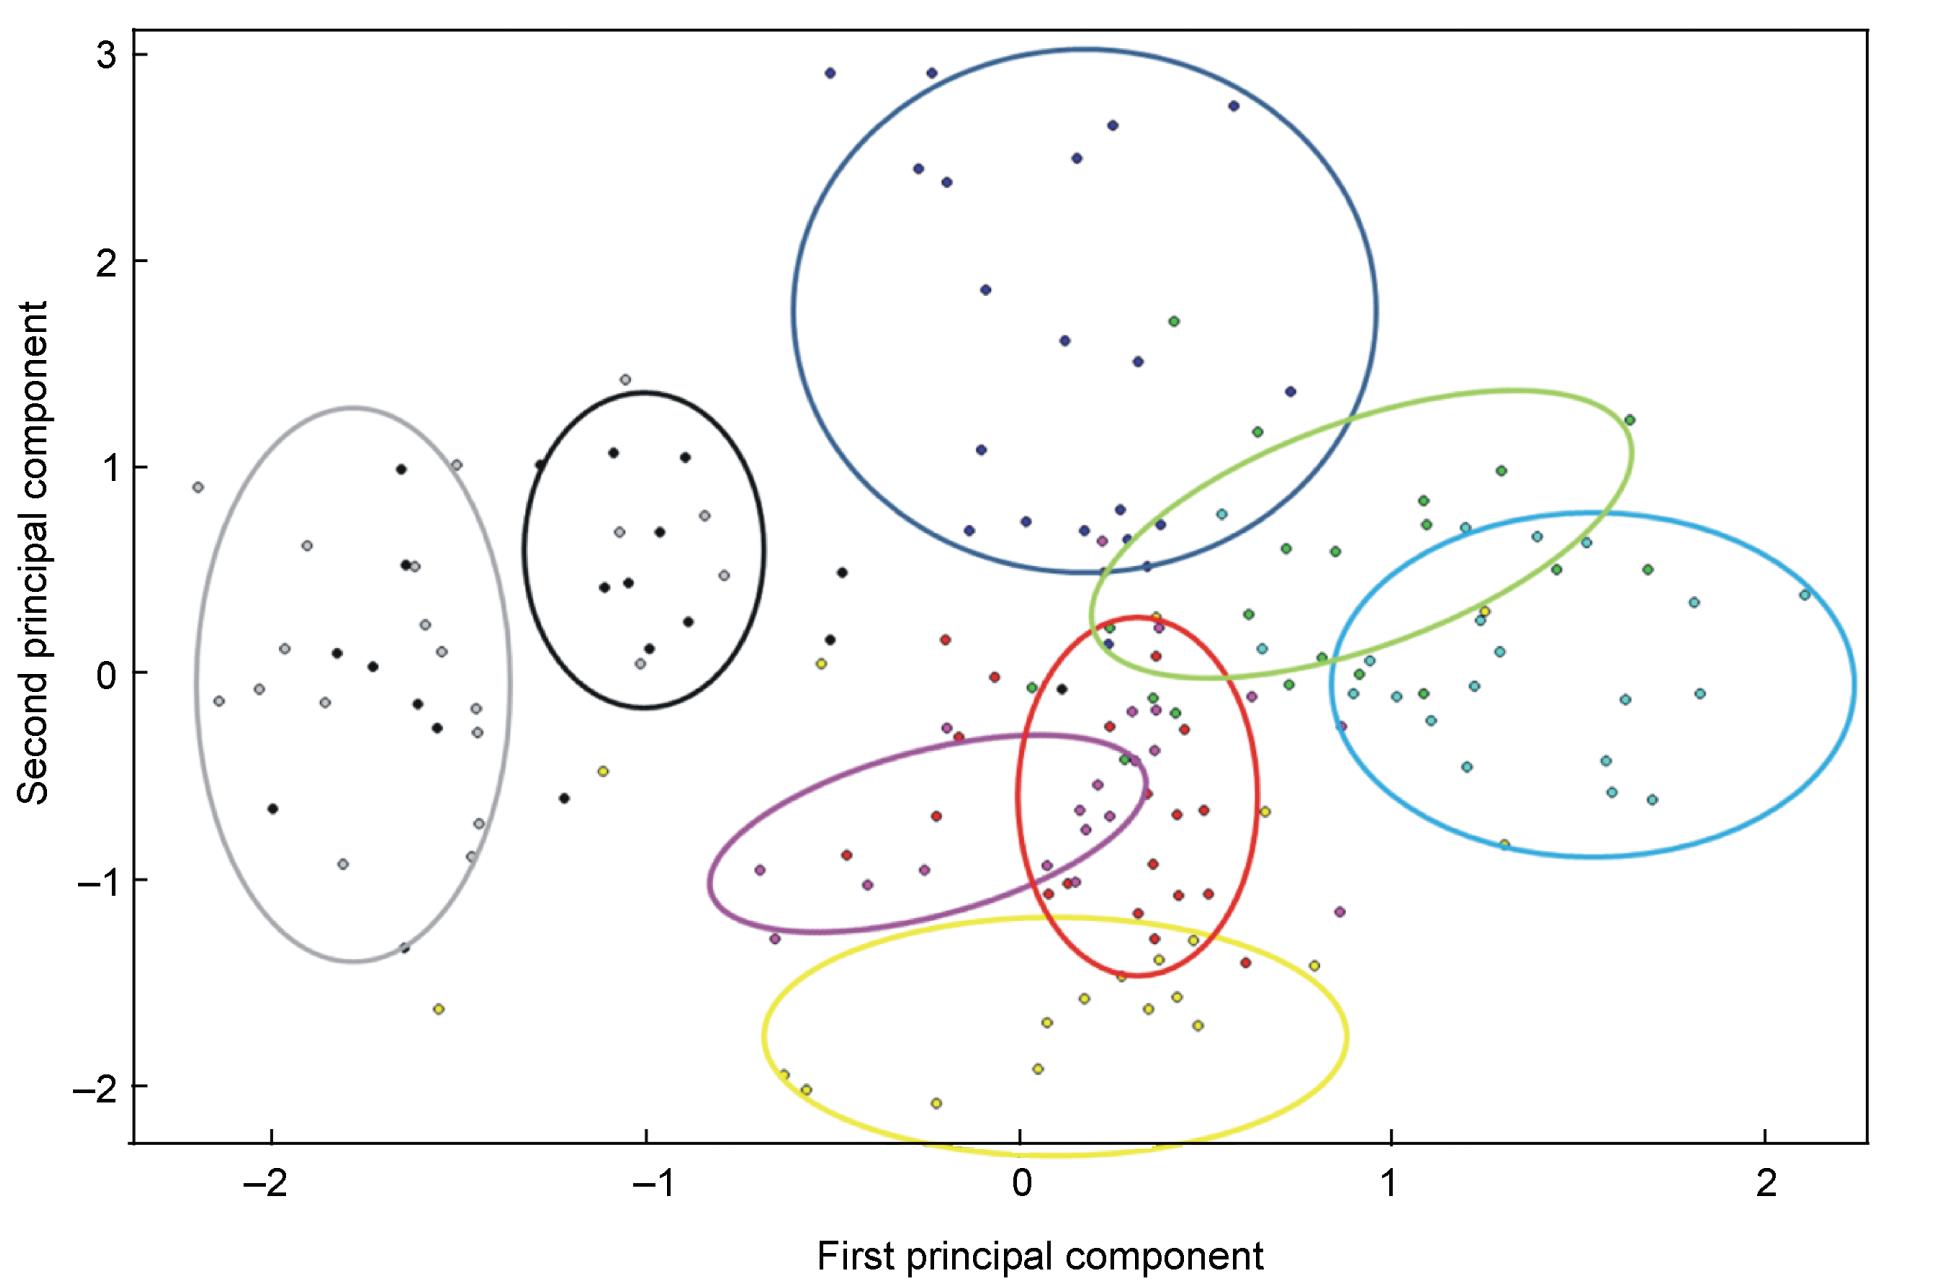
Principal components analysis generated four principal components with eigenvalues > 1.0, explaining 81.0% of the variance in the original 27 variables. The first principal component, which explained 52.4% of the variance, is related to most of the original variables. This implies a high correlation in the original variables. The second principal component, which explained 11.9% of the variance, is related to three variables dealing with entropy. The third principal component, explaining 10.0% of the variance, was related to the three variables measured at the start of the sect. The fourth principal component, which explained 6.8% of the variance, was related to two variables measured at the maximum amplitude of the sect (Table 1). The plot of the first and second principal components show that different individuals are approximately separate, although there was some overlap (Fig. 2). Hence, there is clear vocal individuality in the Asian Stubtail.
Figure
2.
Scatter plot of principal components analysis of the 8 individual Asian Stubtails. Only the first and second principal component were plotted, representing all 27 frequencies and duration variables. The various colored dots represent different individual birds.
The total rate of correct classification of songs, using discriminant function analysis, was 77.5%. For each individual, the rate of correct classification ranges from 60.0% to 85.0% (Table 2). The total rates of correct classification, using artificial neural networks, were 85.5% and 72.1%, depending on the training sample or the test sample. For each individual bird, the rate of correct classification ranged from 61.1% to 100.0% for the training sample (Table 3) and 42.9% to 100.0% for the test sample (Table 4). The total rate of correct classification, using spectrographic cross-correlation, was 89.4%. For each individual bird, the rate of correct classification ranged from 70.0% to 95.0% (Table 5). So, most of the songs could be correctly classified and individual Asian Stubtails can, therefore, be identified on the basis of their songs.
Table
2.
Results of the discriminant function analysis for 8 individuals. 77.5% of the songs were correctly classified by the analysis. All units are given in per cent.
Table
3.
Results of artificial neural networks on training sample for 8 individuals. 85.5% of the songs were correctly classified by the analysis. All units are given in per cent.
Table
4.
Results of artificial neural networks on testing sample for 8 individuals. 72.1% of the songs were correctly classified by the analysis. All units are given in per cent.
Table
5.
Results of spectrographic cross-correlation for 8 individuals. 89.4% of the songs were correctly classified by the analysis. All units are given in per cent.
Acoustic identification of individual birds is widely used on animal monitors in such applications as evaluation of territorial boundaries, map home ranges (Mizutani and Jewell, 1998; Betts et al., 2005), population censuses, monitoring population dynamics (Kemp and Kemp, 1989; Gilbert et al., 1994; Hartwig, 2005) and the detection of dispersal patterns (Laiolo and Tella, 2006; Laiolo et al., 2007), especially in situations where other markers would be difficult to detect (Rogers and Paton 2005; Terry et al., 2005; Grava et al., 2008). The Asian Stubtail is quite difficult to detect by vision and this may be the reason why so little research has been carried out on this secret species. Our results show that individual Asian Stubtails can be identified well and truly by their territorial songs. Individual birds can be marked and identified by their vocalization, which will benefit subsequent research. We conclude that spectrographic cross-correlation is the more suitable method compared with discriminant function analysis and artificial neural networks. Beside its maximum rate of correct classification across the different methods, this method does not require the measurement of spectrograms, which is a necessary process in other methods and may introduce artificial errors (Terry et al., 2005; Grava et al., 2008).
There are some constraints which may restrict the practical ability of acoustic markers. First, acoustic accuracy may be impaired by degradation when sounds are propagated over long distances (Catchpole and Slater, 1995; Grava et al., 2008). To limit this problem, the recordings should be performed as close as possible from the object birds (Grava et al., 2008). The Asian Stubtail may change its position after singing several bouts of a song, so distances between the microphone and the singing bird is not constant (personal observation). However, compared to other analyses of individuality found in passerine species, such as the 86% correct classification for Steere's Liocichla (Liocichla steerii), (Mays et al., 2006), 87% for Bristle-bird (Dasyornis broadbenti) (Rogers and Paton, 2005), 81–86% for the Willow Flycatcher (Empidonax traillii) (Fernandez-Juricic et al., 2009) and 85-86% for the Buff-breasted Flycatcher (Empidonax fulvifrons)(Lein, 2008), the correct classification rates in our work are still quite high. Second, unpredictable singing behavior may impair the possibility to obtain good quality recordings (Grava et al., 2008). During the breeding season, songs of the Asian Stubtail are easily heard at dawn. On the basis of our long-term monitoring, we conclude that the Asian Stubtail sings earlier than other sympatric passerine species, such as the Narcissus Flycatcher (Ficedula narcissina), the Yellow-rumped Flycatcher (Ficedula zanthopygia), the Eastern Crowned Warbler (Phylloscopus coronatus), the Yellow-bellied Tit (Parus venustulus) and the Great Tit (Parus major), which may also decrease jamming the recordings from the songs of other birds. In the end, some authors advice that the stability of vocal individuality, over long time spans, should be taken into account (Terry et al., 2005; Fox, 2008). Most of the variables we measured from our spectrograms concerned the structure of elements. The structure of element changes relatively less than other characteristics, such as the organization of elements and the interval or duration of notes.
Every method has its appropriate range of application. Our vocal identification also has its limits. For example, as for most temperate birds, only territorial males emit songs during the breeding season; the female Asian Stubtail does not sing, hence individual identification on the basis of songs is not appropriate for female identification.
In conclusion, we reiterate that by using features of acoustic signals, we could identify territorial Asian Stubtail males. This may offer a useful tool for investigation of biological information of this little known species. Vocal communication is important for species which inhabit poorly lit environments, such as nocturnal animals and animals living in dense shrubs. Individual identification using acoustic signals may open up a new research venue for these species.
Acknowledgements
This study was supported by National Natural Science Foundation of China (No. J0830630/J0106). We would like to thank Jie SONG, Zhengwang ZHANG and Dongsheng GUO for their help on this work.
Bernardo CSS, Cresswell B, Lloyd H, Azeredo R, Simpson J. 2011. Selection of radio transmitter and attachment method for post-release monitoring of captive-bred reintroduced red-billed curassow Crax blumenbachii, Brazil. Eur J Wildl Res, 57(3): 689–694.
Betts MG, Hadley AS, Doran PJ. 2005. Avian mobbing response is restricted by territory boundaries: Experimental evidence from two species of forest warblers. Ethology, 111(9): 821–835.
Catchpole CK, Slater PJB. 1995. Bird Song: Biological Themes and Variations. Cambridge University Press, Cambridge.
Dale J, Lank DB, Reeve HK. 2001. Signaling individual identity versus quality: A model and case studies with ruffs, queleas, and house finches. Am Nat, 158(1): 75–86.
del Hoyo A, Elliott A, Sargatal J. 2006. Handbook of the Birds of the World Volume 11 Old World Flycatchers to Old World Warblers. Lynx Edicion, Barcelona.
Fernandez-Juricic E, del Nevo AJ, Poston R. 2009. Identification of individual and population-level variation in vocalizations of the endangered southwestern willow flycatcher (Empidonax traillii extimus). Auk, 126(1): 89–99.
Fox EJS. 2008. A new perspective on acoustic individual recognition in animals with limited call sharing or changing repertoires. Anim Behav, 75(3): 1187–1194.
Gilbert G, McGregor PK, Tyler G. 1994. Vocal individuality as a census tool: practical considerations illustrated by a study of two rare species. J Field Ornithol, 65(3): 335–348.
Grava T, Mathevon N, Place E, Balluet P. 2008. Individual acoustic monitoring of the European Eagle Owl Bubo bubo. Ibis, 150(2): 279–287.
Hartwig S. 2005. Individual acoustic identification as a non-invasive conservation tool: An approach to the conservation of the African wild dog Lycaon pictus. Bioacoustics, 15(1): 35–50.
Kemp AC, Kemp MI. 1989. The use of sonograms to estimate density and turnover of Wood Owls in riparian forest. Ostrich, 14 (Supplement): 105–110.
Laiolo P, Tella JL. 2006. Landscape bioacoustics allow detection of the effects of habitat patchiness on population structure. Ecology, 87(5): 1203–1214.
Laiolo P, Vogeli M, Serrano D, Tella JL. 2007. Testing acoustic versus physical marking: two complementary methods for individual-based monitoring of elusive species. J Avian Biol, 38(6): 672–681.
Lein MR. 2008. Song variation in Buff-breasted Flycatchers (Empidonax fulvifrons). Wilson J Ornithol, 120(2): 256–267.
Mays HL, Yao CT, Yuan HW. 2006. Antiphonal duetting in Steere's liocichla (Liocichla steerii): male song individuality and correlation between habitat and duetting behavior. Ecol Res, 21(2): 311–314.
McDonald PG, Heathcote CF, Clarke MF, Wright J, Kazem AJN. 2007. Provisioning calls of the cooperatively breeding bell miner Manorina melanophrys encode sufficient information for individual discrimination. J Avian Biol, 38(1): 113–121.
Mizutani F, Jewell PA. 1998. Home-range and movements of leopards (Panthera pardus) on a livestock ranch in Kenya. J Zool, 244(2): 269–286.
Ohara H, Yamagishi S. 1984. The first record of helping at the nest in the Short-tailed Bush Warbler Cettia squarneiceps. Tori, 33(1): 39–41.
Rogers DJ, Paton DC. 2005. Acoustic identification of individual Rufous Bristlebirds, a threatened species with complex song repertoires. Emu, 105(3): 203–210.
Saraux C, Le Bohec C, Durant JM, Viblanc VA, Gauthier-Clerc M, Beaune D, Park YH, Yoccoz NG, Stenseth NC, Le Maho Y. 2011. Reliability of flipper-banded penguins as indicators of climate change. Nature, 469(7329): 203–206.
Terry AMR, Peake TM, McGregor PK. 2005. The role of vocal individuality in conservation. Front Zool, 2(10): 1–16.
Tibbetts EA, Dale J. 2007. Individual recognition: it is good to be different. Trends Ecol Evol, 22(10): 529–537.
Wang N, Zhang YY, Zheng GM. 2008. Breeding ecology of the Narcissus Flycatcher in north China. Wilson J Ornithol, 120(1): 92–98.
Xia CW, Xiao H, Zhang YY. 2010. Individual variation in Brownish-flanked Bush Warbler songs. Condor, 112(3): 591–595.
Table
2.
Results of the discriminant function analysis for 8 individuals. 77.5% of the songs were correctly classified by the analysis. All units are given in per cent.
Table
3.
Results of artificial neural networks on training sample for 8 individuals. 85.5% of the songs were correctly classified by the analysis. All units are given in per cent.
Table
4.
Results of artificial neural networks on testing sample for 8 individuals. 72.1% of the songs were correctly classified by the analysis. All units are given in per cent.
Table
5.
Results of spectrographic cross-correlation for 8 individuals. 89.4% of the songs were correctly classified by the analysis. All units are given in per cent.

 DownLoad:


 Email Alerts
 RSS Feeds