We modeled foraging habitats of Hume's Pheasant (Syrmaticus humiae) on a macro-habitat level using ArcGIS in an attempt to provide scientific reference for management and restoration of habitats. Field work was conducted from March to April in 2006 and 2008, and from October to November in 2005 and 2008 in Dazhong Mountain, Yunnan Province, southwestern China. The selection of ecological factors was estimated by means of a resource selection index, distance analysis and the method of hierarchical habitat selection. The foraging habitat patches were modeled spatially by ArcGIS. The results show that actual and potential foraging patches overlapped considerably in spring and autumn. The number and total areas of patches in the autumn were smaller than those in the spring. The minimum and average areas of patches in the autumn were larger than those in the spring, while the maximum areas of actual and potential foraging patches in the autumn were equal to those in the spring. Similarity in the selection for survival and safety consideration in both seasons was the main strategy for landscape factors of habitats by Hume's Pheasant, while seasonal difference in selecting a landscape matrix was their secondary strategy, affecting landscape factors in the habitat. Changes of foraging patches in both seasons reflect a difference of resources requirement by the bird. Fragmentation and miniaturization of foraging patches would result in the formation of a meta-population of Hume's Pheasant.
The foraging habitat of an animal is an important place in its daily life. For birds, the food-cover relationship reflects a trade-off between acquiring food and avoiding predation (Cody, 1985). Studies of use and selection of habitats are essential for understanding the biological requirements of animals and the strategies they use to satisfy their needs (Manly et al., 2002). Selection of foraging habitat by birds can be categorized into four types, i.e., physical or geographical range for a species, the home range for an individual or social group, various habitat components within the home range and the actual sites for available food (Johnson, 1980). The first two natural categories are considered as the macro-habitat level and the other two as the micro-habitat level. Landscape factors are the main factors affecting the foraging habitat of birds at the macro-habitat level (Johnson, 2007), while at the micro-habitat level, vegetation structure affects the foraging habitat utilization in birds (MacArthur and Wilson, 1967; Cody, 1985). On maps, modeling foraging habitat at the macro-habitat level can directly reflect the foraging habitat patches available, which would be helpful to manage habitats effectively.
The distribution of Hume's Pheasant (Syrmaticus humiae) is restricted to China, India, Myanmar and Thailand. The species has been listed as "globally near-threatened" (BirdLife International, 2010). Its reproduction, feeding and habitat selection were studied in terms of food, water and human disturbance (Jiang et al., 2006; Li et al., 2006; Iamsiri and Gale, 2008). Based on these earlier studies and combining field data with ArcGIS analyses, we modeled the foraging habitat patches of Hume's Pheasant in Dazhong Mountain, Yunnan Province, China, which can have important implications for future management of Hume's Pheasant in dealing with its core habitat and establishing foraging corridors.
Methods
Study area
Dazhong Mountain (24°43′32″–25°01′10″N, 100°44′28″–100°57′42″E) is located in the southwestern part of Nanhua County, Chuxiong Prefecture in central Yunnan, China. This area lies at the confluence of the central Yunnan Plateau, Hengduan mountains and the southern tip of the Qinghai-Tibetan Plateau. The study area consists of mid-alpine mountains and valleys caused by age-old movements in the Earth's crust. These upward movements of the Earth resulted in modified soils and climate regimes which in turn have affected the vegetation and species diversity and distribution. Pinusyunnanensis and scrub forests dominate in areas below 1500 m elevation, semi-moist evergreen broad-leaved forests and deciduous broad-leaved forests are found at elevations between 1500–2400 m, while the vegetation above 2400 m comprises mid-alpine evergreen broad-leaved and Pinusarmandii forests. A total of 356 bird species were recorded in the area, including nine species of Galliformes, such as Syrmaticus humiae, Povo muticus and Lophura nycthemera (Wang, 2000).
Basic map digitalization
A topographic map (1:50000) was matched with remote sensing images. Some factors such as terrain, rivers, small roads and residential areas, which are of obvious biological importance for Hume's Pheasant (Liu et al., 1999), were digitalized. The vector coverage for these factors was formed and transformed to the grid-layer on a GRID background.
Remote sensing images of vegetation types in the study area originated from the 2003 thematic mapper (TM) data. According to Wu and Zhu (1987), the vegetation was divided into ten types: mountaintop mossy coppice, semi-humid evergreen broad-leaved forests, mid-mountain moist evergreen broad-leaved forests, deciduous broad-leaved forests, Pinusarmandii forests, P. yunnanensis forests, shrub-grassland with sparse trees, Albizzia julibrissin-Rhododendron forests, economic forests and farmland. The remote sensing images were superimposed on the topographic map to form a base map of Hume's Pheasant habitat. A confusion matrix was constructed using GPS point-site data, by which the general interpretation precision to the vegetation was 83.5%.
Observation of foraging habitat
Microscopic analysis of feces indicated that the available food sources for Hume's Pheasant in the spring include Fagaceae and Theaceae plants and ferns (Li et al., 2009), which are abundant in the study area (Wang, 2000).
Ecological factors were collected from March to April in 2006 and 2008 and from October to November in 2005 and 2008. Our earlier studies found that Hume's Pheasants are found at 2200–2500 m elevations and were actively foraging between 08:00–11:00 and 17:00–19:00 hours (Li et al., 2006). We set four 5 m wide and 4–6 km long transects at this elevation in our study area, frequented by pheasants. Two investigators walked along the lines during 08:00–11:00 and 17:00–19:00 hours and sought foraging traces of this pheasant, which consist of long, narrow pits, approximately 4–6 cm deep (Li et al., 2006). Once a foraging trace was located, it was marked as the center of a 20 m × 20 m plot, established for investigating ecological factors within it. Factors could be categorized into two types: 1) habitat factors which include slope, aspect, vegetation type and distance from plot center to water and 2) disturbance factors which comprise the distance from plot center to residential areas and small roads (small roads are often used by village farmers for grazing their cattle).
Assessment of foraging habitat
Resource selection function
Resource selection functions are standard methods for analyzing habitat factors (Ivlev, 1961), which we used in our assessment. The value of each ecological factor changed in each range and could be divided into two equal parts, where the utilization and availability of factors at either level for this bird were estimated (Garshelis, 2000).
Resource utilization (Ri) refers to the frequency of actual utilization by animals (birds in this case) using resource i in a period.
where Ui represents the utilization times of resource i, and U the total amount of resource i.
Resource availability (Ni) refers to the availability of animals using resource i.
where Si is the available area of resource i and S the total area of this type of resource.
A resource selection function (E) is an index, used for comparing resource utilization with resource availability, in order to identify the resources selected by the bird (Manly et al., 2002).
If Ei = 0, the birds do not select resource i and given the value "0"; Ei < 0 implies that birds avoid resource i, expressed as "–" and Ei > 0 means that the birds prefer resource i, expressed as "+" (Ivlev, 1961).
Analysis of disturbance factors
Distance analysis was used to evaluate human disturbance of the pheasant, following the method of Hebblewhite and Merrill (2008). Human activities, such as grazing cattle, harvesting medicinal herbs and non-timber products, disturb wildlife and their habitats (Liu et al., 1999). For human activities, birds often keep a minimum warning distance. Birds will escape and/or hide when people are close. Within this minimum warning distance, few activities of birds are found (Geist et al., 2005). We took small roads and residential areas as disturbance centers in our study. Disturbance factors were evaluated using the following procedures. First, a minimum distance from the disturbance center to traces of bird activity was measured on the map and the distance divided into two equal ranks. Second, the level of anthropogenic activity was estimated according to the number of traces of bird activities: disturbance was regarded as "intense" if no traces of bird activity could be found, "moderate" with 1–5 traces, "weak" with 6–10 traces and "none" when the number of traces was larger than 10. Third, the disturbance distance for the level referred to as "none" was considered the minimum warning distance for the bird and a map of the disturbance range was drawn using the point of a road or residential area as its center and the minimum warning distance as its radius.
Assessment of foraging habitat
Methods of hierarchical habitat selection are excellent means for estimating the requirements of animals at different habitat levels (Johnson, 1980). We used the following procedures. First, we estimated the requirements for habitat by the pheasant, given the combined results of a resource selection function and an analysis of the disturbance factors. Second, a multi-scale foraging habitat classification was established according to the habitat requirements of Hume's Pheasant, both at a macro-habitat and a micro-habitat level.
Modeling of foraging habitat
An ecological niche is a multiple resource space required by animals. If in this space, one resource cannot satisfy the basic requirement of animals, i.e., if the fitness of this resource is zero, then the fitness of the entire ecological niche would be zero. By overlapping several single-resource image layers in ArcGIS, a comprehensive, superimposed layer is generated to reflect the multiple requirements for resources by animals (Liu et al., 1999). In our case, modeling foraging habitats were established as follows.
1) Modeling of habitat factors. First, the fitness characteristics of individual habitat factors were analyzed. Then the fitness characteristics for all habitat factors were analyzed according to the characteristics of each factor, used to model the potential foraging habitat of Hume's Pheasant. In modeling, the threshold of a minimum habitat area is an important index for estimating the smallest amount in terms of requirement for resources in different seasons. There have been no such reports of S. humiae so far in China. Therefore, the spring data of S. ellioti from Zhejiang Province, China (Cai et al., 2007) and the autumn data of S. humiae from Doi Chinang Dao, northern Thailand (Iamsiri and Gale, 2008) were taken as reference for determination of a threshold value. S. ellioti is a congeneric close relative of S. humiae with similar morphology and behavior. Garshelis (2000) once used the data of closely related species as reference for his own study in a habitat model.
2) Modeling of disturbance factors. The range of disturbance was estimated according to characteristics of each disturbance factor, such as small roads and residential areas and a map of these factors was drawn.
3) Modeling of foraging habitat. Habitat and disturbance factors were evaluated. A map of the actual foraging habitat of this pheasant was modeled by overlapping layers.
Our data were analyzed by ArcView 3.3 and ArcGIS 9.2.
Results
During the collection of spring data, from March to April in 2006 and 2008, a total of 76 foraging traces of Hume's Pheasant were identified, while in the autumn data collection, from October to November in 2005 and 2008, we identified 52 traces.
Analysis of the resource selection function showed that selectivity for habitat factors by this bird was consistent during the spring and autumn, but only deciduous broad-leaved forests were used randomly in the spring (Table 1). Analysis of disturbance factors showed that effects of anthropogenic activities were consistent during spring and autumn (Table 2).
Table
1.
Resource selection function of foraging habitat factors of Hume's Pheasant in spring and autumn
Factor
i
Ri
Ni
Ei
Selective
Spring
Autumn
Spring
Autumn
Spring
Autumn
Spring
Autumn
Spring
Autumn
AS
East
East
0.57
0.67
0.28
0.28
0.34
0.31
+
+
South
South
0.03
0
0.24
0.24
−0.78
−1.00
−
−
West
West
0.07
0.01
0.24
0.24
−0.71
−0.92
−
−
North
North
0.33
0.32
0.24
0.24
0.13
0.12
+
+
SL (°)
0–25
0–25
0.38
0.12
0.53
0.53
−0.16
−0.63
−
−
25–50
25–50
0.62
0.88
0.47
0.47
0.14
0.30
+
+
VT
MEBF
MEBF
0.87
1.00
0.49
0.49
0.28
0.34
+
+
DBF
DBF
0.05
0
0.05
0.05
0
−1.00
0
−
YPF
YPF
0.08
0
0.46
0.46
−0.70
−1.00
−
−
DSW (m)
0–200
0–200
0.55
0.70
0.52
0.52
0.03
0.15
+
+
200–400
200–400
0.45
0.30
0.48
0.48
−0.03
−0.23
−
−
AS: aspect; DBF: deciduous broad–leaved forest; DSW: distance to water; MEBF: middle mountain moist evergreen broad-leaved forest; SL: slope; VT: vegetation type; YPF: Yunnan pine (Pinus yunnanensis) forest; +: observed usage significantly higher than expected; −: observed usage significantly lower than expected; 0: observed usage in proportion to its availability.
Distance to water: 0–200 m; disturbance radius from small roads: 10–100 m; disturbance radius from residential areas: 500 m
Minimum patch area: < 4.90 ha (minimum habitat area requirement for Syrmaticus in autumn) (Iamsiri and Gale, 2008)
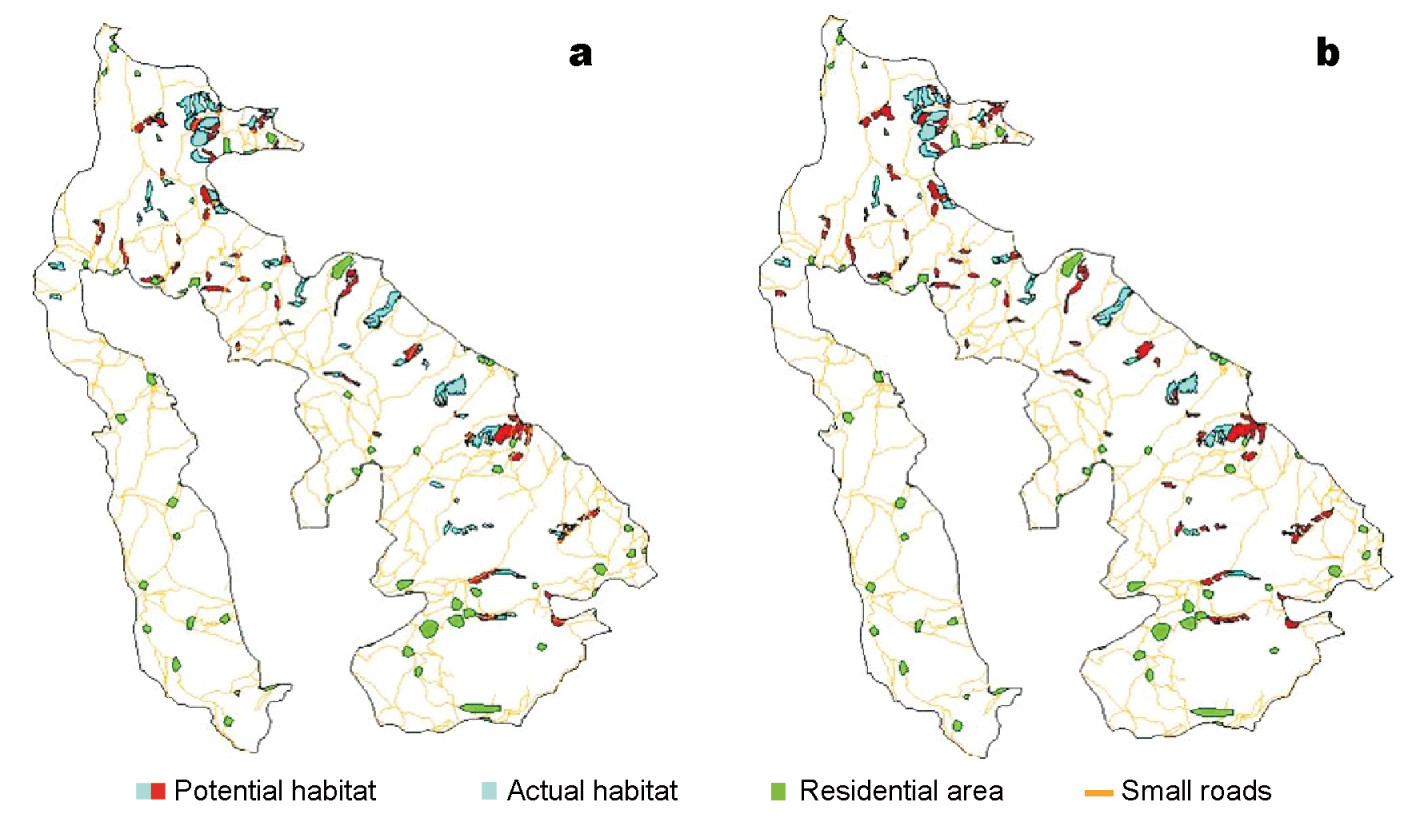
Comparing the habitat characteristics with the multi-scale foraging habitat system of our pheasant, patches of potential and actual foraging habitats in the autumn overlapped with those in the spring. The number of patches and areas of actual autumn habitat were smaller than those in the spring. The minimum number and mean area of patches in the autumn were larger than those in the spring. Only the maximum areas of potential and actual habitats in the autumn were similar with those in the spring. If smaller than 4.90 ha, the patch would not be repeatedly used by this bird in the autumn. There were a number of more or less isolated patches of potential and actual habitats (Table 3; Figs. 1 and 2).
Table
3.
Comparison between potential and actual foraging habitats of Hume's Pheasant in spring and autumn
Figure
1.
Potential and actual foraging habitat patches of Hume's Pheasant in spring and autumn at Dazhong Mountain, Yunnan. (a) Foraging habitat patches in spring; (b) Foraging habitat patches in autumn.
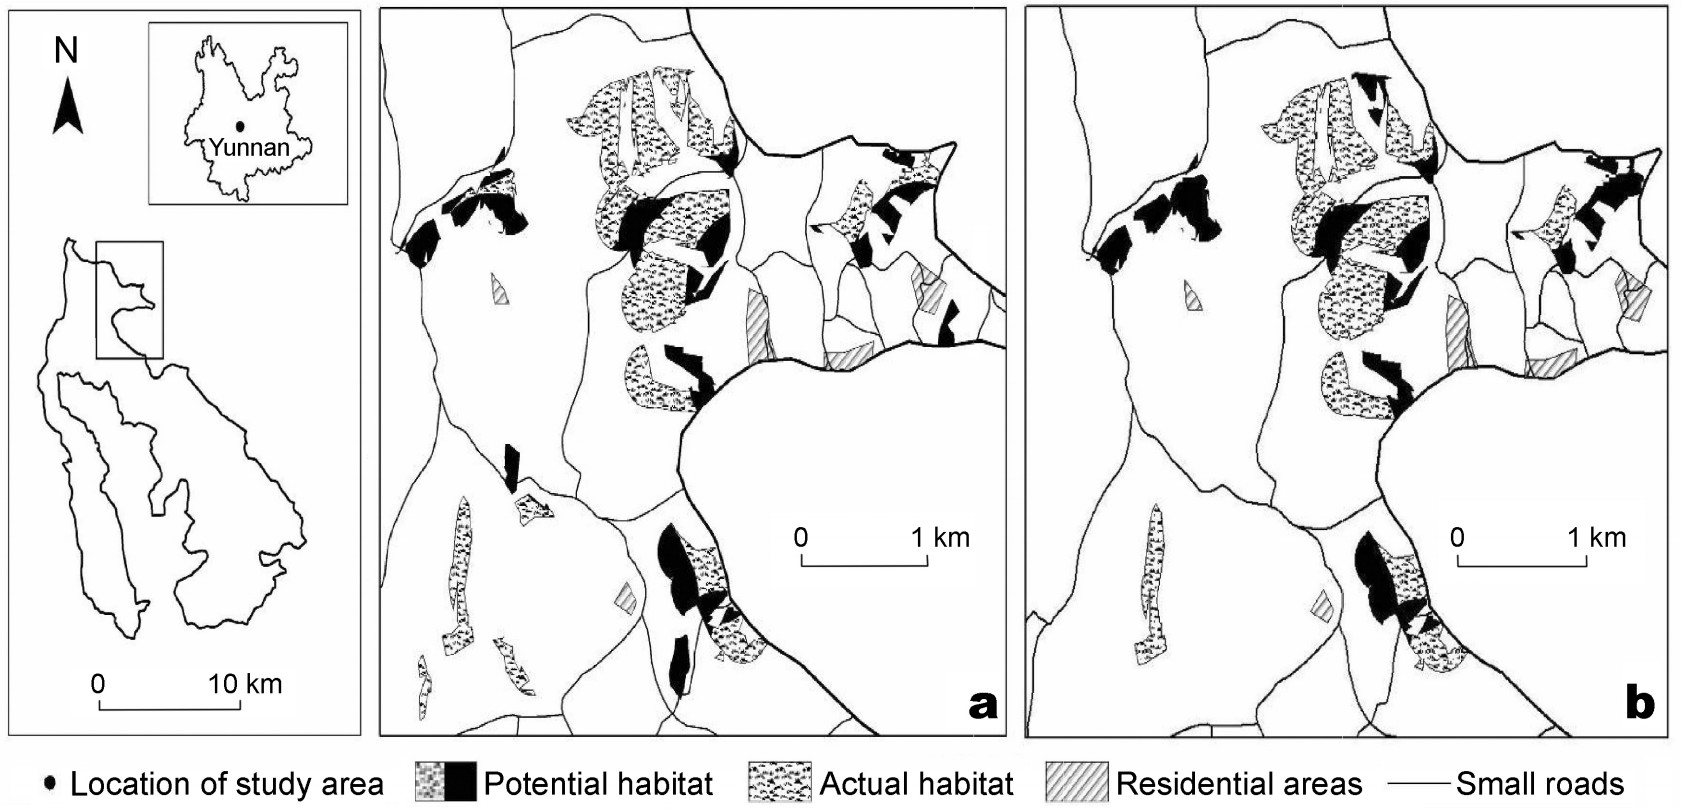
Figure
2.
Part of potential and actual foraging habitat of Hume's Pheasant in spring and autumn at Dazhong Mountain, Yunnan. (a) Foraging habitat in spring; (b) Foraging habitat in autumn.
The similarity for survival and safety requirements in both seasons was the main selection strategy for landscape habitat factors of Hume's Pheasant. Habitat and disturbance factors in the landscape made up its survival and safety conditions. There were no clear differences in selection of habitat and disturbance factors between spring and autumn (Table 3), so that patches of potential and actual spring habitats overlapped considerably with those in the autumn (Figs. 1 and 2). It may be an effective strategy for use of space by this bird. When it selected similar foraging patches among seasons, the bird would not spend much time learning new environmental patches and could therefore spend more time breeding and feeding (Cody, 1985). Hence, the use of overlapping foraging patches by the pheasant in different seasons is an effective strategy for the use of space.
The selection of a different landscape matrix among seasons is a secondary strategy affecting the choice of habitat landscape factors by this bird. Vegetation can often be divided into suitable vegetation and a landscape matrix used by birds (Carroll and Fox, 2008). Suitable vegetation is a reflection of the nutritional and safety conditions provided by the environment (Cody, 1985). In the spring, this pheasant randomly used deciduous broad-leaved forests but not during the autumn (Table 2). It may be that this type of forest provides the pheasant with a corridor to move among several patches for mating. Food was also one of the main factors that limited dispersion of Syrmaticus according to Liu and Zhang (2008). Deciduous broad-leaved forests can provide a sufficient supply of food when the bird disperses. Therefore, deciduous broad-leaved forests can be used at will. In the autumn, individual pheasants form groups and accumulate energy for wintering, where the abundance of food resources becomes a precondition for energy accumulation to live safely through the winter. Therefore, this bird prefers to use patches where resources are more abundant and the area larger, rather than the earlier dispersion corridors. So the difference in landscape matrix selection during the seasons can be considered an intermittent strategic use of a habitat corridor in both seasons. Of course, other possibilities cannot readily be ruled out, since there has been a severe habitat fragmentation in the study area. The repeated use of a foraging habitat by this pheasant in both seasons has presumably become an adaptive form of behavior, a forced behavior of selecting and utilizing foraging habitats (Watson et al., 2005), which needs attention in future research.
Fragmentation of foraging patches and meta-population
Fragmentation and small areas of foraging patches were the main reasons leading to the reduction of carrying capacity of Hume's Pheasant in Dazhong Mountain. According to a theory of island biogeography, a large habitat area can provide large amounts of resources and support a great number of species. The amount of resources often determines the size of a bird population (MacArthur and Wilson, 1967). Given human disturbances, the total number and area as well as the mean area of actual foraging habitats could be greatly reduced and would be less than those of potential foraging habitats (Table 3). Using the total area of habitats to divide the requirement of the minimum habitat area, we can obtain an ideal population size of 47.9–245.2 in space. The spatial carrying capacity of Hume's Pheasant is rather low. Therefore, most potential habitats are not suitable for their presence, considering human disturbances.
Fragmentation and small areas of foraging patches would result in the formation of meta-populations of Hume's Pheasants (Fig. 2) and likely result in an increase in the rate of extinction of this bird in this area. This probability has two causes. On the one hand, the actual foraging patches are more or less isolated, without any individual exchanges of birds among patches when the extent of isolation was beyond the capacity of the pheasant to disperse; as a result, its population would decline due to inbreeding, in the end giving rise to a meta-population. On the other hand, fragmentation and small areas of foraging patches directly cause a decline in the spatial carrying capacity at Dazhong Mountain for the pheasant and again, a meta-population would be formed. A study of the rate of extinction of species in fragmented forests in an area of the Amazon Basin also showed that over the long term, the reduction of the number and areas of habitat patches would lead to meta-populations, which obviously causes an increase in the rate of extinction of species in the area (Ferraz et al., 2003). Therefore, in the future, attention should be paid to the effect of fragmentation and small areas of foraging patches for Hume's Pheasant in Dazhong Mountain.
Acknowledgements
We express our thanks to Mr. Paul Butler, Senior Vice President of the Global Programs of RARE, an inspiring conservationist and to Prof. Zhengwang Zhang from Beijing Normal University, who reviewed our manuscript and provided some constructive suggestions. The field work was financed by the Wildlife Conservation Program in 2009, administered by the State Forestry Administration of China and, as well, supported as a key subject by the Wildlife Conservation and Utilization Program in Yunnan Province (No. XKZ200904).
Cai LY, Xu YP, Jiang PP, Ding P, Yao XH, Xu XY, Wang GB. 2007. Home range and daily moving distance of Elliot's pheasant. J Zhejiang Univ (Sci Edit), 34(6): 679–683. (in Chinese with English abstract)
Carroll SP, Fox CW. 2008. Conservation Biology: Evolution in Action. Oxford University Press, New York.
Cody ML. 1985. Habitats Selection in Birds. Academic Press, London.
Ferraz G, Russell GJ, Stouffer PC, Blerregaard RO, Plmm SL, Lovejoy TE. 2003. Rates of species loss from Amazonian forest fragments. Proceed Natl Acad Sci, 100(24): 14069–14073.
Garshelis DL. 2000. Delusions in habitat evaluation: measuring use, selection, and importance. In: Boitani L, Fuller TK (eds) Research Techniques in Animal Ecology: Controversies and Consequences. Columbia University Press, New York, pp 111–164.
Geist C, Liao J, Libby S, Blumstein DT. 2005. Does intruder group size and orientation affect flight initiation distance in birds? Animal Biodiv Conserv, 28(1): 69–73.
Hebblewhite M, Merrill E. 2008. Modeling wildlife-human relationships for social species with mixed-effects resource selection models. J Appl Ecol, 45(3): 834–844.
Iamsiri A, Gale GA. 2008. Breeding season habitat use by Hume's pheasant Syramticus humiae in the DoiChinang Dao wildlife sanctuary, northern Thailand. Zool Stud, 47(2): 138–145.
Ivlev VS. 1961. Experimental Ecology of the Feeding of Fishes. Yale University Press, New Haven.
Jiang AW, Zhou F, Lu Z, Han XJ, Sun RJ, Li XL. 2006. Roost-site Selection of Mrs Hume's Pheasant (Syrmaticus humiae) in Guangxi, China. Zool Res, 27(3): 249–254. (in Chinese with English abstract)
Johnson DH. 1980. The comparison of usage and availability measurements for evaluations of resource preference. Ecology, 61: 65–71.
Johnson DM. 2007. Measuring habitat quality: a review. Condor, 109: 489–504.
Li N, Zhou W, Yang YY, Zhang Q, Liu Z. 2009. Microcopic analysis on winter plant food of Syrmaticus humiae (Hume's pheasant) in Dazhongshan, Yunnan. J Zhejiang Forest Coll, 26(3): 363–367. (in Chinese with English abstract)
Li W, Zhou W, Zhang XY, Cao M, Zhang RG. 2006. Spring foraging sites of three pheasants at Nanhua Part in Ailaoshan National Nature Reserve. Zool Res, 27(5): 495–504. (in Chinese with English abstract)
Liu JG, Ouyang ZY, Taylor WW, Groop R, Tan YC, Zhang HM. 1999. A framework for evaluating the effects of human factors on wildlife habitat: the case of Giant Pandas. Conserv Biol, 13: 1360–1370.
Liu Y, Zhang ZW. 2008. Research progress in avian dispersal behavior. Acta Ecol Sin, 28(4): 1354–1365.
MacArthur RH, Wilson EO. 1967. The Theory of Island Biogeography. Princeton University Press, Princeton.
Manly BFJ, McDonald LL, Tomas DL, McDonald TL, Erickson WP. 2002. Resource Selection by Animals: Statistical Design and Analysis for Field Studies. Kluwer Academic Press, London.
Wang YK. 2000. Integrated Investigation Report on Dazhongshan Provincial Natural Reserve, Nanhua County. Nanhua Forest Bureau, Nanhua. (in Chinese)
Watson JEM, Whittaker RJ, Freudenberger D. 2005. Bird community responses to habitat fragmentation: how consistent are they across landscape? J Biogeogr, 32: 1353–1370.

 DownLoad:


 Email Alerts
 RSS Feeds