Changli Bu, Wendong Xie, Zihe Ma, Yifei Wang, Yun Fang, Kai Song, Yue-Hua Sun. 2025: Impacts of China’s natural forest protection project on habitat distribution of key protected birds in the Qinghai-Tibet Plateau. Avian Research, 16(1): 100244. DOI: 10.1016/j.avrs.2025.100244
Citation:
Changli Bu, Wendong Xie, Zihe Ma, Yifei Wang, Yun Fang, Kai Song, Yue-Hua Sun. 2025: Impacts of China’s natural forest protection project on habitat distribution of key protected birds in the Qinghai-Tibet Plateau. Avian Research, 16(1): 100244. DOI: 10.1016/j.avrs.2025.100244
Changli Bu, Wendong Xie, Zihe Ma, Yifei Wang, Yun Fang, Kai Song, Yue-Hua Sun. 2025: Impacts of China’s natural forest protection project on habitat distribution of key protected birds in the Qinghai-Tibet Plateau. Avian Research, 16(1): 100244. DOI: 10.1016/j.avrs.2025.100244
Citation:
Changli Bu, Wendong Xie, Zihe Ma, Yifei Wang, Yun Fang, Kai Song, Yue-Hua Sun. 2025: Impacts of China’s natural forest protection project on habitat distribution of key protected birds in the Qinghai-Tibet Plateau. Avian Research, 16(1): 100244. DOI: 10.1016/j.avrs.2025.100244
The Natural Forest Protection Project (NFPP), initiated by the Chinese government in 2000, is a crucial ecological construction project that has played a significant role in forest restoration in China. Forests in the Qinghai-Tibet Plateau (QTP) serve as important habitats for many rare and endemic birds. Understanding the conservation efficiency of NFPP implementation on these birds holds significant practical significance. In this study, we utilized land use change matrices to analyze the forest changes in the QTP before and after NFPP implementation, predicted the potential spatial distribution of 16 nationally protected birds using Species Distribution Models (SDMs), and compared the impacts of this project on bird habitats under different carbon emission scenarios. Mann-Whitney U tests were employed to analyze the adaptation of different birds to forest changes during NFPP implementation. Our results showed that NFPP protected 172,398 km2 of primary forests and added 6379 km2 of secondary forests in our study area. The potential spatial distribution and sympatric species richness of the 16 protected birds slightly increased after NFPP implementation under different climate change scenarios, and NFPP implementation contributed to improving the potential spatial distribution of birds. Compared to newly established secondary forests, protected primary forests exhibited enhanced conservation for forest birds (Z-value > 0 for six bird species, P < 0.1), while being less suitable for non-forest birds (significantly unsuitable for three non-forest bird species, Z-value < 0, P < 0.05; non-significantly unsuitable for four non-forest bird species, Z-value < 0, P > 0.1). This indicates that the protection of primary forests during NFPP implementation benefits forest bird conservation while the addition of secondary forests is beneficial to non-forest birds. To enhance the role of NFPP in avian conservation in the QTP, it is suggested to increase the landscape heterogeneity of forest, particularly in newly established secondary forests.
Global biodiversity conservation faces great challenges under the influence of human activities and climate change (Brooks et al., 2006; Heller and Zavaleta, 2009). To address biodiversity conservation effectively, it is imperative to implement ecological construction projects in areas characterized by rich biodiversity and severe biodiversity loss. Some countries have carried out a series of ecological construction projects to achieve the goal of for biodiversity and sustainability, such as the Sustainable Forest Management Program in Canada, the National Forest Protection Program in the United States (Hickey and Innes, 2008), and the Return of Farmland to Forest Program in China (Li et al., 2020). These programs have played a positive role in biodiversity conservation at broad scales (Hua et al., 2016). The catastrophic flood of 1998 prompted the Chinese government to recognize the importance of protecting natural forests. To maintain ecological balance between humanity and nature, and to promote the country’s sustainable development, the Chinese government implemented the Natural Forest Protection Project (hereafter NFPP), a significant ecological construction initiative since then (Ren et al., 2015). This project had enabled China’s forests to experience a substantial rate of gain by 2022 (Bryan et al., 2018).
The Qinghai-Tibet Plateau (hereafter QTP), also known as the ’Third Pole of the World’, is a giant geographic unit covering approximately 250 × 104 km2 with an average elevation exceeding 4000 m (Lei et al., 2014). Due to its vast expanse, varied topography and distinct faunal history (e.g., Quaternary climatic oscillations), the QTP is characterized by abundant biodiversity and plays a key role in maintaining the ecological security of Asia (Wen et al., 2016; Feijó et al., 2022). The QTP sustains a highly distinct biome where species have adopted to extremely cold, dry and anoxic environment, and most of them are endemic to the region, such as the rare and endangered Chinese Grouse (Tetrastes sewerzowi), Tibetan Snowcock (Tetraogallus tibetanus) (Lou et al., 2015; He et al., 2022). These species are distributed in different ecosystems of the QTP, including alpine meadows, montane forests, and wetlands, forming the unique biodiversity pattern of the region. In addition, because these species are specialized to the plateau environment, the global climate warming has profound ecological impacts on them (e.g., behavioral thermoregulation, redistributions) (Ye et al., 2024), resulting in local population decline and even extirpation (Pinsky et al., 2022). The QTP possesses abundant forest resources. However, extensive deforestation occurred in the region due to national development needs before 1998, with annual logging reaching a peak of 150.5 × 10⁴ m3. This posed a significant threat to soil and water conservation as well as wildlife in the area, particularly forest-dwelling species.
Quantifying land use changes in the QTP under NFPP directly reflects shifts in forest, grassland, and other land cover types over time (Liu et al., 2021; Gao et al., 2023). This is crucial for assessing habitat quality changes for wildlife at broad spatial scales and evaluating NFPP’s conservation benefits for regional biodiversity. Given the QTP’s ecological importance and unique fauna, understanding whether NFPP has improved habitats, especially for flagship species, is essential (He et al., 2009). Such insights can guide policy improvements, such as strengthening forest protection in overlooked regions. Since NFPP’s implementation, the QTP’s natural forest carbon stock has increased by 0.273 billion tons per year, and the total consumption of forest resources decreased from the previous 150.5 × 10⁴ m3 to the current 69.4 × 10⁴ m3. After the implementation of NFPP, the primary forests area in the implementation area of the QTP is 172,398 km2, and the new forest area has reached 6379 km2 (see Appendix Fig. S1). NFPP has effectively promoted ecosystem restoration at multiple levels, benefiting numerous wildlife species (Ren et al., 2015).
Global biodiversity loss resulted from anthropogenic climate change, land use change and deforestation are accelerating (Cowie et al., 2022). The conservation of forest resources can ensure that birds have adequate food sources, habitats, and breeding environments. Effective forest protection measures contribute to the stability and suitability of avian habitats. The MaxEnt model is capable of predicting species’ historical distribution areas and potential suitable habitats, widely applied in the modeling of avian habitats, which can effectively assess the impact of forest conservation measures on bird’s post-implementation (Tian et al., 2024). With the continuous advancement of NFPP, does this policy effectively protect the avifauna of the QTP? To address this question, we selected 16 representative nationally protected bird species and employed species distribution models to calculate their potential spatial distribution.
Our aims are twofold. Firstly, by contrasting changes in potential spatial distribution and sympatric species richness before and after NFPP implementation, as well as under different carbon emission scenarios, we quantitatively analyzed NFPP’s impact on bird habitats. Secondly, to understand whether the protection of primary forests and the establishment of secondary forests under NFPP are beneficial for avifauna conservation, we assessed the adaptability of these 16 bird species to forest changes.
2.
Materials and methods
2.1
Study area
According to the implementation plan of NFPP in the Upper Yangtze River and the Middle Yellow River Regions issued by the National Forestry and Grassland Administration of China, the project implementation areas were delineated. Combining with the boundary of the QTP, a total of 111 county-level administrative regions were selected using a masking extraction method, belonging to provinces of Sichuan, Yunnan, Tibet, Gansu, and Qinghai (see Fig. 1B). The implementation scope of NFPP on the QTP ranges from the northern foot of the Qilian Mountains to the southern end of the Hengduan Mountains, extending from the eastern boundary of the QTP to the Three Rivers Source National Park in the west. It spans approximately 1800 km east to west and 1500 km north to south, covering an area of approximately 993,000 km2.
Figure
1.
Changes of species richness in potential spatial distribution before and after NFPP implementation (A); Location of NFPP implementation area on QTP (B); The boundary monument of NFPP implementation area (C); Primary forest in NFPP implementation area (D); Secondary forest in NFPP implementation area (E); Mixed regions in NFPP implementation area (F).
The terrain within the implementation area of NFPP exhibits significant topographical variations, resulting in an interlaced distribution of mountainous areas, plateaus, plains, river valleys, meadows, and lakes. Numerous extensive elevational gradients are present throughout the region. The climatic characteristics are notably influenced by the plateau topography, showing typical plateau climate features including large temperature variations, uneven distribution of precipitation, and abundant sunshine. The vegetation types include high mountain coniferous forests, alpine meadows, subalpine meadows, grasslands, dwarf forests, and alpine deserts. Within this vast range, numerous unique plant and animal species can be found, including endemic animals and rare bird species.
2.2
Data sources
2.2.1
The avian distribution data
We retrieved the distribution data of nationally protected animals within the implementation scope of NFPP from the GBIF database (https://www.gbif.org/). To ensure the reliability of local ecosystem change assessments and model predictions, we conducted data screening on avian species that meet following criteria: (1) Nationally key protected wild animals (the species listed in the List of Key Protected Wild Animals in China) are key species or indicator species in the ecosystem. Their survival status, population changes, etc. can sensitively reflect the health of the ecosystem and environmental changes. In the ecosystem, nationally key protected wild animals often occupy crucial positions in the food chain and play an irreplaceable role in maintaining ecological balance. (2) Threatened species and species with substantial populations: Threatened species (based on the China’s national protected animal list 2021) are typically sensitive to environmental changes and ecosystem disturbances. Their population changes often reflect prominent issues faced by local ecosystems. Avian species with substantial local populations play significant roles in pest control, seed dispersal, and ecological balance regulation. (3) Species with sufficient and accurate data: avian species within the implementation scope of NFPP and have over 80 data records in the GBIF database.
After screening, a total of 16 nationally protected bird species met the analysis requirements. Among them, there are five species classified as national first-level protected animals and 11 species classified as national second-level protected animal. According to Zhao (2001), these 16 bird species are further categorized into typical forest birds and non-forest birds. The specific list of bird species and their distribution data quantities are provided in Table 1.
Table
1.
National key protected bird lists for analysis.
The land cover data used in this study were obtained from the annual 30-m land cover data for China spanning from 1990 to 2022 (Yang and Huang, 2022). This dataset, based on 335,709 scenes of Landsat data on Google Earth Engine, achieves an overall accuracy of 80% according to the China Land Cover Database (CLCD). Elevation, slope, and aspect data were downloaded from the official website of the United States Geological Survey (USGS). Climate factor data were obtained from the WorldClim v2.1 website. NDVI data were sourced from the Resource and Environmental Science Data Center of the Institute of Geographic Sciences and Natural Resources Research, Chinese Academy of Sciences. The spatial resolution of all environmental factor data is 1 km2 after resampling.
2.3
Species distribution model (SDM) construction and testing
We utilized a maximum entropy approach SDM (MaxEnt version 3.4.4) to perform the modeling process. With one single algorithm used, MaxEnt SDM has been proved capable of accurately predicting where the species is distributed and when projected into a future scenario (Phillips et al., 2006). The MaxEnt model estimates the probability distribution of species occurrence by maximizing the entropy of the distribution, subject to constraints derived from the environmental variables at presence locations. This approach is particularly effective for handling presence-only data and complex environmental interactions.
We used 10-fold cross validate method, auto feature function, and ASCII output format, with a maximum of 5000 iterations to establish models, analyzing the potential spatial distribution for these 16 nationally protected bird species in the QTP. The auto feature function automatically selects the most appropriate feature types (e.g., linear, quadratic, product, threshold, and hinge) based on the input data, ensuring optimal model performance. And other settings were set as default.
We utilized Jackknife analysis to specifically assess the contribution of each environmental variable during the model construction process. The Jackknife analysis evaluates the importance of each variable by comparing model performance when the variable is excluded versus when it is used in isolation. This helps identify the most influential environmental factors shaping species distributions.
Model performance was validated using Cohen’s kappa statistic (McHugh, 2012), the area under the curve (AUC). The results indicated overall satisfactory performance. AUC ranges from 0 to 1, where AUC closer to 1 means better model performance. A model performed excellent when AUC > 0.8, and performed well when AUC > 0.75. We only used well performed model result for further analysis.
To facilitate better analysis and differentiation, we constructed a null model "pre-protection" (species distribution data + 2000 climate data + 2000 NDVI data), an NFPP implementation model "post-protection" (species distribution data + 2000 climate data + 2020 NDVI data), four protection expectation prediction models based on the null model "Pre-SSP1,2,3,5". Shared Socioeconomic Pathways (SSPs) is the Intergovernmental Panel on Climate Change (IPCC), which is a scenario framework designed to study climate change and describe possible future socio-economic development paths. In this study, four paths, namely SSP1 (RCP2.6, the sustainable and "green" pathway), SSP2 (RCP4.5, the medium pathway), SSP3 (RCP7.0, regional rivalry) and SSP5 (RCP8.5, fossil-fueled development), were selected to represent different greenhouse gas emission scenarios. Four carbon emission scenarios were based on the CMCC-ESM2 climate model (Euro-Mediterranean Centre on Climate Change Earth System Model, with increasing numbers corresponding to increased carbon emissions), and four control variable non-protected models "Post-SSP1,2,3,5" (representing only the impact of climate change on species, with increasing numbers corresponding to increased carbon emissions; the paths represented in turn are sustainability, middle of the road, regional rivalry, and fossil-fueled development). Through the construction of these models, we can analyze the actual range of species distribution before and after the implementation of NFPP and compare it with the model’s predicted range. This approach allows for a relatively objective assessment of the benefits of NFPP implementation for nationally protected bird species.
We selected the maximum training sensitivity plus specificity (MaxTSS) threshold to convert the distribution of these 16 nationally protected bird species into binary data, representing "presence" and "absence" areas. We analyzed the distribution area of each species, overlaid the analysis of hotspot areas of diversity, compared different scenario models, and analyzed the protective benefits of NFPP under climate change.
Using the SPSS 26.0 software, we conducted collinearity tests on 19 environmental factors and identified 10 factors with low collinearity: aspect, slope, NDVI, elevation, mean diurnal range, isothermality, minimum temperature of coldest month, precipitation of wettest month, precipitation seasonality, and precipitation of coldest quarter. The contribution factors of models A and B were computed (see Appendix Fig. S2).
During the statistical analysis of hotspot areas of diversity, if a grid cell represents the potential spatial distribution for one bird species, its species richness is considered as "1", and so on up to "16" for areas suitable for all 16 bird species. When studying species diversity in sympatric species, since we selected 16 nationally protected bird species, when the sympatric species are less than or equal to one-third of the total (5 species), it is considered low diversity; otherwise, it is considered high diversity. Figure 1A is generated based on area statistics. To calculate changes in species richness, we subtracted the species richness after NFPP implementation from that before implementation using ArcGIS software. Negative values indicate a decrease in species richness, while positive values indicate an increase in richness.
2.4
Random sampling of potential spatial distribution values
Using the land use change matrix, spatial changes in land use within the implementation area can be visually depicted. The spatial statistical analysis module of ArcGIS10.7 was utilized to compute the results (see Appendix Table S1).
Two key initiatives of NFPP implementation include the conservation of existing primary forests and afforestation. Based on forest dynamics, we defined four land types: primary forests before NFPP implementation (i.e., unprotected primary forests F2000), primary forests unchanged during 2000–2020 (i.e., protected primary forests F2020), newly established secondary forests during 2000–2020 (N2020), and plots with newly established secondary forests in 2000 (N2000). Utilizing the random point sampling function in ArcGIS 10.7, a sum of 500 points were randomly sampled in each land type area, and then the "extract values to points" function was employed to extract the potential niche values of 16 bird species for these points, resulting in attribute values for 32,000 points in total.
2.5
Mann‒Whitney U tests
The Mann‒Whitney U test, a non-parametric statistical method, was employed to compare the differences between two independent groups when the data did not meet the assumptions of normality or homogeneity of variance (e.g., habitat suitability values between forest birds and non-forest birds). This test ranks all data points from both groups and calculates a U statistic to determine whether the distributions of the two groups are significantly different (Ruxton, 2006). A P-value < 0.05 was considered statistically significant. The analysis was performed using R.
3.
Results
3.1
Changes in potential distribution areas and diversity before and after NFPP implementation
We successfully modeled the potential distribution of the 16 protected birds using MaxEnt model. All model performed well with AUC > 0.8, except for the Tibetan Snowcock for which the model’s AUC is 0.77 (see Appendix Table S2). All models were therefore used for further data explanation.
Using the Max TSS threshold, we reclassified the logistic model output into binary map for species potential distribution range calculation before and after NFPP (see Appendix Table S2). It was shown that after the implementation of NFPP (see Appendix Table S3 and Fig. S3), the potential spatial distribution for nine nationally protected bird species expanded. Among them, the Himalayan Griffon’s potential spatial distribution increased by 14.82%, exceeding 10% growth rates for the species such as Chinese Monal and Tibetan Snowcock. However, the potential spatial distribution for seven nationally protected bird species decreased. The Blue Eared-pheasant, with the highest reduction rate, decreased by 11.36%, while the reduction rates for the other six species were within 10%.
By computing the changes in species richness before and after the implementation of NFPP, we found that after the implementation of NFPP, the species richness of sympatric species within the implementation area showed a slight increase trend. The species richness of sympatric species increased, unchanged and decreased by 21.95%, 61.66% and 16.39%, respectively.
3.2
Spatial distribution and diversity shift under climate change
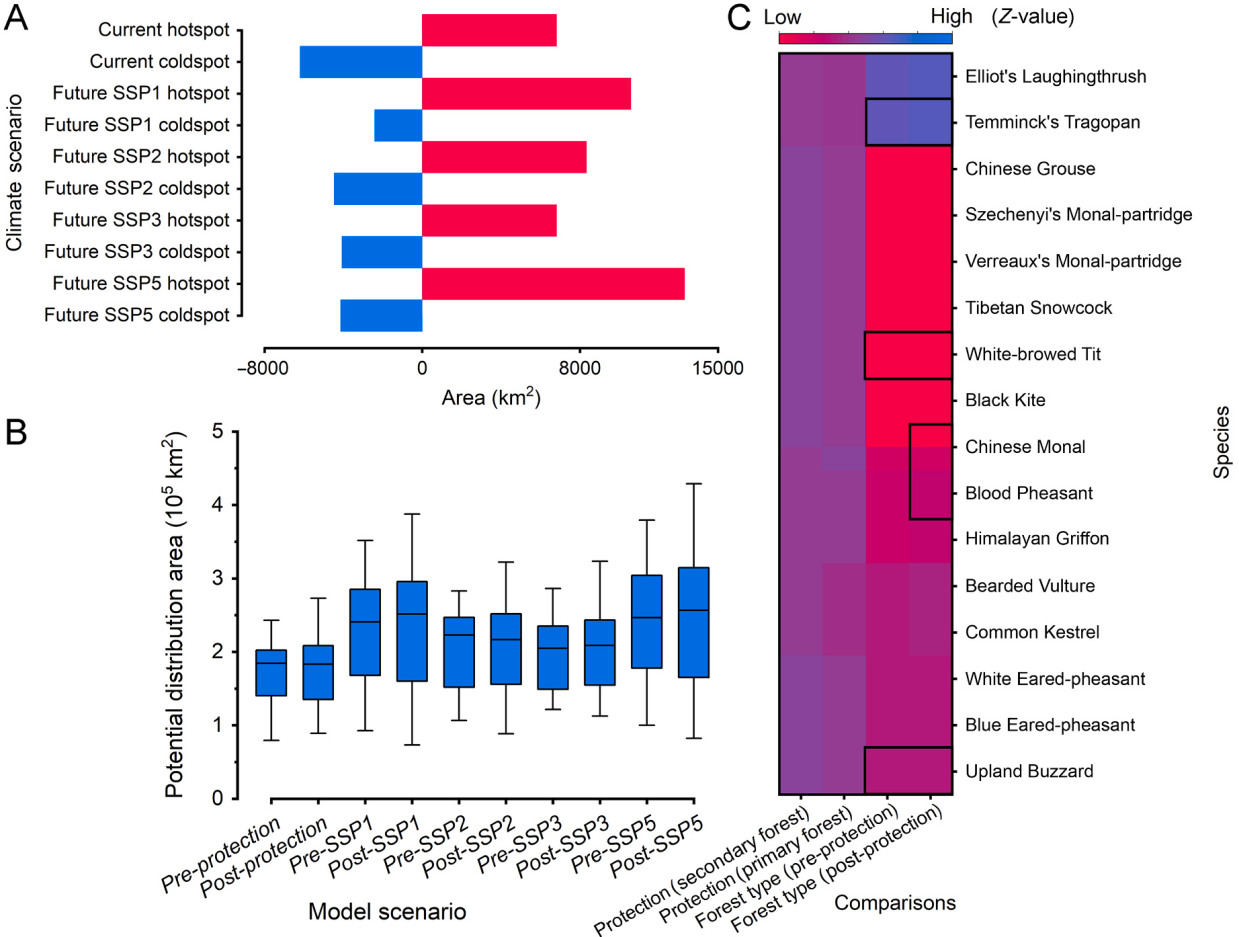
Comparing model "Post-protection" to model "Pre-protection", there was a noticeable increase in the overall potential spatial distribution of species, indicating that the implementation of NFPP has provided more suitable habitats for them. Under the four future levels of carbon emission scenarios, the areas of suitable distribution for lower levels (models Pre-SSP1, Post-SSP1) and very high levels (models Pre-SSP5, Post-SSP5) showed a significant increasing trend, and the areas for moderate levels (models Pre-SSP2, Post-SSP2) and high levels (models Pre-SSP3, Post-SSP3) also increased, albeit to a slightly lesser extent (see Fig. 2A).
Figure
2.
Comparison of potential spatial distribution under different climate scenarios (A); Variations in species diversity area under different climate scenarios (B); Variations in species diversity area under different climate scenarios (C).
Through pairwise comparisons between protection scenario and SSP scenario, it can be observed that, under the same trend of carbon emission changes, the potential spatial distribution for 16 nationally protected bird species had generally increased before and after NFPP implementation. Comparing the changes in scenario models Pre-SSP and Post-SSP with model "Post-protection", the distribution areas of these species will appropriately expand in response to global warming.
We found that the area of regions with high biodiversity increased, while the area of regions with low biodiversity decreased. Furthermore, under various future scenarios, the implementation of NFPP consistently plays a beneficial role in protecting and maintaining biodiversity (see Fig. 2B).
3.3
Effects of forest changes on potential spatial distribution of bird species
Using Mann‒Whitney U tests (see Fig. 2C), we found that compared to newly established secondary forests, protected primary forests exhibited enhanced conservation for forest birds (Z-value > 0 for six bird species, P < 0.1), while being less suitable for non-forest birds (significantly unsuitable for three non-forest bird species, Z-value < 0, P < 0.05; non-significantly unsuitable for four non-forest bird species, Z-value < 0, P > 0.1); unprotected primary forests were more suitable for forest bird habitats compared to the original plots of newly established secondary forests (Z-value > 0 for five bird species, P < 0.1), whereas the original plots of newly established secondary forests were more suitable for non-forest bird habitats compared to unprotected primary forests (Z-value < 0 for six non-forest bird species, P < 0.1); although not statistically significant (P > 0.1) when comparing protected and unprotected primary forests, positive effects on the conservation of 11 species, especially forest birds, were observed (Z-value > 0); following afforestation, although not statistically significant (P > 0.1), except for Crossoptilon auritum, conservation for the other 15 bird species showed a negative effect (Z-value < 0). We can find that the ecological value of secondary forests is lower than that of primary forests. Forest birds need a primary ecological environment instead of single-species plantations, while non-forest birds benefit from the process of artificial forestation.
4.
Discussion
The expansion of forested areas providing crucial habitats for wildlife and serving as a key support for biodiversity conservation (Lindenmayer et al., 2003). We found that after the implementation of NFPP, the forest area in the QTP has increased. At the same time, both under current conditions and in future climate change scenarios, the overall potential spatial distribution of these 16 national protected bird species has increased. This indicates the beneficial effects of NFPP implementation on conservation of avifauna of the QTP. We also found that the forest area of the QTP increased after the implementation of NFPP. In fact, there were some bird species whose potential spatial distribution decreased, indicating differences possibly arising from varying capacities among species to adapt to habitat changes and ecological niche distinctions (Zhu et al., 2023).
4.1
Differences in NFPP adaptability among forest birds and non-forest birds
To facilitate a more nuanced understanding, we categorized these 16 bird species into forest birds and non-forest birds, and compared their adaptability under different ecological restoration types within NFPP. The primary measures of NFPP implementation involve halting the logging of primary forests, protecting existing primary forests, and establishing new forested areas (Lamb et al., 2005). Traditionally, afforestation is believed to benefit forest birds (El-Keblawy and Ksiksi, 2005; Sodhi et al., 2005). However, our study yielded an opposite conclusion: the potential spatial distribution indices of most nationally protected forest bird species decreased after NFPP implementation. This may result from the fact that birds inhabiting forested areas and preferring colder environments are more vulnerable to habitat changes (Bosco et al., 2022). The newly established forested areas under NFPP, due to their shorter growth cycles, are not yet ideal habitats for these forest birds. Hua et al. (2018) also suggested that newly established forested areas may initially improve habitat quality, corroborating our study results. Compared to primary forests, secondary forests are less suitable for forest birds (Braunisch et al., 2019), leading to a reduction in their potential spatial distribution. However, forest birds are undoubtedly beneficiaries of NFPP implementation. First, by halting logging activities, the destruction of natural forests ceases, alleviating concerns for forest birds regarding habitat degradation (Sodhi et al., 2004). Our results also indicate that protecting primary forests has a positive effect on bird conservation. Then, although the newly established forested areas may not immediately become suitable habitats for forest birds, these areas will improve, offering them a greater variety of options to adapt to climate change (Scarano and Ceotto, 2015). Therefore, we contend that NFPP implementation is beneficial for the conservation of nationally protected forest birds, providing effective protection in both the short- and long-term.
4.2
The impact of NFPP on widely-distributed bird species
The implementation of NFPP over the past two decades has evidently benefited widely-distributed bird species. Our research reveals a notable increase in the potential spatial distribution of such species. Additionally, the newly added forested areas under NFPP have been embraced by these widely distributed bird species compared to primary forests (Lindenmayer et al., 2003). The QTP is situated in a high-altitude cold region with a longer tree growth cycle, leading to relatively monotonous afforestation practices (Hua et al., 2016). These forest types thus may temporarily fail to meet the habitat requirements of forest birds. However, these forested areas in such a state provide richer options for widely distributed bird species (Brockerhoff et al., 2013). Unlike dense forests, newly established secondary forests typically exhibit diverse vegetation structures, including trees, shrubs, and herbaceous plants of various heights, offering abundant niches for birds. Compared to primary forests, secondary forests may experience less competition and predation pressure (Murray et al., 2020), as the habitat complexity and resource abundance in secondary forests potentially alleviate such pressures, making it easier for non-forest birds to establish territories and reproduce. Overall, the protection and maintenance of primary forests within NFPP are effective in conserving bird species, while the afforestation efforts require further validation over time.
4.3
The impact of global warming and NFPP on the potential spatial distribution of protected bird species
Under the same trend of carbon emission changes, the potential spatial distribution ranges of 16 nationally protected bird species before and after the implementation of NFPP have all been expanded, with species’ niches appropriately expanding due to global warming (Osland et al., 2021). This suggests a universal impact of global warming on the potential spatial distribution ranges of bird species. Global warming may enable highly adaptable bird species to colonize new habitats in areas previously unsuitable for their survival (Brambilla et al., 2018), thus expanding their potential spatial distribution ranges. However, for bird species reliant on specific habitats and with lower adaptability, global warming may lead to the loss or degradation of their original habitats, thereby negatively impacting their potential spatial distribution. Continuous implementation of NFPP is beneficial for maintaining existing habitats and can enhance habitat quality, providing a potential solution for wildlife to resist the future effects of climate change.
Our study has several limitations that should be acknowledged. First, the accuracy of land cover data may affect the reliability of our habitat suitability assessments. Although we used the most recent and widely recognized datasets, uncertainties in land cover classification, especially in regions with complex terrain or rapid land-use changes, could influence the results. Second, the assumptions made in the SDMs, such as the equilibrium between species distribution and environmental conditions, may not fully capture the dynamic nature of species responses to environmental changes. Additionally, the SDMs rely on presence-only data, which may introduce biases due to uneven sampling efforts or incomplete species records. Future studies could incorporate higher-resolution land cover data and more comprehensive species occurrence records to improve model accuracy. Despite these limitations, our findings provide valuable insights into the impacts of NFPP and climate change on bird species distribution, and we believe they contribute to the broader understanding of biodiversity conservation under changing environmental conditions.
5.
Conclusion
The implementation of NFPP within the QTP has played a significant role in protecting locally protected bird species. It has not only increased the overall potential spatial distribution of nationally protected bird species but also enhanced the overall potential spatial distribution under different climate change scenarios. Species richness in sympatric distributions has also increased benefitting from the project. The conservation of primary forests has provided more suitable habitats for forest birds, whereas the increase in secondary forests, compared to primary forests, favors the dispersal of non-forest bird species. During the implementation of NFPP, conservation efforts should prioritize the protection and restoration of primary forests to support forest-dependent bird species, and a multi-tiered implementation framework should be established, including continuously advancing the construction of a national park-centered nature reserve system and fully implementing NFPP to ensure long-term protection of species and habitats, strengthening scientific research and monitoring of endangered species and their habitats as well as increasing surveys and conservation of non-flagship species, and considering landscape heterogeneity in the implementation of NFPP to enhance landscape diversity.
The authors declare that they have no known competing financial interests or personal relationships that could have appeared to influence the work reported in this paper.
Acknowledgements
We are grateful to the Administration of the Taohe River National Nature Reserve for their support to carry out this work.
Bosco, L., Xu, Y., Deshpande, P., Lehikoinen, A., 2022. Range shifts of overwintering birds depend on habitat type, snow conditions and habitat specialization. Oecologia 199, 725–736.
Brambilla, M., Resano-Mayor, J., Scridel, D., Anderle, M., Bogliani, G., Braunisch, V., et al., 2018. Past and future impact of climate change on foraging habitat suitability in a high-alpine bird species: management options to buffer against global warming effects. Biol. Conserv. 221, 209–218.
Braunisch, V., Roder, S., Coppes, J., Froidevaux, J.S., Arlettaz, R., Bollmann, K., 2019. Structural complexity in managed and strictly protected mountain forests: effects on the habitat suitability for indicator bird species. For. Ecol. Manag. 448, 139–149.
Brockerhoff, E.G., Jactel, H., Parrotta, J.A., Ferraz, S.F., 2013. Role of eucalypt and other planted forests in biodiversity conservation and the provision of biodiversity-related ecosystem services. For. Ecol. Manag. 301, 43–50.
Brooks, T.M., Mittermeier, R.A., Da Fonseca, G.A., Gerlach, J., Hoffmann, M., Lamoreux, J.F., et al., 2006. Global biodiversity conservation priorities. Science 313, 58–61.
Bryan, B.A., Gao, L., Ye, Y., Sun, X., Hou, X., 2018. China’s response to a national land-system sustainability emergency. Nature 559, 193–204.
Cowie, R.H., Bouchet, P., Fontaine, B., 2022. The Sixth Mass Extinction: fact, fiction or speculation? Biol. Rev. 97, 640–663.
El-Keblawy, A., Ksiksi, T., 2005. Artificial forests as conservation sites for the native flora of the UAE. For. Ecol. Manag. 213, 288–296.
Feijó, A., Ge, D., Wen, Z., Cheng, J., Xia, L., Patterson, B.D., et al., 2022. Mammalian diversification bursts and biotic turnovers are synchronous with Cenozoic geoclimatic events in Asia. Proc. Natl. Acad. Sci. USA 119, e2087122177.
Gao, M., Xu, R., Huang, J., Su, B., Jiang, S., Shi, P., et al., 2023. Increase of carbon storage in the Qinghai-Tibet Plateau: perspective from land-use change under global warming. J. Clean. Prod. 414, 137540.
He, G., Chen, X., Beaer, S., Colunga, M., Mertig, A., An, L., et al., 2009. Spatial and temporal patterns of fuelwood collection in Wolong Nature Reserve: implications for panda conservation. Landsc. Urban Plann. 92, 1–9.
He, J., Lin, H., Wang, R., Dai, C., Yu, H., Tu, J., et al., 2022. Joint effects of environmental filtering and dispersal limitation on the species assemblage of the Tibetan Plateau. J. Biogeogr. 49, 640–653.
Heller, N.E., Zavaleta, E.S., 2009. Biodiversity management in the face of climate change: a review of 22 years of recommendations. Biol. Conserv. 142, 14–32.
Hickey, G.M., Innes, J.L., 2008. Indicators for demonstrating sustainable forest management in British Columbia, Canada: an international review. Ecol. Indic. 8, 131–140.
Hua, F., Wang, X., Zheng, X., Fisher, B., Wang, L., Zhu, J., et al., 2016. Opportunities for biodiversity gains under the world’s largest reforestation programme. Nat. Commun. 7, 12717.
Hua, F., Xu, J., Wilcove, D.S., 2018. A new opportunity to recover native forests in China. Conserv. Lett. 11, e12396.
Lamb, D., Erskine, P.D., Parrotta, J.A., 2005. Restoration of degraded tropical forest landscapes. Science 310, 1628–1632.
Lei, F., Qu, Y., Song, G., 2014. Species diversification and phylogeographical patterns of birds in response to the uplift of the Qinghai-Tibet Plateau and Quaternary glaciations. Curr. Zool. 60, 149–161.
Li, W., Chen, J., Zhang, Z., 2020. Forest quality-based assessment of the returning Farmland to forest program at the community level in SW China. For. Ecol. Manag. 461, 117938.
Lindenmayer, D.B., Hobbs, R.J., Salt, D., 2003. Plantation forests and biodiversity conservation. Aust. For. 66, 62–66.
Liu, Y., Ren, H., Zheng, C., Zhou, R., Hu, T., Yang, P., et al., 2021. Untangling the effects of management measures, climate and land use cover change on grassland dynamics in the Qinghai-Tibet Plateau, China. Land Deg. Dev. 32, 4974–4987.
Lou, Y., Zhao, J., Fang, Y., Sun, Y., 2015. Brood habitat selection of Chinese Grouse (Tetrastes sewerzowi) at lianhuashan, Gansu, China. Wilson J. Ornithol. 127, 310–318.
Murray, K., Soh, M.C., Puan, C.L., Abu Hashim, A.K.B., Abdul Patah, P.B., Peh, K.S., 2020. Predation on multiple prey types across a disturbance gradient in tropical montane forests of Peninsular Malaysia. Front. For. Glob. Change 3, 80.
Osland, M.J., Stevens, P.W., Lamont, M.M., Brusca, R.C., Hart, K.M., Waddle, J.H., et al., 2021. Tropicalization of temperate ecosystems in North America: the northward range expansion of tropical organisms in response to warming winter temperatures. Glob. Change Biol. 27, 3009–3034.
Phillips, S.J., Anderson, R.P., Schapire, R.E., 2006. Maximum entropy modeling of species geographic distributions. Ecol. Model. 190, 231–259.
Pinsky, M.L., Comte, L., Sax, D.F., 2022. Unifying climate change biology across realms and taxa. Trends Ecol. Evol. 37, 672–682.
Ren, G., Young, S.S., Wang, L., Wang, W., Long, Y., Wu, R., et al., 2015. Effectiveness of China’s national forest protection program and nature reserves. Conserv. Biol. 29, 1368–1377.
Ruxton, G.D., 2006. The unequal variance t-test is an underused alternative to Student’s t-test and the Mann–Whitney U test. Behav. Ecol. 17, 688–690.
Scarano, F.R., Ceotto, P., 2015. Brazilian Atlantic forest: impact, vulnerability, and adaptation to climate change. Biodivers. Conserv. 24, 2319–2331.
Sodhi, N.S., Koh, L.P., Prawiradilaga, D.M., Tinulele, I., Putra, D.D., Tan, T.H.T., 2005. Land use and conservation value for forest birds in Central Sulawesi (Indonesia). Biol. Conserv. 122, 547–558.
Tian, Z., Huo, D., Yi, K., Que, J., Lu, Z., Hou, J., 2024. Evaluation of suitable habitats for birds based on maxent and google earth engine—a case study of Baer’s Pochard (Aythya baeri) in Baiyangdian, China. Remote Sens. 16, 64.
Wen, Z.X., Yang, Q.S., Quan, Q., Xia, L., Ge, D.Y., Lv, X., 2016. Multiscale partitioning of small mammal -diversity provides novel insights into the Quaternary faunal history of Qinghai-Tibetan Plateau and Hengduan Mountains. J. Biogeogr. 43, 1412–1424.
Yang, J., Huang, X., 2022. The 30 m annual land cover datasets and its dynamics in China from 1990 to 2021. Earth Syst. Sci. Data 13, 3907–3925.
Ye, C., Wang, S., Wu, S., Zhou, T., 2024. Impacts of future permafrost degradation and human modification on terrestrial vertebrates. Biol. Conserv. 291, 110475.
Zhao, Z., 2001. Ornithology of China, vol. 1. Non-Passerine. Jilin Science and Technology Press, Changchun..
Zhu, G., Giam, X., Armsworth, P.R., Cho, S., Papeş, M., 2023. Biodiversity conservation adaptation to climate change: protecting the actors or the stage. Ecol. Appl. 33, e2765.


 DownLoad:


 Email Alerts
 RSS Feeds