Extra-pair copulation (EPC) can potentially maximize individual reproductive fitness, and this process may involve sexual selection of male and female traits that reflect individual quality. Previous studies have implied that adult characteristics are associated with the probability of extra-pair paternity (EPP), but it differs between species. Moreover, there are relatively few examples of the adaptive rationale for females’ engagement in EPCs based on an examination of these more traditionally recorded traits, in combination with female flight-mediated traits such as wing length. We investigated whether EPP existed in the wild Chestnut Thrush (Turdus rubrocanus) population during three breeding seasons (2019–2021), and whether paternity was related to morphological traits of males and females. Eight highly variable microsatellite loci were used to identify paternity, and generalized linear mixed models were used to analyze the relationship between paternity and morphological traits. We found that EPP existed in the Chestnut Thrush. 53.3% (N = 41/77) of the broods contained at least one extra-pair offspring (EPO), and 34.6% (N = 72/208) of the nestlings were EPO. We also found that male wing length was negatively associated with the probability of EPP and the proportion of EPO. Female body length was positively related to the probability of EPP. Both female body condition and mass were negatively associated with the proportion of EPO. While other traits of male and female did not relate to the probability of EPP or the proportion of EPO. Extra-pair males had better body condition compared to the males they cuckolded. EPO did not differ from their half-siblings in terms of body size or body condition. The results suggest that body size and body condition were associated with EPP in the Chestnut Thrush. This study provides fundamental information for further studies on the evolution and maintenance of EPP in the Chestnut Thrush, and it is also useful for the comparison of EPP among Turdus species.
Amounting evidence has indicated that current biodiversity loss rates are higher than the pre-human background rate (Cowie et al., 2022), and the Earth is at the start of, or perhaps in the midst of, the "sixth mass extinction" (Barnosky et al., 2011). Besides species extinctions (taxonomic diversity), the loss of biodiversity also encompasses pruning of the tree of life (phylogenetic diversity) (George et al., 2022) and erosion of species' roles in ecosystem services (functional diversity), yet inadequate data or limited resources make most conservation plans rely on the use of single taxonomic diversity, under the assumption that it could adequately capture other dimensions of biodiversity. However, recent studies have cautioned that different biodiversity measures are not always spatially congruent (Devictor et al., 2010; Pardo et al., 2017), and taxonomic diversity alone can provide few insight into the origin and functioning of ecosystems (Díaz et al., 2006; Pollock et al., 2017; Rosauer et al., 2017). Therefore, quantifying and integrating different aspects of biodiversity are necessary to better inform the global conservation strategy.
Biodiversity preservation inevitably requires the identification of biodiverse areas, attained through surveys which should ideally include all taxonomic groups (Natsukawa and Sergio, 2022). However, mapping all taxa is unavoidably intensive in terms of time or resource, the employment of reliable indicator species is intuitively pleasing as it provides measurement shortcuts and allows for more cost-effective management decisions (Caro and Girling, 2010). Birds are relatively easy to detect and identify, and have long been monitored worldwide (Xu et al., 2021; Wang et al., 2022) and tend to be at, or near, the top of the food chain, making them sensitive to changes at lower trophic levels (Gregory et al., 2005). Many examples exist about the relationships between biodiversity patterns and the distribution, abundance, or richness of a single or a group of bird species. For instance, the density of Hooded Crow (Corvus cornix) has been used as a surrogate for wetland bird species richness (Kosicki and Chylarecki, 2014); The presence of Cuckoo (Cuculus canorus) was positively correlated with higher bird species richness (Morelli et al., 2015, 2017; Møller et al., 2017); and raptors are also considered as reliable biodiversity indicators (Sergio et al., 2008; Burgas et al., 2014).
Grassland birds have experienced steep decline in the past few decades. In particular, the depletion of native grassland bird populations in North America, driven by habitat loss and intensive toxic pesticide use in both breeding and non-breeding areas, mirrors loss of farmland birds throughout Europe and elsewhere (Jiguet et al., 2010; Rosenberg et al., 2019). Though several grassland birds (e.g., buntings) have been suggested as good indictors of habitat quality or agricultural intensity at European scale (Szymkowiak et al., 2014), few studies have tested whether there exists a single or a subset bird species acting as efficient indictors of habitat status or diversity hotpots on Asian grassland ecosystem. Several criteria have been proposed to identify suitable indicators (Wiens et al., 2008). Fleishman et al. (2000) recommended that an ideal indicator would be somewhat scarce and highly sensitive to disturbance, co-occur with a high percentage of other species. Carrascal et al. (2012) suggested small endemic birds with moderate densities, less threatened status, and broad habitat preferences are ideal candidates for modeling bird species richness at a global scale. The implicit assumption in the use of indicator species is largely predicated on concordance between the indicator and the background species in distribution, abundance, ecological requirements, and threats. Such concordance, however, is generally assumed but not critically assessed (Caro and Girling, 2010).
The Mongolian Lark (Melanocorypha mongolica) is a brightly-colored lark with a wide distribution from southern Russia and Mongolia to Central China. As a ground-nesting bird, it generally breeds in grassy steppe next to rivers or lakes. It is highly distinctive in flight and usually seen singly. The charismatic appearance and elaborate singing make it a famous, precious caged bird in Chinese tradition (Zhao, 2001). Recent studies have shown that Mongolian Lark tend to co-occur with several other steppe birds (such as Jankowski's Bunting Emberiza jankowskii and Eurasian Skylark Alauda arvensis), and, furthermore, habitat requirements of the Mongolian Lark exhibit a large overlap not only with steppe songbirds but also grassland-obligate species that use mixed habitats (such as Isabelline Wheatear Oenanthe isabelline and Grey-capped Greenfinch Carduelis sinica) (Han et al., 2020), suggesting that it is a potential indicator of grassland bird diversity. Mongolian Lark has been identified as a species of conservation concern, and now is at the Class Ⅱ protection level according to the "List of key protected wild animals in China" published in 2021 (http://www.gov.cn/xinwen/2021-02/09/content_5586227.htm). Based on its status as a grassland specialist and its shared habitat requirement with other steppe birds, our primary objective was to determine if the Mongolian Lark (or another species) would make a suitable indicator for different components of grassland bird biodiversity in Inner Mongolia, China. We predicted that this species' occurrence would be closely associated with other steppe birds. We further investigated the relationship between its occurrence and taxonomic diversity, functional diversity and phylogenetic diversity of avian communities in Mongolian grassland. Time and funding constraints highlight the need for efficient approaches to manage wildlife habitat (Elliott and Johnson, 2018), a deep understanding of connections linking indicator species and biodiversity in general will provide useful insights for informing action plans for biodiversity conservation and management strategies (Morelli et al., 2017).
2.
Materials and methods
2.1
Study area
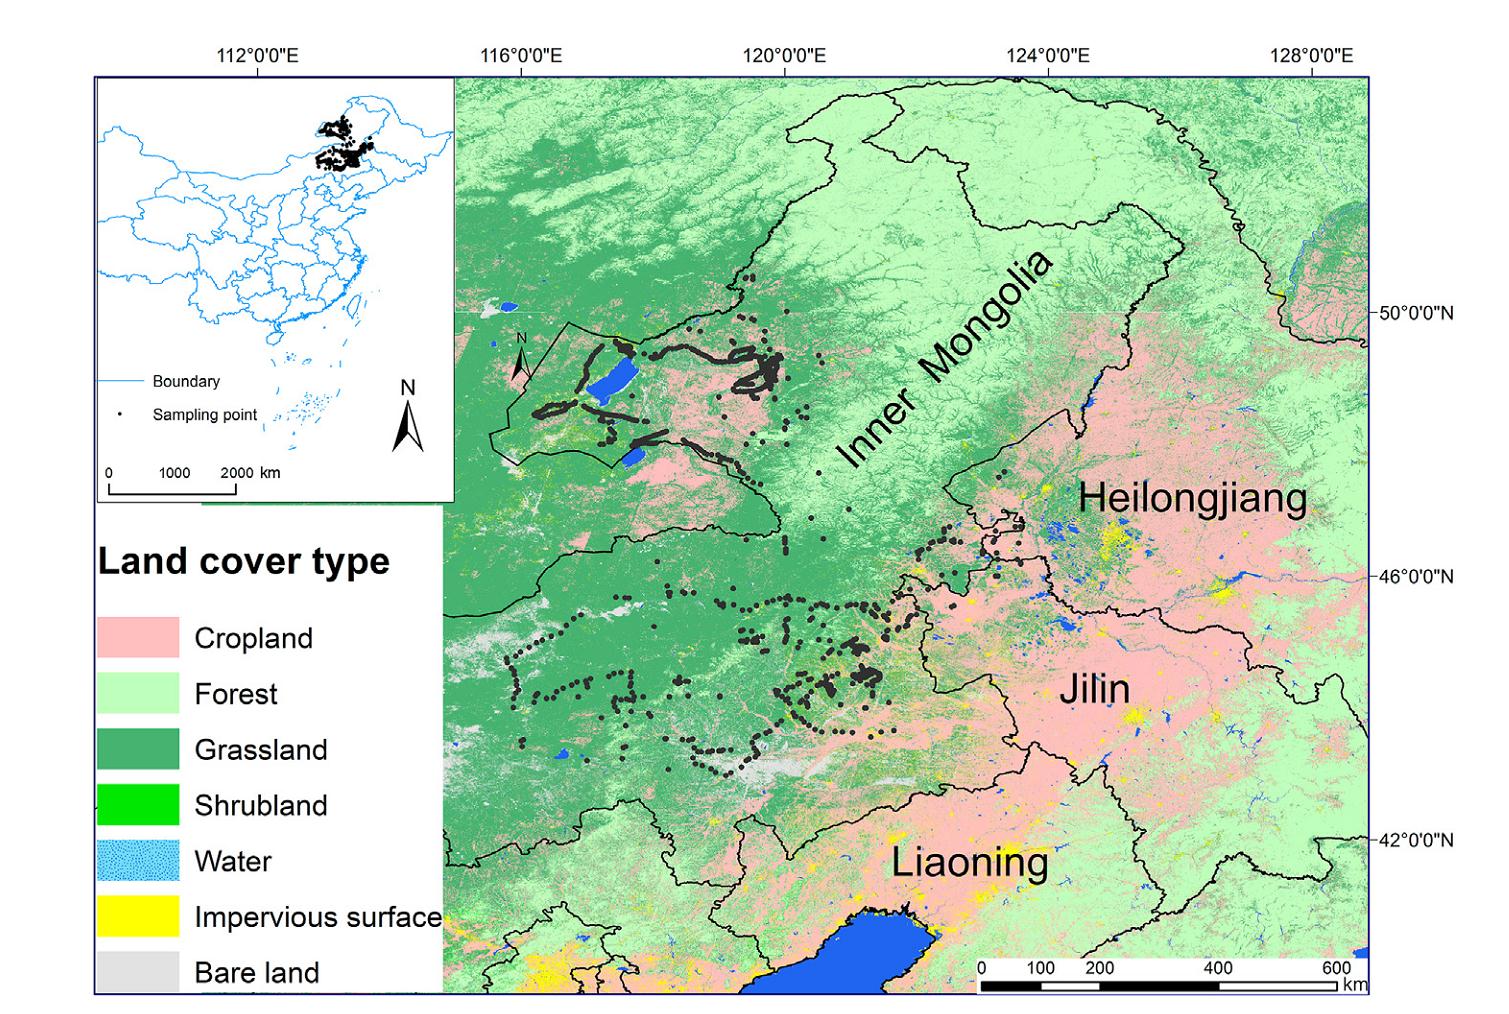
The present study was carried out in the eastern part of Inner Mongolia, China (Fig. 1). The climate is continental and temperate. The mean annual temperature is 6–7 ℃, and the mean annual rainfall is 300–400 mm, most of which falls during the vegetation period from April to September (Wu et al., 2015). The study area consists three dominant vegetation zones: the temperate coniferous and deciduous forests zone, the meadow steppe zone and the typical steppe zone (Han et al., 2009; Wu et al., 2015). Scattered fragment includes croplands, bare lands, tree plantations and human settlements, embedded in steppes constitute the rest landscapes in the study area. Specifically, bare lands are sites with little vegetation, composed primarily of exposed soil, sand, gravel, and rock backgrounds. Tree plantations are mainly composed of commercial 3 to 10-year-old Populus and Sibirica. Human settlements are generally small towns or cities, where buildings, houses, and paved roads increased in density from the rural to the core urban zone (Han et al., 2021).
Figure
1.
Locations of bird sampling sites (in grey) in Inner Mongolia. The map source is from http://data.ess.tsinghua.edu.cn/.
From 2018 to 2022, we sampled bird assemblages by the point-count method (Bibby et al., 2000) between 20 April and 10 July, coinciding with the peak breeding season of grassland birds in Inner Mongolia, China. Sampling sites were visited twice, once before and once after 20 May, with 4–6 weeks between sampling events. A species was considered present if detected on at least one sampling event. Sites were selected according to accessibility, considering also representativeness of different landscapes present in the region. The distance between two adjoining sites was at least 500 m apart to avoid double counting. Five highly experienced ornithologists participated in this survey. The observers stood at a fixed location for a 10-min period and recording all birds seen or heard within 100 m radius. Birds that flying over were counted only if they were actually using the circular plot (e.g., foraging or displaying). Point counts were performed within 4 h after sunrise, avoiding days with bad weather, such as persistent fog, steady drizzle, prolonged rain, or winds greater than Beaufort 3 (13–19 km/h).
2.3
Biodiversity measures
For measures of taxonomic diversity, we obtained species richness (rarefied by the minimum rowSums) and Shannon diversity for each sampling point with the 'specnumber' and 'diversity' functions of the R vegan package, respectively (Oksanen et al., 2022). We also made log (1 + x) transformation for bird abundance of each sampling point.
For measures of functional diversity (FD), we calculated Functional richness (FRic) and Rao's quadratic entropy (RaoQ) of each sampling point. FRic measures the volume of multidimensional functional space occupied by a community, while RaoQ reflects changes in the abundance-weighted sum of pairwise functional distance between functional entities (Mouillot et al., 2013). We determined the functional diversity metrics by combining the relative bird abundance data with eight biological traits: beak width, tarsus length, hand wing index (HWI), mass, range size, migration, habitat type and trophic level, which are obtained from the AVONET database, a compilation of individual-level trait measurements for all the world's bird species (Tobias et al., 2022). These traits generally related to species' habitat selection, resource requirements or reproduction. Based on the functional traits matrix, we calculated Gower's distances between species and then converted it into a dendrogram using the unweighted pair group averaging (UPGMA) clustering algorithm (Podani and Schmera, 2006). We computed the FRic and RaoQ using the package 'FD' developed by Petchey and Gaston (2002).
We downloaded the global phylogenetic tree of birds from "BirdTree" under the option of 'Hackett All Species: a set of 10,000 trees with 9993 OTUs each' (http://birdtree.org) (Jetz et al., 2014), and pruned them with the data subset of bird abundance. We calculated the phylogenetic diversity (PD) of each sampling point using the ''pd'' function in the "picante" R package (Kembel et al., 2010).
To eliminate the effect of species richness on FRic, RaoQ and PD, we performed null model analysis to assess whether the observed PD or FD metrics were significantly different than expected given the observed species richness per se (Mouchet et al., 2010). For each sampling point, we randomized species' occurrence frequencies with the independent swap algorithm and maintained the trait matrix at its original configuration (Gotelli, 2000). We repeated the randomization process 999 times and calculated the standardized effective size (SES) of FD and PD values as follows: SES = (Xobs – μnull)/σnull, where Xobs is the observed FD or PD value, μnull and σnull are the mean and standard deviation of randomized FD or PD value, respectively. Negative and positive SES values represent communities that are less or more functionally/phylogenetically diverse than expected given their species richness (Rader et al., 2014).
2.4
Indicator species selection and assessment
Based on the six biodiversity measures, we clustered the sampling sites into different groups using k-means, a nonhierarchical clustering procedure whose aim is to maximize the among-group variability (Dufrene and Legendre, 1997). We set the value of k as three, to cluster sites into three groups with relatively low, moderate and high biodiversity, respectively. To test the statistical significance among groups, we used a pairwise two-sided Wilcoxon signed rank analysis (Nooten et al., 2021).
We then applied indicator value (IndVal) analysis to determine which species can be used as indicators of certain site group (de Cáceres et al., 2012). The IndVal is computed as: IndValij = Specificityij × Fidelityij × 100, where IndValij is the Indicator Value of ith species in relation to a jth type of site; "specificityij" gives the probability of a site being a member of the site-group combination when the species has been found at that site (i.e., the positive predictive power of the species as ecological indicator of the site-group combination (de Cáceres et al., 2010). "Fidelityij" informs how frequently (and hence how easily) the species i will be found in a newly surveyed plot belonging to the same site group j (Dufrene and Legendre, 1997). Indicator Value index is widely used to measure the association between a species and a site group, and the statistical significance of their relationship is tested using a permutation test. For different site groups, bird species with a value of IndVal larger than 0.3 and a p-value less than 0.05 were printed for the further indicator species selection. IndVal analysis was performed using the R package 'indicspecies' (de Cáceres and Legendre, 2009).
To reveal the compositional difference among groups, non-metric multidimensional scaling (NMDS) was performed using Bray–Curtis dissimilarity on bird abundance data. NMDS was run using the first two dimensions and random starting iterations to obtain the lowest stress value. NMDS was complemented by permutational multivariate analysis of variance (PERMANOVA) with 999 permutations to test the significance of observed differences between identified bird associations. The 'metaMDS' and 'adonis 2' functions in the vegan package (Oksanen et al., 2022) of R version 4.1.2 (R Core Team, 2021) were applied for NMDS and PERMANOVA, respectively.
The relationship between Mongolian Lark occurrence and six biodiversity measures (species richness, Shannon diversity, abundance, sesFRic, sesRaoQ and sesPD) at each sampling point were examined using linear models. We built six individual models and used occurrence of Mongolian Lark as covariate and biodiversity measures as response variables, respectively. We constructed quantile-quantile (Q-Q) plots for each fitted model as a graphical check of goodness of fit. We also tested whether there is any other single species or species combination that shows high predictive value for the target biodiversity measures. The overall quality of each linear model was assessed by different indices (e.g., Akaike's Information Criterion, adjusted r-squared) that provided by the "performance" package (Lüdecke et al., 2021).
3.
Results
A total of 15,701 individuals of 139 bird species were recorded across 1295 different sampling sites in the whole study area. The average species richness was 3.2 (sd = 0.34), ranging between 1 and 18 bird species. Shannon's diversity values ranged from 0.4 to 1.9 with an average of 1.1 (sd = 0.27). The most abundant bird was Tree Sparrow (Passer montanus; 3165 individuals), followed by Northern Lapwing (Vanellus; 908 individuals) and Eurasian Skylark (878 individuals). Tree Sparrow also displayed the highest occurrence frequency, being detected in 568 of the 1295 sampling points (44%), and followed by Eurasian Skylark (31%) and Mongolian Lark (18%). Most species were detected at less than ten sites, either because they are rare or hardly detectable, hence, we decided to exclude them from subsequent analyses, and estimated the diversity indices from the occurrence and abundance of the remaining 32 species.
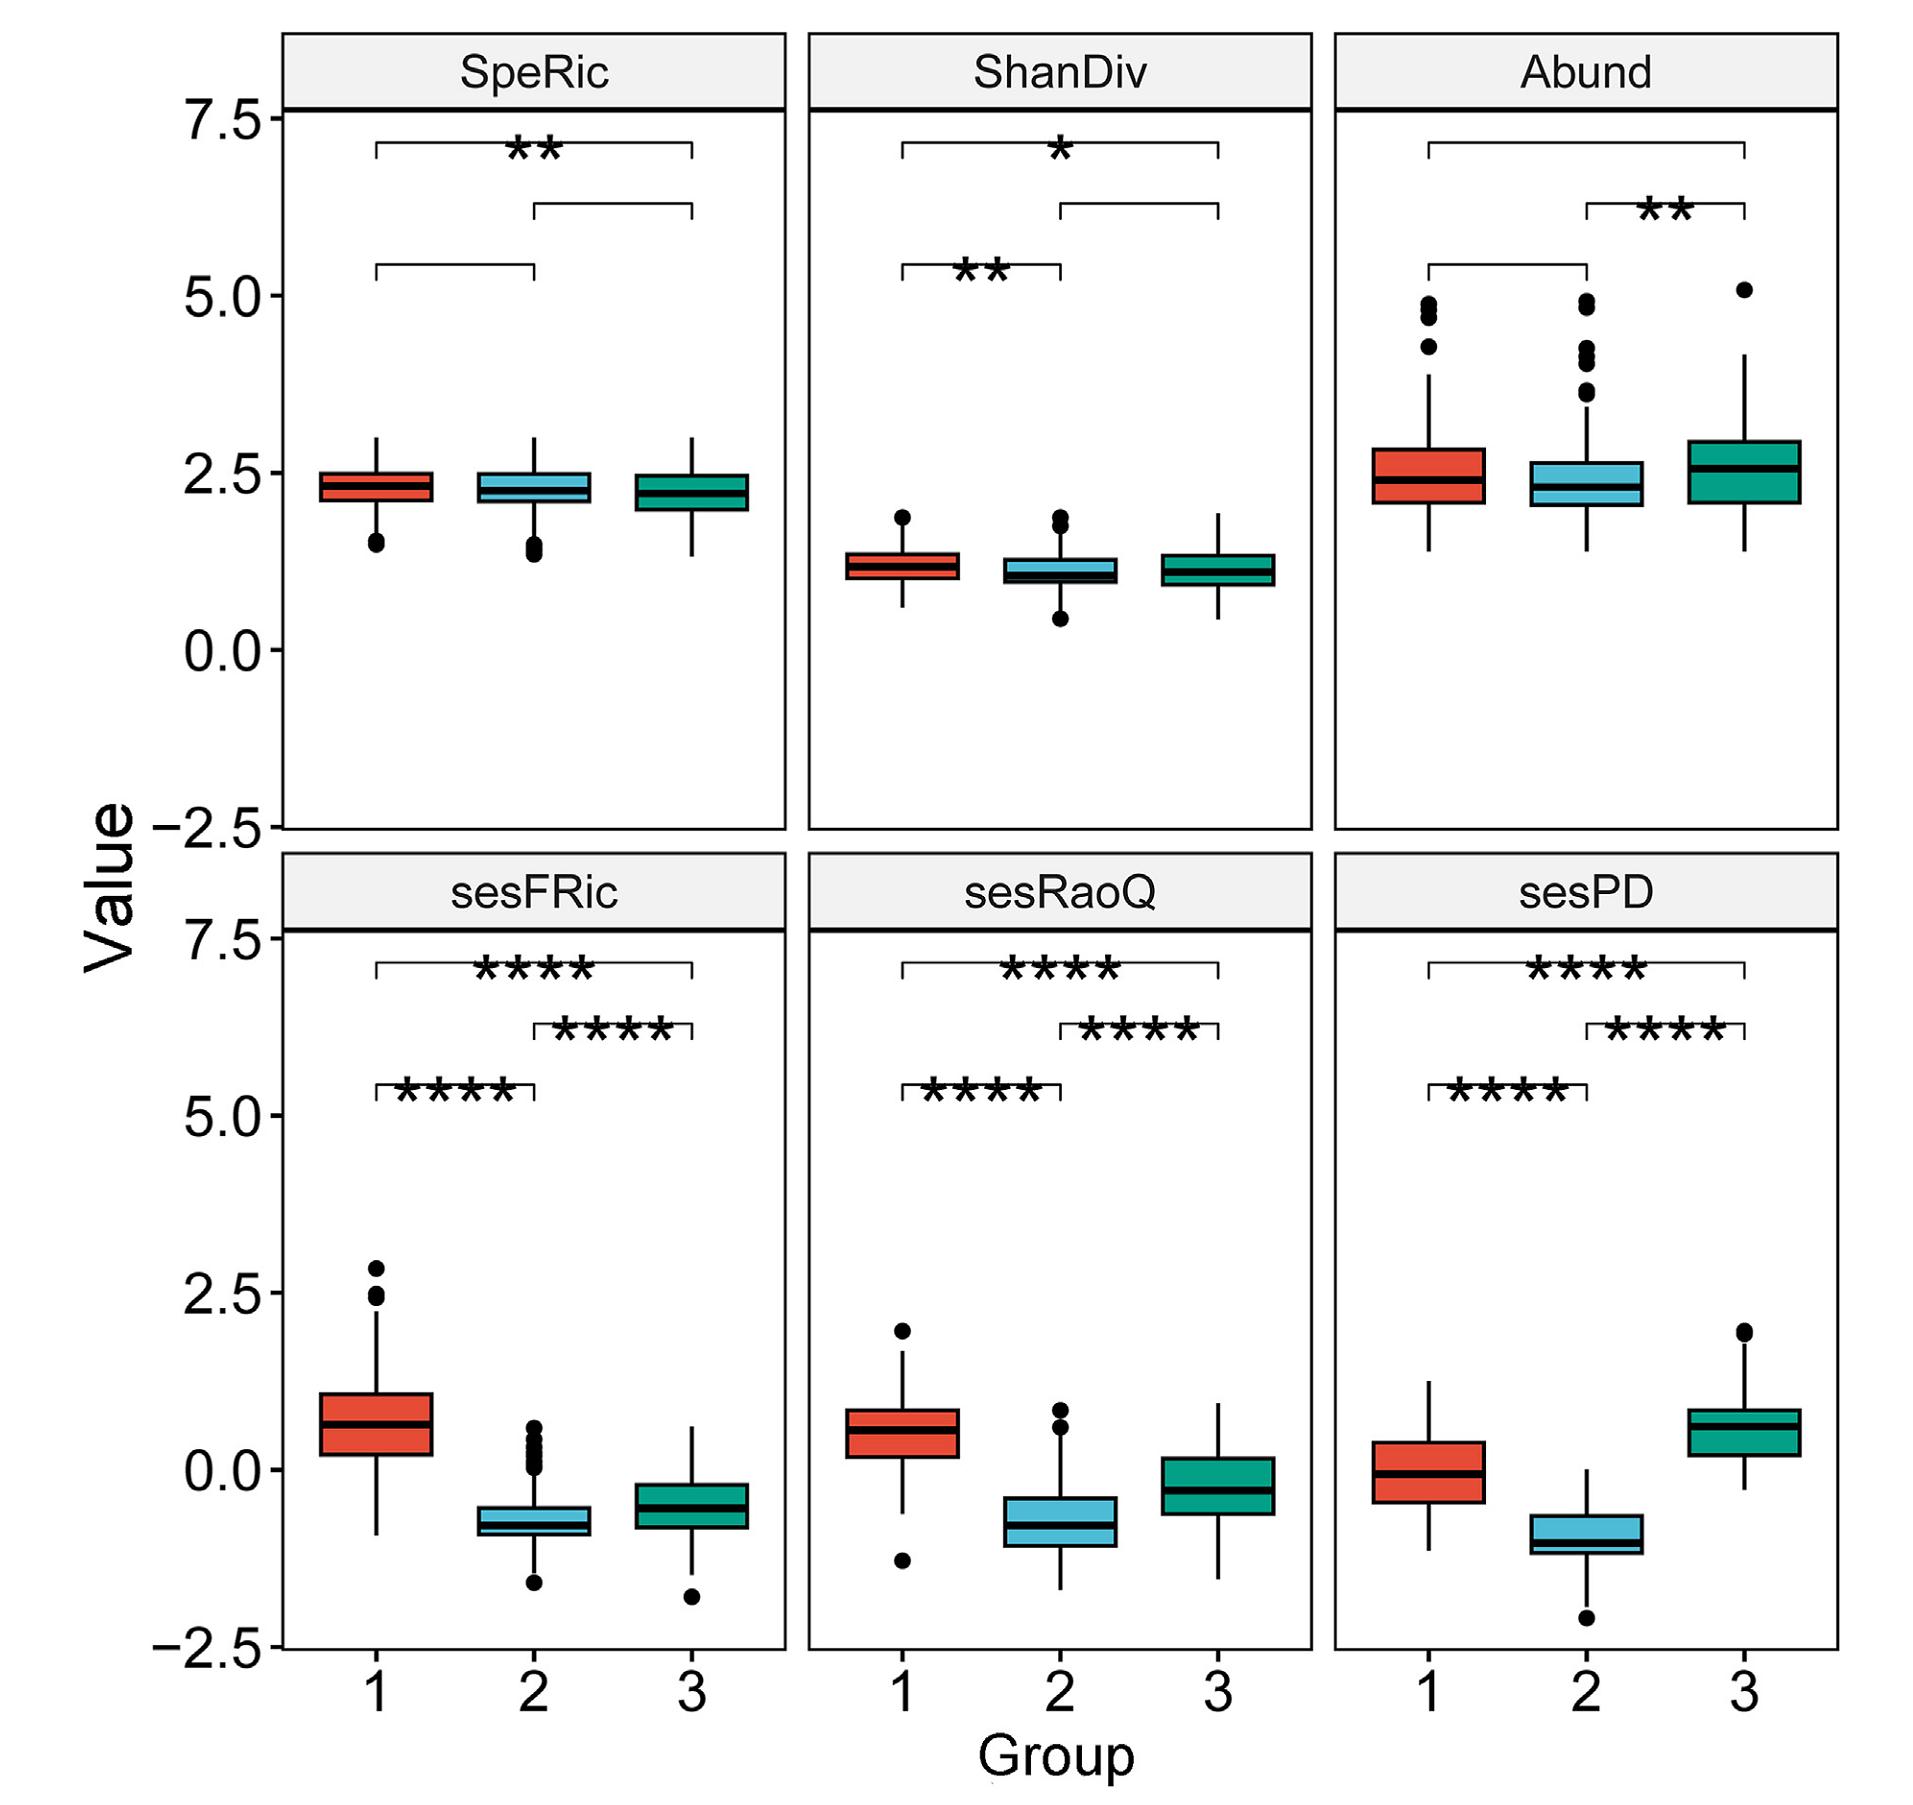
The Pearson correlation coefficients among the six biodiversity measures indicated sesFRic, sesRaoQ and sesPD are truly independent of species richness (coefficient value with which is −0.04 (p = 0.35), 0.23 (p < 0.001) and 0.003 (p = 0.93), respectively, Appendix Fig. S1). For the taxonomic measures, group 1 and group 3 showed a significant difference in species richness, while group 2 and group 3 had a significant difference in species abundance. For the sesFRic, sesRaoQ and sesPD, the multiple comparison tests revealed significant differences existing between all paired groups, and the lowest values were all found in group 2 (Fig. 2).
Figure
2.
Comparison of six bird biodiversity measures among the three groups. Top panel: rarefied Species Richness (SpeRic), Shannon Diversity (ShanDiv), and log (x + 1) transformed Abundance (Abund); Bottom panel: standard effective size of Functional Richness (sesFRic), standard effective size of Rao's quadratic entropy (sesRaoQ), and standard effective size of phylogenetic diversity (sesPD). The box plots show medians, quartiles, 5th- and 95th-percentiles and extreme values. Significance was determined by Wilcoxon rank-sum test. Ns: p > 0.05, *: p ≤ 0.05, **: p ≤ 0.01, ***: p ≤ 0.001, ****: p ≤ 0.0001.
Fourteen species (44%) were identified as indicator species for at least one group. Of which, Tree Sparrow was significantly associated with group 1, Mongolian Lark and Asian Short-toed Lark (Calandrella cheleensis) with group 2, Eurasian Hoopoe (Upupa epops), Pacific Swift (Apus pacificus), and Eurasian Collared Dove (Streptopelia decaocto) with group 3 (Table 1). When considering group combinations, Eurasian Skylark can be best used as indicator for group 1 + 2, Barn Swallow (Hirundo rustica), Eurasian Magpie (Pica) and Brown Shrike (Lanius cristatus) were significantly associated with group 1 + 3, while Horned Lark (Eremophila alpestris) was more prevailing in group 2 + 3. Furthermore, Mongolian Lark showed the highest indicator value in comparison with other potential species indicators, and the values of fidelity were larger for Mongolian Lark than for other birds (Table 1).
Table
1.
Indicator species for different groups or group combinations.
Species
Specificity
Fidelity
Indicator value
p-value
Group 1
Hirundo daurica
0.62
0.15
0.30
0.001
Group 2
Melanocorypha mongolica
0.69
0.59
0.64
0.001
Group 2
Calandrella cheleensis
0.69
0.40
0.53
0.001
Group 3
Upupa epops
0.60
0.29
0.42
0.001
Group 3
Apus pacificus
0.92
0.15
0.37
0.001
Group 3
Streptopelia decaocto
0.69
0.18
0.36
0.001
Group 1 + 2
Alauda arvensis
0.82
0.47
0.62
0.001
Group 1 + 3
Hirundo rustica
0.85
0.36
0.56
0.001
Group 1 + 3
Pica
0.81
0.35
0.53
0.001
Group 1 + 3
Lanius cristatus
0.89
0.20
0.42
0.001
Group 1 + 3
Phasianus colchicus
1.00
0.11
0.33
0.001
Group 1 + 3
Apus
0.98
0.10
0.31
0.001
Group 1 + 3
Sturnus cineraceus
0.86
0.11
0.31
0.025
Group 2 + 3
Eremophila alpestris
1.00
0.10
0.32
0.001
Here we included species with indicator value ≥ 0.3 and statistically significant (p < 0.05).
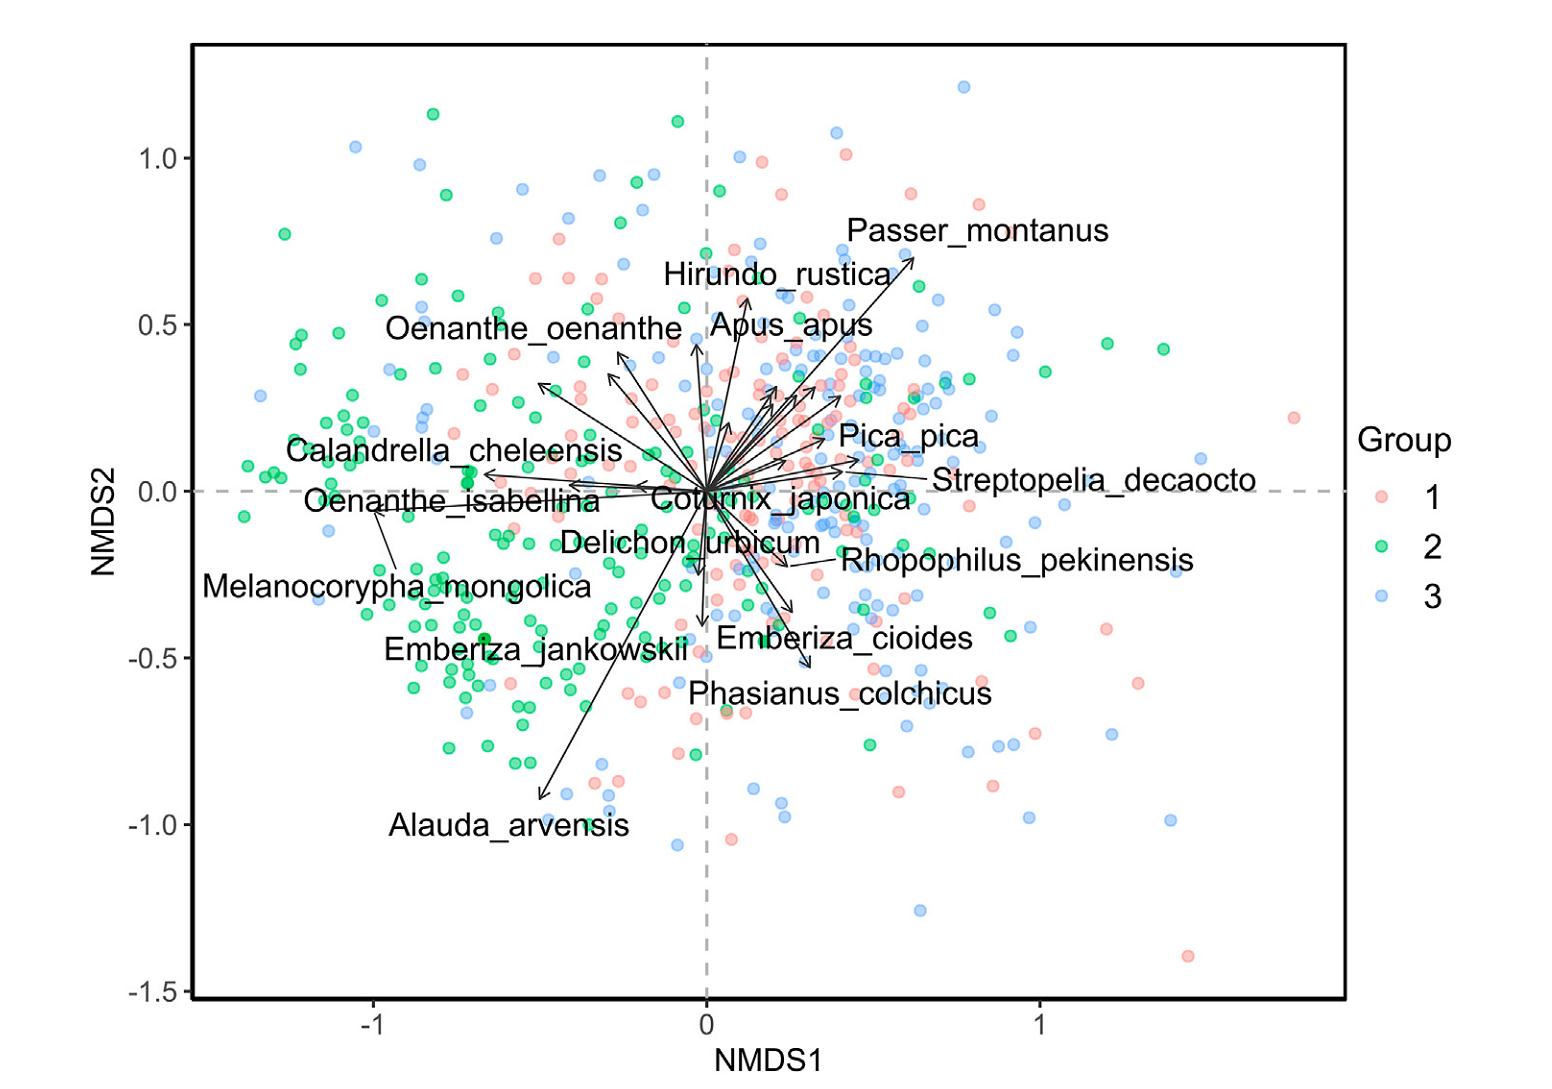
The NMDS ordination revealed a compositional difference not only along the first NMDS axis, but also between the three groups. Typical grassland specialists, such as Mongolian Lark and Eurasian Skylark, are closely linked with group 2, locating in the left section of the NMDS plot; whereas generalist birds that using mixed habitats, such as Eurasian Magpie and Tree Sparrow are more prevalent in group 1 or group 3, locating in the right part of the NMDS ordination plot (Fig. 3). The first NMDS axis thus may indicate the environmental gradient ranging from natural grasslands to heavily-disturbed landscapes next to anthropogenic settlements. Although the three groups overlapped substantially somewhere, the PERMANOVA confirmed highly significant differences among them (R2 = 0.32, F = 120.85, sig. p-value = 0.001). In addition, a clear separation between group 2 and group 1 + 3 is also depicted in Fig. 3.
Figure
3.
Ordination resulting from non-metric multidimensional scaling (NMDS) of the avian communities across the three groups. We only showed bird species that significantly respond to the two ordinations (p < 0.05).
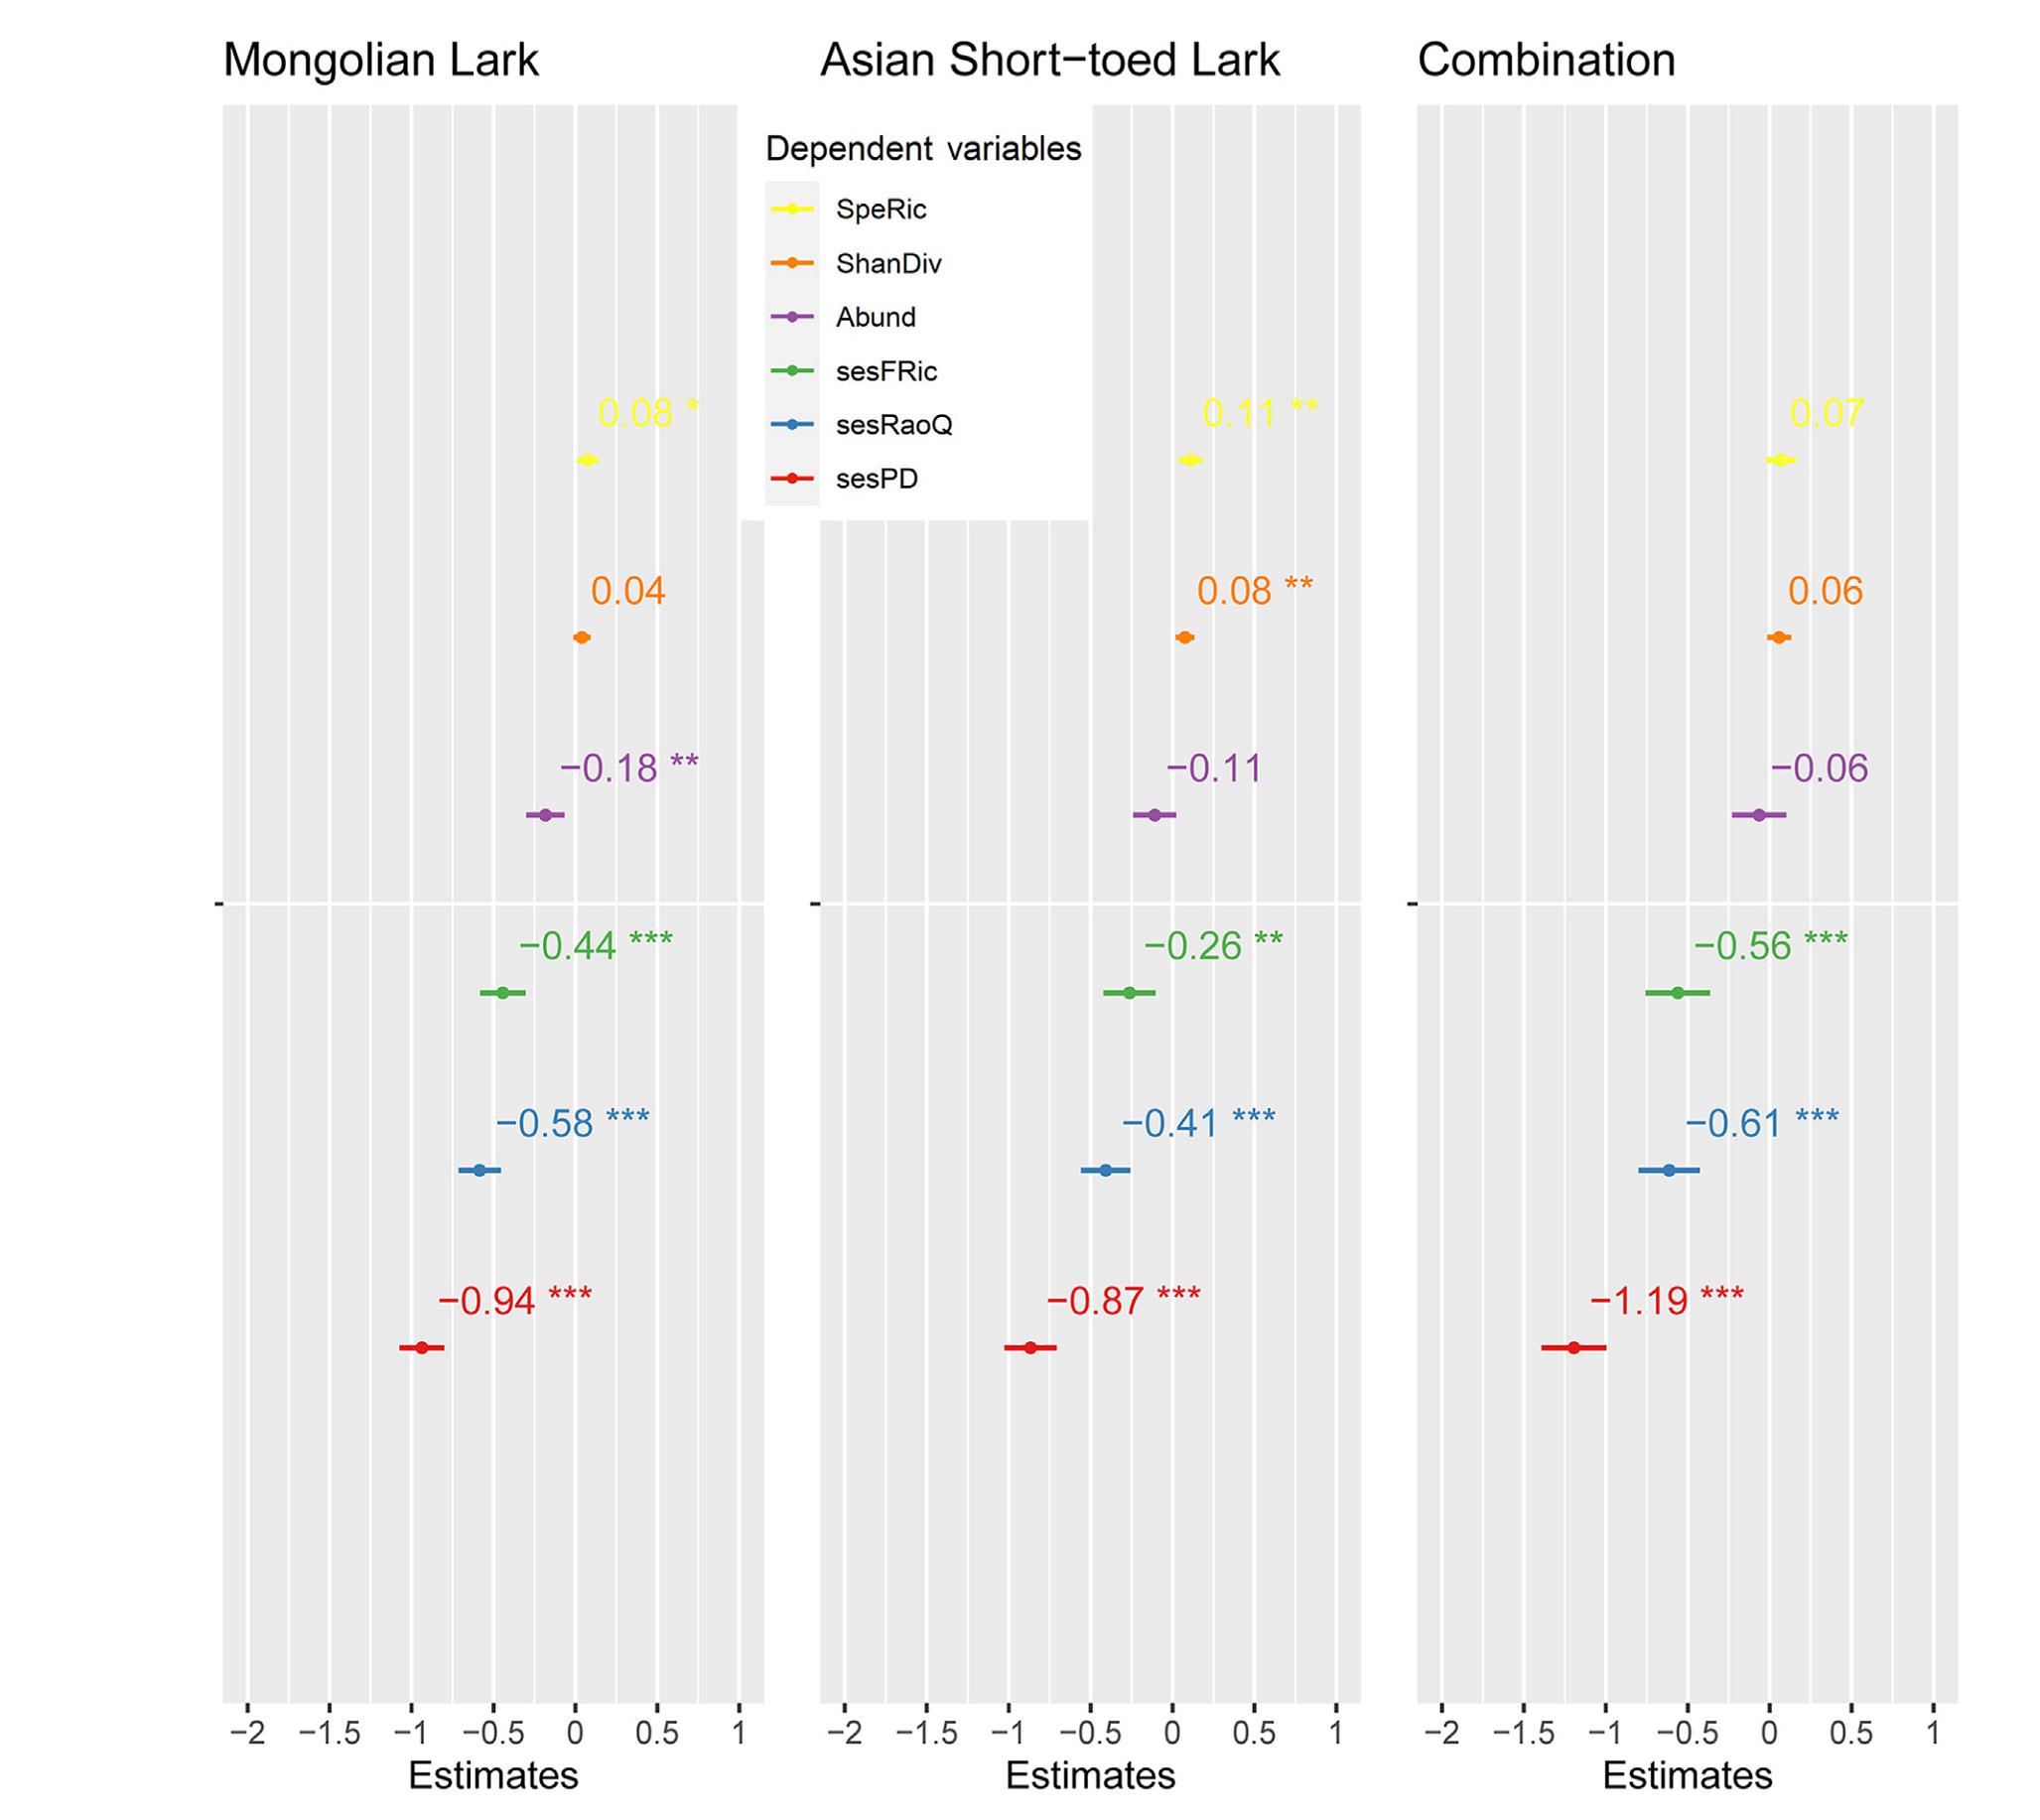
Mongolian Lark and Asian Short-toed Lark were identified as good indicator species for the site group 2 by the IndVal analysis (Table 1), thus, in addition to Mongolian Lark, we also examined whether the occurrence of Asian Short-toed Lark or joint (i.e., simultaneous) occurrence of these two species are highly predictive for the target biodiversity measures. We fitted 18 (6 × 3) individual linear models, where biodiversity measures (species richness, Shannon diversity, abundance, sesFRic, sesRaoQ and sesPD) are dependent variables, and the occurrence of Mongolian Lark, Asian Short-toed Lark, and their joint occurrence is covariate, respectively. The quantile-quantile (Q-Q) plots indicated all linear models fitting well for each of the six diversity measures (Appendix Fig. S2). The Mongolian Lark occurrence was positively correlated with overall bird species richness (slope = 0.08, p = 0.02, Fig. 4), indicating bird species richness always being higher in the sample sites where Mongolian Larks were present. This holds true for Shannon diversity, though the significance is much weaker (Fig. 4). The other four biodiversity measures, abundance, sesFRic, sesRaoQ and sesPD were negatively correlated with the occurrence of Mongolian Lark (Fig. 4).
Figure
4.
Regression coefficients with confidence intervals of multiple linear models. The six biodiversity measures are dependent variables, while the presence of Mongolian Lark, Asian Short-toed Lark and their joint presence are independent variables, respectively. Dots and numbers indicate the point estimates, the error bars indicate 95% confidence intervals. Significance level: ns: p > 0.05, *: p ≤ 0.05, **: p ≤ 0.01, ***: p ≤ 0.001, ****: p ≤ 0.0001.
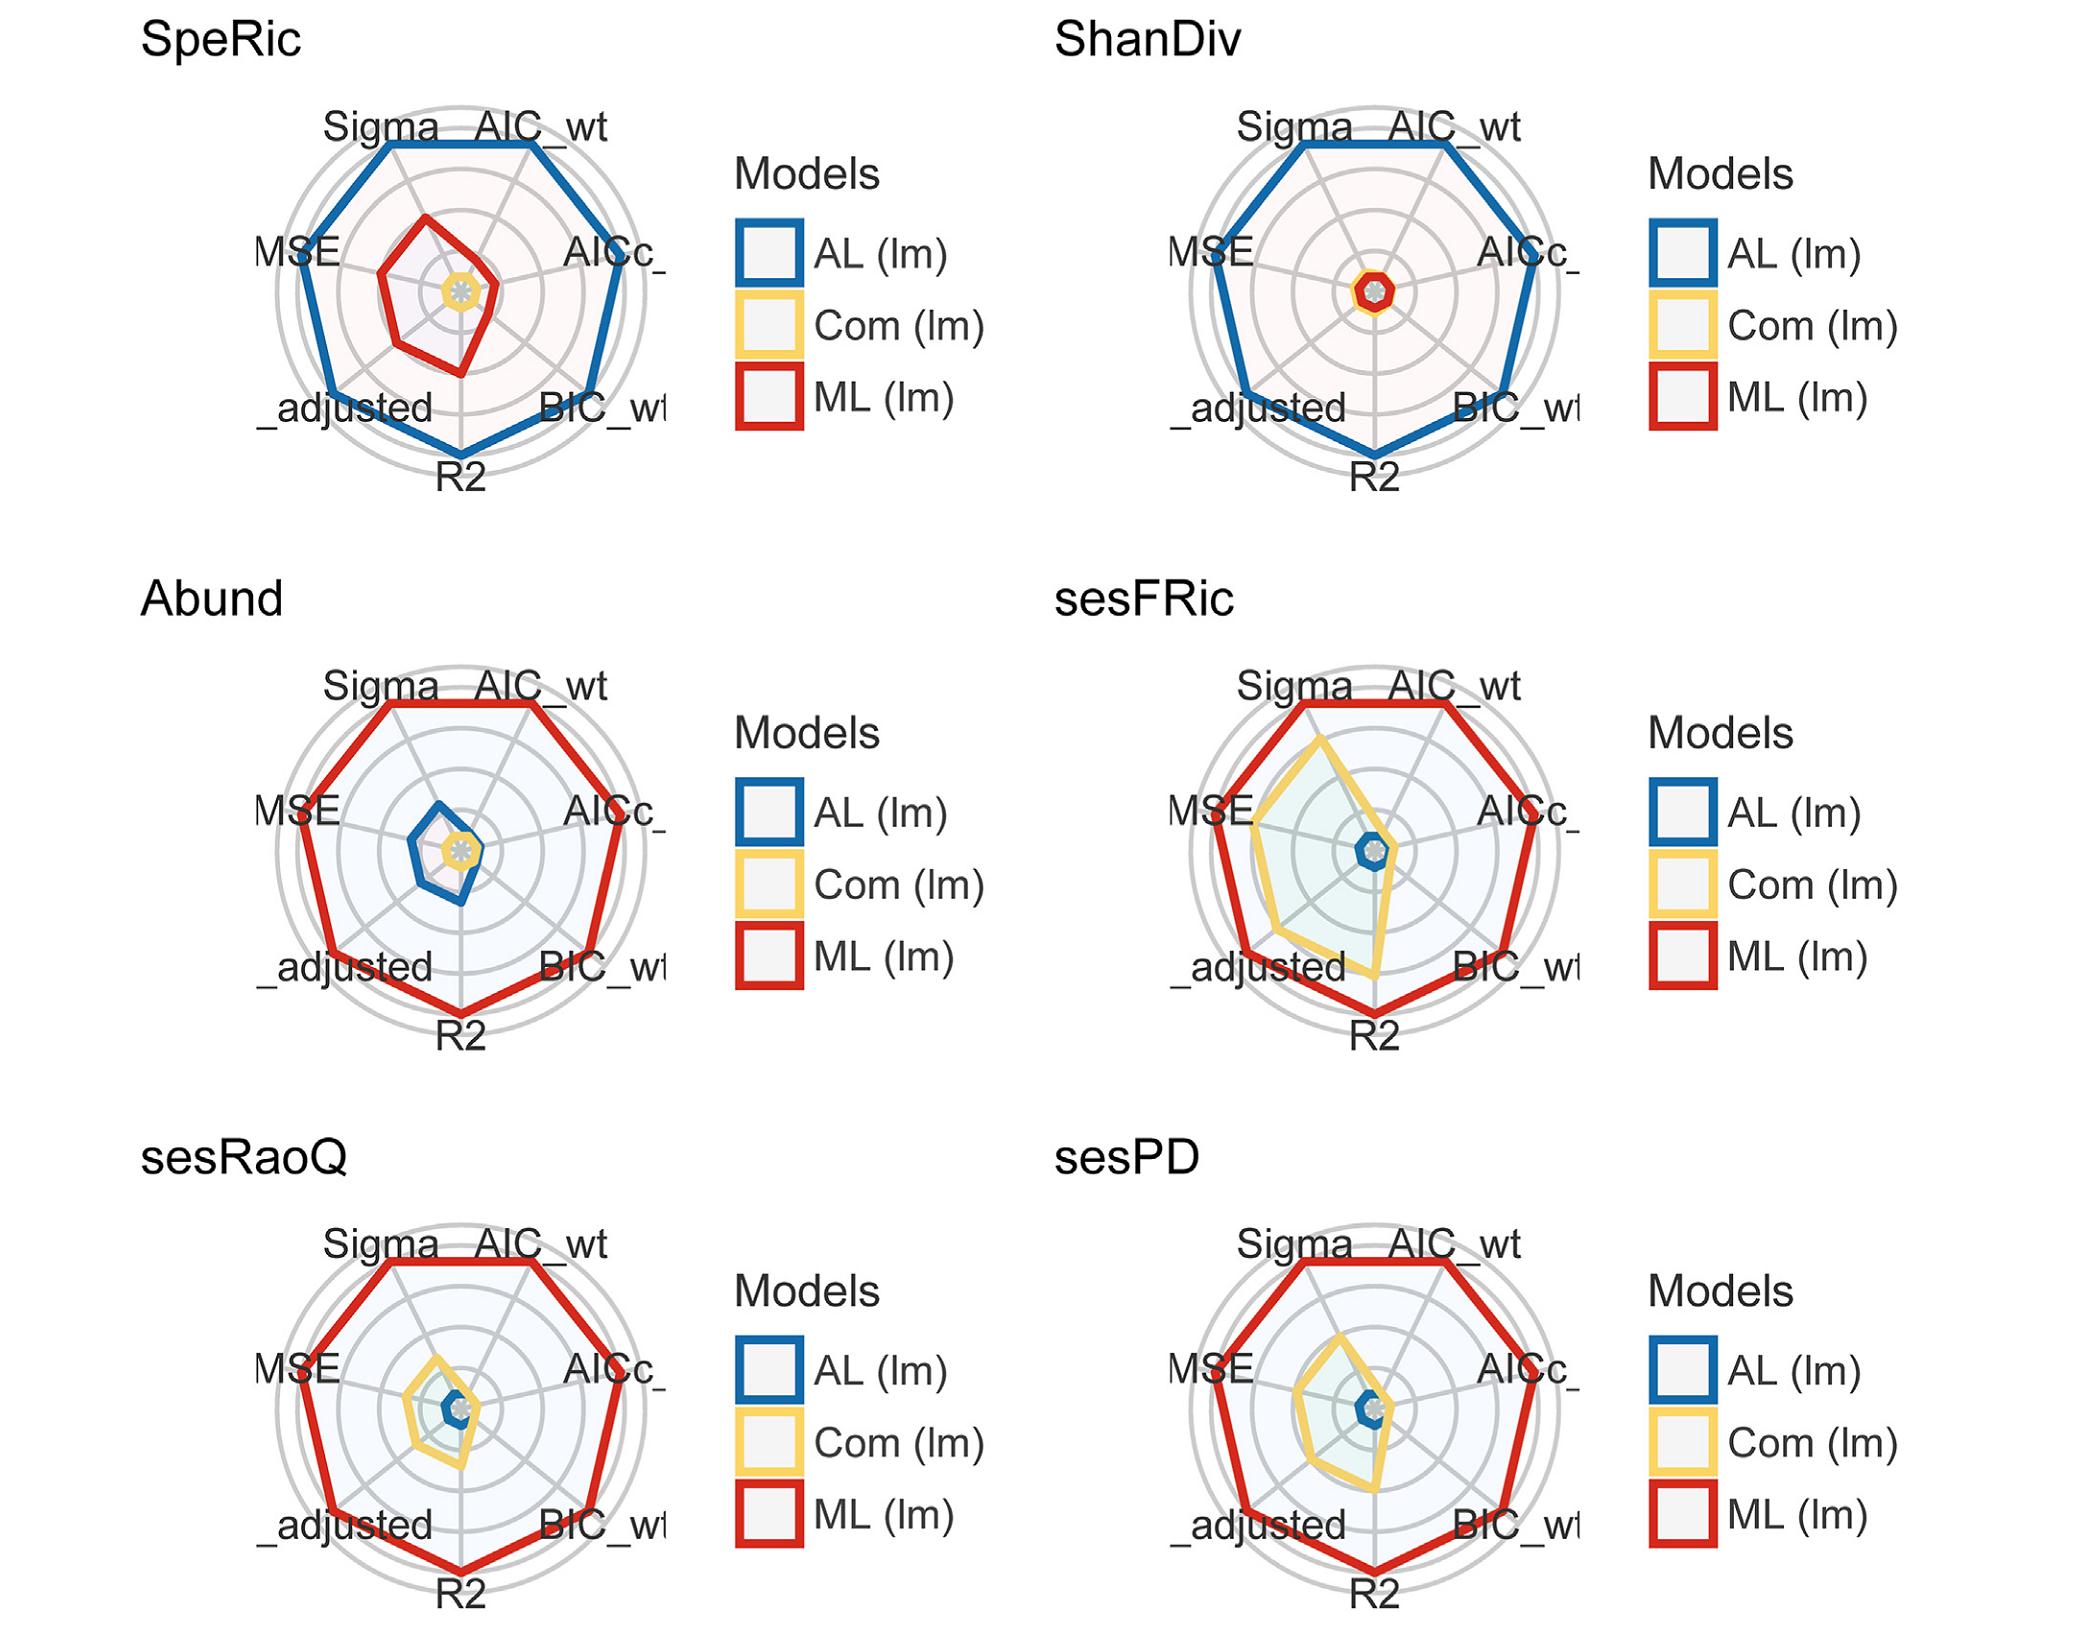
Asian Short-toed Lark and species combination showed similar response pattern, the occurrence of which are positively related with species richness and Shannon diversity, while negatively relating with the other four biodiversity measures (Fig. 4). The occurrence of Asian Short-toed Lark has a higher response (i.e., the absolute values of coefficients are larger) to species richness and Shannon diversity, while the response to phylogenetic or functional diversity is stronger for the joint occurrence than the two species taken account independently (Fig. 4). The performance of fitted models varied, with the highest performance being found in Asian Short-toed Lark occurrence when predicting species richness or Shannon diversity, while for abundance, functional or phylogenetic diversity, Mongolian Lark occurrence was a better predictor (Fig. 5; Appendix Table S1).
Figure
5.
Visualization of indices of models' performance fitted by linear models (lm), where the six biodiversity measures are dependent variables, and the presence of Mongolian Lark (ML), Asian Short-toed Lark (AL) and their combination (Com) are independent variables, respectively. AIC: Akaike's Information Criterion, AICc: Second-order (or small sample) AIC with a correction for small sample sizes, BIC: Bayesian Information Criterion, R2: r-squared value, R2_adj: adjusted r-squared, RMSE: root mean squared error, Sigma: residual standard deviation. The different indices are normalized and larger values indicate better model performance. Hence, points closer to the center indicate worse fit indices.
The identification of biodiversity indicator is one of the most important and challenging tasks in conservation ecology, especially in the face of limited data and available resources (Pearman and Weber, 2007). In the present study, we confirmed the hypothesis that Mongolian Lark can serve as an effective indicator for different components of avian biodiversity in Mongolian steppes. The occurrence of Mongolian Lark was closely associated with several other grassland specialists, and species richness was significantly higher at sites with Mongolian Larks. At the same time, the presence of Mongolian Lark also indicated sites with lower species abundance, functional richness, Rao's quadratic entropy and phylogenetic diversity. To our knowledge, this is the first study that investigated indicator species in grassland biomes in northeast Asia. Our results suggested Mongolian Lark can be likely used as shortcuts to help ensure good bird biodiversity measurements with minimal expenditures.
The Mongolian Lark presents higher statistics in the IndVal test, both the indicator value and the fidelity value were larger for this single species than for other birds (Table 1). In addition, this species is characterized by several traits that would make it a suitable indicator than others (Carrascal et al., 2012). For example, the highly distinctiveness of its appearance greatly enhanced its detectability, increased survey effectiveness for researchers; and the rarity of Mongolian Lark in public consciousness, make it a charismatic species to encourage people to volunteer for regional or national surveys under the umbrella of citizen science programs, which would be large benefits for conservation and ecological sciences (Jiguet et al., 2012).
We illustrated the indicative value of Mongolian Lark by considering different biodiversity components. First, the relationship between Mongolian Lark and bird species richness confirmed the positive co-occurrence pattern between this lark and other grassland-associated birds (Han et al., 2020). Second, Mongolian Lark is a negative predictor of species abundance, sesFRic, sesRaoQ and sesPD. FRic reflected the number of functional space (niches) occupied by a species community (Mouchet et al., 2010), and RaoQ measured the degree of functional dissimilarity among species in a community based on relative abundance, respectively (Botta-Dukát, 2005). The presence of the Mongolian Lark was largely associated with several other grassland specialists, they generally have similar habitat requirements (Han et al., 2020). Environmental filter or other mechanisms (e.g., dispersal limitation or local competition) may exclude other species that unable to survive or persist at a given locale (Cadotte and Tucker, 2017). Hence, the low FRic and RaoQ probably arise from the small differences in their niche or phenotypic attributes in the target bird community. Third, the increasing phylogeny relatedness among bird communities where Mongolian Larks exist may explain the strong negative relationship between its presence and phylogenetic diversity (Frishkoff et al., 2014). This is in consistent with previous researches that found higher clustering among closely related species than expected when studying the co-occurrence of species in flocks from a phylogenetic perspective (Gómez et al., 2010; Péron, 2017). Finally, our results confirmed the use of species richness may be insufficient for determining hotspots of biodiversity, and the variation of taxonomic, functional and phylogenetic diversity does not necessarily coincide (Rapacciuolo et al., 2019), consequently, the surrogacy power of species could differ depending on the measures of biodiversity considered (Sattler et al., 2014).
We also conducted a comparison to better understand whether it would be beneficial to consider species combinations (Mongolian Lark and Asian Short-toed Lark) rather than a single species as indicators. Though the response to phylogenetic or functional diversity is stronger (i.e., the absolute values of coefficients are larger) for the joint occurrence (Fig. 4), the adjusted R2 is always lower than the two species taken independently. One would expect species combinations should be most useful if the component species of the combination are common, have some preference for the site group and a low degree of correlation to each other (de Cáceres et al., 2012), yet it is not the case for Mongolian Lark and Asian Short-toed Lark, as they are maximally correlated and largely overlapped in their habitat niches. On the other hand, the Asian Short-toed Lark could act as an alternative or complementary indicator, owing to its predictive performance in species richness and Shannon diversity. In contrast, Barn Swallow and Eurasian Magpie are good candidate indicators for the group combination 1 + 3 (Table 1), which represent areas with higher sesFRic, sesRaoQ and sesPD (Fig. 2), probably because these two species' habitat preference is similarly to many other generalist species (e.g., Tree Sparrow, Eurasian Collared Dove and Common Swift) in these environments.
5.
Conclusion
Given the main criteria as a good surrogate (balance between robustness, communicability, accuracy, generality, cost-effectiveness and good transferability of the surrogacy) (Fleishman et al., 2000; Lindenmayer et al., 2015), in the light of our findings, Mongolian Lark should reasonably constitute a useful indicator or surrogate of avian diversity in northeast Inner Mongolia. The utility of Mongolian Lark as an indicator would be largely beneficial for identifying conservation target areas, also for designing reserves and ecological networks. However, the Mongolian Lark, as any other potential candidate, will certainly not be used as a Holy Grail of biodiversity conservation, mainly due to the high complexity in ecological systems (Morelli and Tryjanowski, 2016). Conservation planners should preferentially use more detailed information on the whole assemblage of grassland birds whenever possible. Moreover, the presence of spatial mismatch among avian biodiversity components highlighted the value of considering taxonomic, functional, and evolutionary measures simultaneously for a better spatial prioritization in conservation planning.
Authors' contributions
ZH and HTW conceived and designed the study. ZH, XY and XQZ conducted the field survey. ZH and XY wrote the first version of the manuscript. All authors read and approved the final manuscript.
Competing interests
The authors declare that they have no competing interests.
Ethics statement
Not applicable.
Acknowledgements
We thank Lishi Zhang, Jiyuan Yao, Guiquan Xiang and local residents for their help in field survey. We also thank two anonymous reviewers for their helpful comments.
Adams, D.M., Wilkinson, G.S., 2020. Male condition and group heterogeneity predict extra-group paternity in a Neotropical bat. Behav. Ecol. Sociobiol. 74, 136–147.
Akcay, E., Roughgarden, J., 2007. Extra-pair paternity in birds: review of the genetic benefits. Evol. Ecol. Res. 9, 855–868.
Ashton, K.G., 2002. Patterns of within-species body size variation of birds: strong evidence for Bergmann's rule. Global Ecol. Biogeogr. 11, 505–523.
Balenger, S.L., Scott Johnson, L., Mays Jr., H.L., Masters, B.S., 2009. Extra-pair paternity in the socially monogamous mountain bluebird Sialia currucoides and its effect on the potential for sexual selection. J. Avian Biol. 40, 173–180.
Bates, D., Mächler, M., Bolker, B., Walker, S., 2014. Fitting linear mixed-effects models using lme4. J. Stat. Software 67, 1–48. .
Beltrão, P., Godinho, C., Lourenço, R., Pereira, P.F., 2021. Behavioural repeatability in Sardinian warblers (Sylvia melanocephala): larger individuals are more aggressive. Acta Ethol. 24, 31–40.
Benítez Saldívar, M.J., Miño, C.I., Massoni, V., 2022. Extra-pair paternity in the Saffron Finch is related to song peak frequency and body condition. Emu 122, 226–237.
Blums, P., Nichols, J.D., Hines, J.E., Lindberg, M.S., Mednis, A., 2005. Individual quality, survival variation and patterns of phenotypic selection on body condition and timing of nesting in birds. Oecologia 143, 365–376.
Bouwman, K.M., Dijk, R.E.V., Wijmenga, J.J., Komdeur, J., 2007. Older male reed buntings are more successful at gaining extrapair fertilizations. Anim. Behav. 73, 15–27.
Bouwman, K.M., Komdeur, J., 2005. Old female reed buntings (Emberiza schoeniclus) increase extra-pair paternity in their broods when mated to young males. Behaviour 142, 1449–1463.
Brooks, R., Kemp, D.J., 2001. Can older males deliver the good genes? Trends Ecol. Evol. 16, 308–313.
Bustnes, J.O., Erikstad, K.E., Bjørn, T.H., 2002. Body condition and brood abandonment in common eiders breeding in the high Arctic. Waterbirds 25, 63–66.
Canal, D., Jovani, R., Potti, J., 2012. Male decisions or female accessibility? Spatiotemporal patterns of extra pair paternity in a songbird. Behav. Ecol. 23, 1146–1153.
Charmantier, A., Blondel, J., Perret, P., Lambrechts, M.M., 2004. Do extra-pair paternities provide genetic benefits for female blue tits Parus caeruleus? J. Avian Biol. 35, 524–532.
Chen, L.J., 2016. Sexual Dimorphism, Assortative Mating, Parental Investment and Nest Survival of Chestnut Thrush (Turdus rubrocanus). Doctoral Thesis. University of Chinese Academy of Sciences, Beijing.
Cichoñ, M., 2003. Does prior breeding experience improve reproductive success in collared flycatcher females? Oecologia 134, 78–81. .
Costanzo, A., Ambrosini, R., Caprioli, M., Gatti, E., Parolini, M., Romano, A., et al., 2017. Extrapair fertilizations vary with female traits and pair composition, besides male attractiveness, in barn swallows. Anim. Behav. 134, 183–191.
Dakin, E., Avise, J., 2004. Microsatellite null alleles in parentage analysis. Heredity 93, 504–509.
Dearborn, D.C., 2001. Body condition and retaliation in the parental effort decisions of incubating great frigatebirds (Fregata minor). Behav. Ecol. 12, 200–206. .
Desrosiers, M., Langin, K., Funk, W.C., Sillett, T., Morrison, S., Ghalambor, C., et al., 2021. Body size is associated with yearling breeding and extra-pair mating in the Island Scrub-Jay. Ornithology 138, ukab045. .
Ferretti, V., Massoni, V., Bulit, F., Lovette, I.J., 2018. Ecological opportunities and individual condition as predictors of extra-pair paternity in a south-temperate swallow (Tachycineta leucorrhoa). J. Field Ornithol. 89, 221–233. .
Funghi, C., Leitão, A.V., Ferreira, A.C., Mota, P.G., Cardoso, G.C., 2015. Social dominance in a gregarious bird is related to body size but not to standard personality assays. Ethology 121, 84–93.
Gleeson, D.J., Blows, M.W., Owens, I.P., 2005. Genetic covariance between indices of body condition and immunocompetence in a passerine bird. BMC Evol. Biol. 5, 1–9.
Griffith, S.C., Owens, I.P.F., Thuman, K.A., 2002. Extra pair paternity in birds: a review of interspecific variation and adaptive function. Mol. Ecol. 11, 2195–2212.
Hall, M.L., Kingma, S.A., Peters, A., 2013. Male songbird indicates body size with low-pitched advertising songs. PLoS One 8, e56717.
Hochachka, W., Smith, J.N., 1991. Determinants and consequences of nestling condition in song sparrows. J. Anim. Ecol. 60, 995–1008.
Hsu, Y.-H., Schroeder, J., Winney, I., Burke, T., 2015. Are extra-pair males different from cuckolded males? A case study and a meta-analytic examination. Mol. Ecol. 24, 1558–1571.
Hughes, J.M., Mather, P.B., Toon, A., Ma, J., Rowley, I., Russell, E., 2003. High levels of extra-group paternity in a population of Australian magpies Gymnorhina tibicen: evidence from microsatellite analysis. Mol. Ecol. 12, 3441–3450. .
Kalinowski, S.T., Taper, M.L., Marshall, T.C., 2007. Revising how the computer program CERVUS accommodates genotyping error increases success in paternity assignment. Mol. Ecol. 16, 1099–1106. .
Kempenaers, B., Verheyen, G.R., den Broeck, M.V., Burke, T., Broeckhoven, C.V., Dhondt, A., 1992. Extra-pair paternity results from female preference for high-quality males in the blue tit. Nature 357, 494–496.
Kleven, O., Fiske, A.N., Håvik, M., Kroglund, R.T., Østnes, J.E., Schmoll, T., 2019. Extra-pair paternity and sperm length variation in the socially monogamous Fieldfare Turdus pilaris. J. Ornithol. 160, 1043–1051. .
Li, J., Lv, L., Wang, P., Zhang, Z., Wang, Y., 2015. Roles of phenotypic and genetic characteristics in the social mating pattern of Silver-throated Tits (Aegithalos glaucogularis). J. Ornithol. 156, 687–697. .
Lou, Y.Q., Chen, L.J., Zhao, Q.S., Møller, A.P., Fang, Y., Sun, Y., 2022. Sexual dichromatism and assortative mating by multiple plumage color traits in wild Chestnut Thrush. Avian Res. 13, 100033.
Lundberg, A., Gottlander, K., Alatalo, R.V., 1987. Extra-pair copulations and mate guarding in the polyterritorial pied flycatcher, Ficedula hypoleuca. Behaviour 101, 139–154.
Mayer, C., Pasinelli, G., 2013. New support for an old hypothesis: density affects extra-pair paternity. Ecol. Evol. 3, 694–705. .
McCarty, J.P., 2001. Variation in growth of nestling tree swallows across multiple temporal and spatial scales. Auk 118, 176–190.
Merom, K., Mccleery, R., Yom-Tov, Y., 1999. Age-related changes in wing-length and body mass in the Reed Warbler Acrocephalus scirpaceus and Clamorous Reed Warbler A. stentoreus. Hous. Theor. Soc. 46, 249–255.
Michaud, T., Leonard, M., 2000. The role of development, parental behavior, and nestmate competition in fledging of nestling tree swallows. Auk 117, 996–1002.
Milenkaya, O., Catlin, D.H., Legge, S., Walters, J.R., 2015. Body condition indices predict reproductive success but not survival in a sedentary, tropical bird. PLoS One 10, e0136582.
Møller, A.P., 1987. Mate guarding in the swallow Hirundo rustica. Behav. Ecol. Sociobiol. 21, 119–123.
Møller, A.P., 1988. Female choice selects for male sexual tail ornaments in the monogamous swallow. Nature 332, 640–642. .
Møller, A.P., Ninni, P., 1998. Sperm competition and sexual selection: a meta-analysis of paternity studies of birds. Behav. Ecol. Sociobiol. 43, 345–358.
Morton, E.S., Forman, L., Braun, M., 1990. Extrapair fertilizations and the evolution of colonial breeding in purple martins. Auk 107, 275–283.
Nagy, L.R., Stanculescu, D., Holmes, R.T., 2007. Mass loss by breeding female songbirds: food supplementation supports energetic stress hypothesis in black-throated blue warblers. Condor 109, 304–311.
Norberg, R.A., 1981. Temporary weight decrease in breeding birds may result in more fledged young. Am. Nat. 118, 838–850.
Nyström, K.K., 1997. Food density, song rate, and body condition in territory-establishing willow warblers (Phylloscopus trochilus). Can. J. Zool. 75, 47–58.
O'Brien, E.L., Dawson, R.D., 2007. Context-dependent genetic benefits of extra-pair mate choice in a socially monogamous passerine. Behav. Ecol. Sociobiol. 61, 775–782.
Peig, J., Green, A.J., 2010. The paradigm of body condition: a critical reappraisal of current methods based on mass and length. Funct. Ecol. 24, 1323–1332.
Pereira, P.F., Lourenço, R., Mota, P.G., 2018. Behavioural dominance of the invasive red-billed leiothrix (Leiothrix lutea) over European native passerine-birds in a feeding context. Behaviour 155, 55–67.
Plaza, M., Cantarero, A., Gil, D., Moreno, J., 2019. Experimentally flight-impaired females show higher levels of extra-pair paternity in the pied flycatcher Ficedula hypoleuca. Biol. Lett. 15, 20190360.
R Core Team, 2022. R: A Language and Environment for Statistical Computing. R Foundation for Statistical Computing, Vienna, Austria. .
Raymond, M., Rousset, F., 1995. GENEPOP (Version 1.2): Population genetics software for exact tests and ecumenicism. J. Hered. 86, 248–249. .
Rousset, F., 2008. genepop'007: a complete re-implementation of the genepop software for Windows and Linux. Mol. Ecol. Resour. 8, 103–106. .
Rowe, K.M.C., Weatherhead, P.J., 2007. Social and ecological factors affecting paternity allocation in American robins with overlapping broods. Behav. Ecol. Sociobiol. 61, 1283–1291.
Saladin, V., Ritschard, M., Roulin, A., Bize, P., Richner, H., 2007. Analysis of genetic parentage in the tawny owl (Strix aluco) reveals extra-pair paternity is low. J. Ornithol. 148, 113–116.
Schmoll, T., Dietrich, V., Winkel, W., Epplen, J.T., Schurr, F., Lubjuhn, T., 2005. Paternal genetic effects on offspring fitness are context dependent: within the extrapair mating system of a socially monogamous passerine. Evolution 59, 645–657.
Simeoni, M., Dawson, D.A., Gentle, L.K., Coiffait, L., Wolff, K., Evans, K.L., et al., 2009. Characterization of 38 microsatellite loci in the European blackbird, Turdus merula (Turdidae, AVES). Mol. Ecol. Resour. 9, 1520–1526.
Stutchbury, B., Morton, E., 1995. The effect of breeding synchrony on extra-pair mating systems in songbirds. Behaviour 132, 675–690.
Sun, Y.H., Swenson, J.E., Yun, F., Klaus, S., Scherzinger, W., 2003. Population ecology of the Chinese grouse, Bonasa sewerzowi, in a fragmented landscape. Biol. Conserv. 110, 177–184.
Videler, J.J., 2006. Avian Flight. Oxford University Press, Oxford.
Villa, S.M., Evans, M., Subhani, Y.K., Altuna, J.C., Bush, S.E., Clayton, D.H., 2018. Body size and fecundity are correlated in feather lice (Phthiraptera: Ischnocera): implications for Harrison’s rule. Ecol. Entomol. 43, 394–396.
Wang, J., Liu, J., Zhang, Z., Ren, H., Gao, L., Hou, J., 2019. Is male condition corrected with song features in Dusky Warblers (Phylloscopus fuscatus). Avian Res 10, 18.
Wang, J., Wei, Y., Zhang, L., Jiang, Y., Li, K., Wan, D., 2021. High level of extra-pair paternity in the socially monogamous Marsh Tits (Poecile palustris). Avian Res. 12, 69.
Westneat, D.F., 1990. The ecology and evolution of extra-pair copulations in birds. Curr. Ornithol. 7, 331–369.
Westneat, D.F., Stewart, I.R.K., 2003. Extra-pair paternity in birds: causes, correlates, and conflict. Annu. Rev. Ecol. Evol. Syst. 34, 365–396.
Whittingham, L.A., Dunn, P.O., 2010. Fitness benefits of polyandry for experienced females. Mol. Ecol. 19, 2328–2335. .
Wilk, T., Cichoń, M., Wolff, K., 2008. Lack of evidence for improved immune response of extra-pair nestlings in collared flycatcher Ficedula albicollis. J. Avian Biol. 39, 546–552.
Williams, T.D., 2018. Physiology, activity and costs of parental care in birds. J. Exp. Biol. 221, jeb169433. .
Yezerinac, S.M., Weatherhead, P.J., 1997. Extra-pair mating, male plumage coloration and sexual selection in yellow warblers (Dendroica petechia). Proc. R. Soc. B 264, 527–532.

 DownLoad:


 Email Alerts
 RSS Feeds