Guangyao Wang, Jinming Zhao, Weiqiang Li, Xiangrong Song, Yong Zhang, Chunlin Li, Willem F. de Boer. 2023: Responses of breeding waterbird communities to environmental changes in subsidence wetlands in the North China Plain. Avian Research, 14(1): 100110. DOI: 10.1016/j.avrs.2023.100110
Citation:
Guangyao Wang, Jinming Zhao, Weiqiang Li, Xiangrong Song, Yong Zhang, Chunlin Li, Willem F. de Boer. 2023: Responses of breeding waterbird communities to environmental changes in subsidence wetlands in the North China Plain. Avian Research, 14(1): 100110. DOI: 10.1016/j.avrs.2023.100110
Guangyao Wang, Jinming Zhao, Weiqiang Li, Xiangrong Song, Yong Zhang, Chunlin Li, Willem F. de Boer. 2023: Responses of breeding waterbird communities to environmental changes in subsidence wetlands in the North China Plain. Avian Research, 14(1): 100110. DOI: 10.1016/j.avrs.2023.100110
Citation:
Guangyao Wang, Jinming Zhao, Weiqiang Li, Xiangrong Song, Yong Zhang, Chunlin Li, Willem F. de Boer. 2023: Responses of breeding waterbird communities to environmental changes in subsidence wetlands in the North China Plain. Avian Research, 14(1): 100110. DOI: 10.1016/j.avrs.2023.100110
School of Resources and Environmental Engineering, Anhui University, Hefei, 230601, China
b.
School of Life Science, Huaibei Normal University, Huaibei, 235000, China
c.
College of Biology and the Environment, Nanjing Forestry University, Nanjing, 210037, China
d.
Anhui Province Key Laboratory of Wetland Ecosystem Protection and Restoration, Anhui University, Hefei, 230601, China
e.
Wildlife Ecology and Conservation Group, Wageningen University & Research, 6708PB, Wageningen, the Netherlands
Funds: This work was supported by the National Natural Science Foundation of China (grant 31970500 and 31770571), the Excellent Youth Project of the Anhui Natural Science Foundation (grant 2108085Y09). The funders have no role in study design, data collection and analysis, decision to publish, or preparation of the manuscript
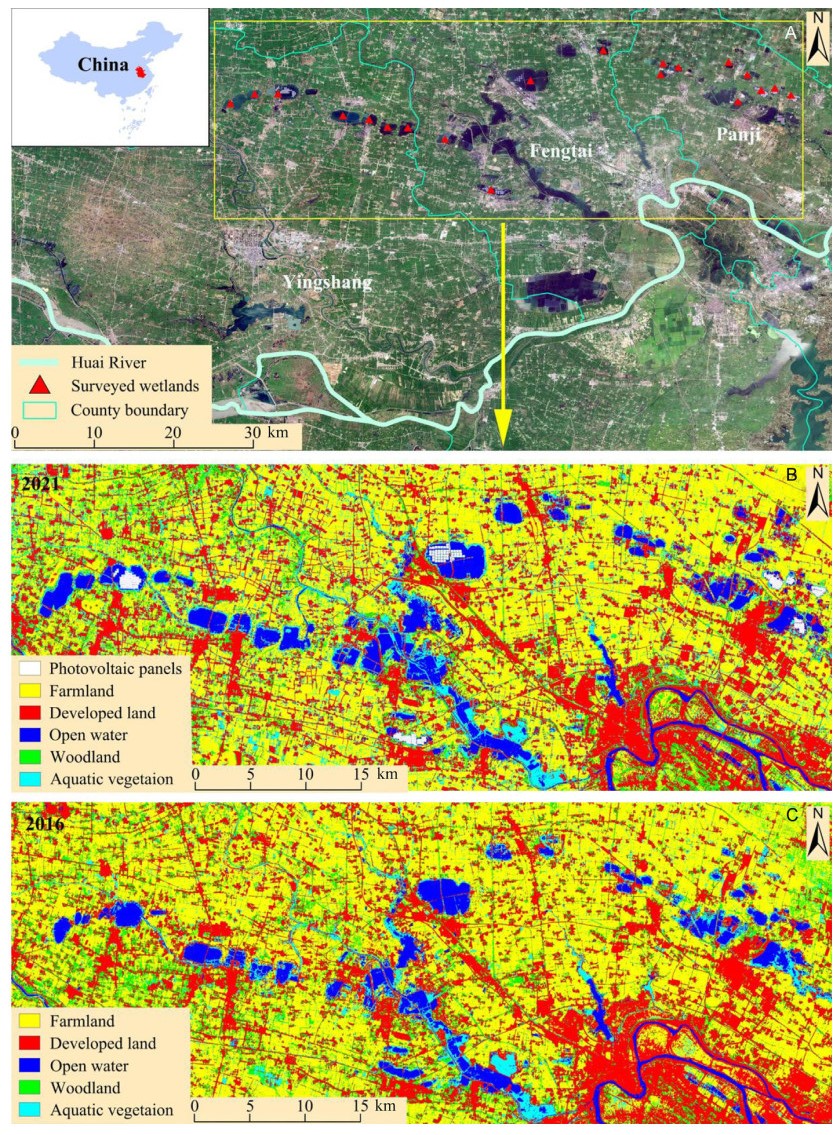
In the context of global degradation and loss of natural wetlands, waterbirds have been increasingly using artificial wetlands as alternative habitats. However, waterbirds are facing various threats in these artificial wetlands, due to dramatic environmental changes induced by anthropogenic activities. Exploring the effects of these changes on the temporal dynamics of the waterbird communities can help understand how waterbirds adapt to environmental changes and thus formulate effective management and conservation plans. In this study, we carried out field surveys on waterbirds and environmental factors across 20 subsidence wetlands created by underground coal mining in the Huainan coal mining area in the breeding seasons of 2016 and 2021. We predicted that the waterbird assemblages (i.e., number of individuals, species richness, Shannon–Wiener diversity, Pielou evenness and species composition) differed between the two years, and that these differences were correlated with the temporal changes in environmental factors. Across the surveyed wetlands, we recorded 26 waterbird species in 2016 and 23 in 2021. For individual wetlands, the number of waterbird individuals and species richness increased by 71.6% and 20.1%, respectively, over the five years, with no changes in Shannon–Wiener diversity and Pielou evenness. The overall increase in the number of bird individuals was mainly caused by an increase in vegetation gleaners and gulls that adapt well to anthropogenic activities. The species composition was significantly different between the two years, which was mainly caused by changes in the number of individuals of dominant species under influence of changes in human activities. For most wetlands, the temporal pairwise β-diversities could be explained by species turnover rather than nestedness, probably due to high mobility of waterbird species and dramatic changes in local environments. Our study suggests that waterbird communities could respond to environmental changes in subsidence wetlands, providing important implications for waterbird conservation in human-dominated artificial wetlands.
Scavengers are critical to the flow of matter and energy in ecosystems. Despite being one of the taxa most threatened by human activities (Sebastián-González et al., 2020), scavengers are fundamental to many ecological processes and provide numerous cultural benefits (O'Bryan et al., 2018; García-Jiménez et al., 2022). Protecting avian scavengers is one of the keys to conserving the ecological processes in which they are involved. Moreover, from a biological point of view, scavengers are species of great interest, especially large necrophagous raptors. The morphology of large scavengers allows them to use thermal currents and wind to reduce their energy expenditure while covering large areas of the territory (Ruxton and Houston, 2004). Furthermore, avian scavengers are usually colonial, which makes intra- and inter-specific communication and social hierarchy during carrion exploitation highly relevant, as well as social hierarchy during carrion exploitation (Svanbäck and Bolnick, 2005; Bosè et al., 2012; Moreno-Opo et al., 2020). Therefore, a comprehensive knowledge of large soaring-gliding scavengers is particularly interesting, but also necessary for the development of holistic ecosystem management plans.
The Cinereous Vulture extends its range from Iberia to Asia, being the largest raptor in Europe (Cramp and Simmons, 1980). In Spain, 43 colonies and 2500 breeding pairs have been estimated (~20% of the individuals worldwide). After a dramatic population decline in this country, the species is now considered ‘Not Threatened’ thanks to the stabilization of its traditional populations and several re-introduction projects (del Moral, 2017). The Iberian population is considered mainly resident based on field observations, but some juveniles seldom migrate to western Africa (Ramírez et al., 2022); by contrast, Cinereous Vulture breeding throughout the Caucasian region and Mongolia often show migratory behaviour (Kim et al., 2007; Gavashelishvili et al., 2012; Yamaç and Bilgin, 2012; Kang et al., 2019). In the last decades, the species has been broadly studied in Iberia regarding poisoning and anthropic impacts (Morán-López et al., 2006; Hernández and Margalida, 2008; Moreno-Opo et al., 2010, 2013; Iglesias-Merchán et al., 2016; Arrondo et al., 2021), breeding ecology (Moreno-Opo et al., 2013), habitat selection (Carrete and Donázar, 2005), feeding habits (Costillo et al., 2007), or movements in relation to protected areas and administrative boundaries (Morales-Reyes et al., 2016; Arrondo et al., 2018). In contrast, some aspects of the spatial ecology of the species in Iberia remain unknown: seasonal patterns, sex and age behavioural differences, natal dispersal, etc. Comprehensive studies based on GPS telemetry, including different colonies, should explore some of these topics.
One of the most important issues is how season and breeding influence the spatial behaviour of the species. The Cinereous Vulture has a lengthy reproductive period: incubation takes place from February to April, and chick-rearing from May to August (Hiraldo, 1983; Hernández and Margalida, 2008). Both sexes incubate the eggs (usually only one egg), and are involved in the nestlings’ care and feeding (Donázar, 1993; Hiraldo, 1983; Tewes, 1996). It has been proved that the energy expenditure and parental effort shift throughout the breeding season in territorial prey-hunting raptors with sex specialization (i.e., López-López et al., 2021). Similarly, other large scavengers such as the Griffon Vulture (Gyps fulvus) travelled larger distances over bigger areas during spring and summer (Morant et al., 2023). Therefore, the combination of seasonal environmental conditions and breeding constraints may be one of the keys to understand the spatial behaviour of raptors, particularly large scavengers, which are highly dependent on environmental conditions for successful flight (Ruxton and Houston, 2004).
Another significant aspect of the spatial ecology of the species is the natal dispersal and philopatric patterns, which refer to the location of birds' breeding area relative to their natal nest (Newton, 2010). This issue is fundamental to understanding population dynamics, largely determining species' distribution and potential expansion (Becker and Bradley, 2007). There is great diversity in the philopatric patterns within Iberian raptors. For example, the Red Kite (Milvus milvus) is characterised by high philopatry, so most individuals, after two or three years of juvenile dispersal, return to their origin region, settling a few tens of kilometres from their natal nest (García-Macía et al., 2022b). The case of the Bonelli's Eagle (Aquila fasciata) is the opposite. There is a source-sink system among the different Iberian sub-populations, so sub-adults from one sub-population seldom return to their native region, but they become part of other sub-populations, often hundreds of kilometres away (Cadahía et al., 2009; Hernández-Matías et al., 2010). This allowed some stable sub-populations to act as a source of individuals for other declining sub-populations, which act as a sink. Consequently, patterns of philopatry/natal dispersal are fundamental to understanding the recruitment of new individuals in the different populations, and also the species' potential to colonise new territories. In the case of the Cinereous Vulture, the species have been restricted to some regions in Spain for many decades and several re-introduction projects have been carried out (Del Moral, 2017), so it is fundamental to study the natal dispersal of the species in order to understand sub-population trends and potential for expanding its distribution area.
In this study, 17 Cinereous Vultures were GPS-tracked in order to study the spatial ecology during the adult phase. Consequently, the objectives of the study were: (1) to calculate some movement-related variables, such as the monthly home range size (95 and 50% fixed kernels) and accumulated distances; (2) to explore seasonal differences, considering three periods (incubation, chick-rearing, and non-breeding), in order to determine the variability of those movement-related variables throughout the annual cycle; and (3) to study philopatric behaviour (or natal dispersal), that is, the distance between the natal nest and the first breeding area of the individuals.
2.
Materials and methods
2.1
Tagging and data selection
Seventeen adult Cinereous Vultures were GPS-tagged in different regions in Spain from 2002 to 2020. Individuals provided data for 2.5 ± 1.7 years (mean ± SD), in the range of 0.5–5 years (Table 1).
Table
1.
Metadata of the 17 adult Cinereous Vultures (Aegypius monachus) tracked in this study. Tagging age, region, analysed period and transmitter model are shown. A hyphen (−) indicates unavailable information.
Six vultures were GPS-tagged as nestlings, unable to fly freely, but still able to be caught by hand. Eleven individuals were captured as adults (>5 years old) using a dho-gaza net after been attracted with carrion. All individuals were ringed, weighed and measured, and a blood sample was taken from nine individuals for molecular sexing (Ellegren, 1996). A GPS transmitter was attached to the back of each individual by a back-pack harness tied with Tefflon ribbon (Garcelon, 1985; García et al., 2021). The weight of all transmitters was less than 3% of the birds’ weight, thus complying with the recommended range (Bodey et al., 2018). Different transmitter models were attached to the individuals: Microwave PTT-100 70-g Solar Argos/GPS MTI (Microwave Telemetry Inc., Columbia, Maryland, USA; n = 8), Microwave 45 g GPS-GSM-GPRS (Microwave Telemetry Inc., Columbia, Maryland, USA; n = 1), OrniTrack-50 solar-powered GPS-GSM tracker (Ornitela, Vilnius, Lithuania; n = 1), and E-obs Solar 48 g GPS-GSM-GPRS (E-Obs GMBH, Gruenwald, Germany; n = 7). Biologgers provided GPS fixes every 5 min to 2 h from dawn to dusk during the entire year. Some transmitters provided locations 24 h a day during some periods, but night locations were excluded. Locations were filtered at a homogeneous frequency to avoid bias in subsequent calculations: 2-h frequency to estimate monthly home range sizes (all individuals, n = 17) and 30-min frequency to estimate travelled distances (n = 8). Locations were transformed to UTM coordinates (WGS 84, EPSG: 32630).
Therefore, both adults and juveniles were tagged, and different data were used according to the topic of the analysis. On the one hand, in order to explore seasonal differences and the influence of the breeding period in the spatial ecology, data were selected since individuals were 5 years old at least (n = 17), the most common age of first breeding in the Cinereous Vulture (Cramp and Simmons, 1980). Successful breeding was not confirmed by field observations in all cases, but only in three individuals. However, the rest of the individuals show similar movement patterns to those of the observed ones (permanence in a constrained area during the incubation months) and thus suggesting breeding behaviour. Therefore, we included all individuals in a general pool. On the other hand, in order to study philopatric behaviour, only the six individuals tagged as nestlings were considered.
2.2
Calculation of movement-related variables
Distances travelled, home ranges, core areas and home range fidelity were calculated. Distance travelled was calculated as the Euclidian distance between locations (30-min frequency, n = 8) using the ‘amt’ R library (Signer et al., 2019). Monthly accumulated distance was calculated as the sum of all distances previously calculated during each month. Monthly home range sizes (95% and 50% Kernel Density Estimators, KDE) were estimated to determine the area used by the individual during each month (n = 17), with ‘adeHabitat’ R library (Calenge, 2006). Monthly home range fidelity was calculated as the overlap between the monthly home ranges of each individual, using the function ‘kerneloverlap’ from ‘adehabitatHR’ R library, resulting in a matrix of pairwise comparisons which included the proportion of animal i's home range that is overlapped by animal j's home range (Kernohan et al., 2001). Overlap values range from zero (no overlap) to 1 (complete overlap).
2.3
Statistical analyses on the influence of season
To study seasonal differences in the monthly accumulated distance and KDEs, Kruskal–Wallis tests were performed (data were non-normal) between the three periods of the year (incubation, chick-rearing and non-breeding season). Subsequently, Wilcoxon tests for pairwise comparisons were performed to compare between all periods.
All statistical analyses were performed with R Software v. 4.0.5. A significant level was established at <0.05.
2.4
Philopatric behaviour
Six individuals, tagged as nestlings in their wild nest (Table 1), were used to study the philopatric behaviour of the species, that is, where individuals located their first breeding area in relation to the natal nest. Euclidian distance between the natal nest, whose position was known since it was noted in the tagging process, and an estimated position of the new nest established once individuals reached reproductive age were calculated. To estimate the position of the new nest, the centroids of the core areas (50% KDEs) were calculated during the incubation months (February–April). The equidistant position between those centroids was calculated, which resulted in an estimation of the location of the new nest. In addition, the altitude of both nests (natal and first breeding) was calculated using a raster topographic map (Esri topographic). Finally, we verified if nesting areas were repeated (located in the same area, <5 km) in subsequent years.
These calculations were carried out using QGIS 3.16.6. All the maps were drawn with the same software.
3.
Results
Home range sizes and accumulated distances greatly varied between and within individuals (seven females, two males and eight individuals with undetermined sex; Table 2). The average monthly home ranges (95% KDE) and core areas (50% KDE) were 6543 ± 19,935 km2 (range: 80–156,882 km2), and 1174 ± 4004 km2 (range: 9–66,065 km2), respectively. The monthly accumulated distance averaged 2246 ± 1256 km. On the other hand, all vultures showed average monthly home range fidelities between 50 and 73% (n = 17; Table 2). Furthermore, all individuals tracked for at least two years during reproductive age (n = 11; Table 1) repeated the location of breeding areas in subsequent years.
Table
2.
Monthly movement-related variables (accumulated distance, home ranges, core areas and monthly home range fidelity) for the 17 Cinereous Vultures tracked in this study. Values appear as mean ± SD (minimum–maximum).
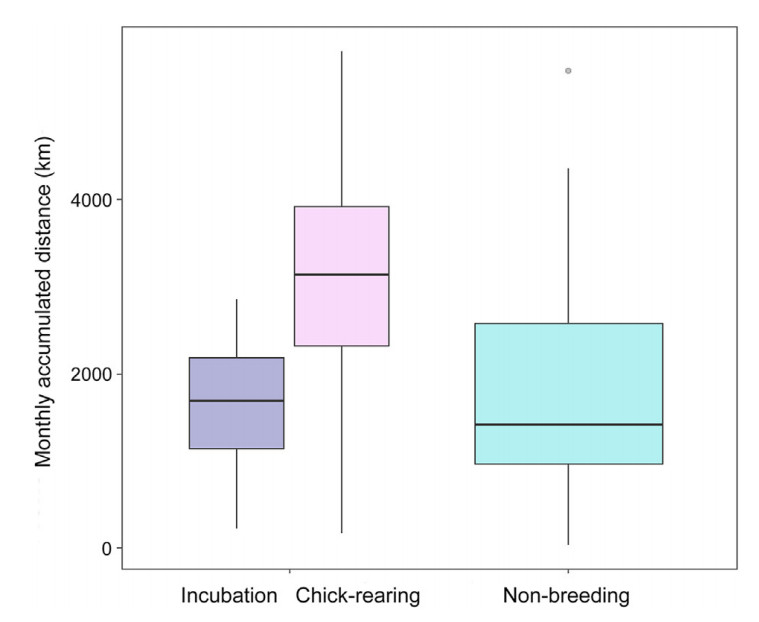
There were differences in the movement-related variables between seasonal periods (incubation, chick-rearing and non-breeding; Appendix Table S1). During the chick-rearing period, monthly accumulated distances were higher (P < 0.0001; Table 3; Fig. 1): 3316 ± 1108 (chick-rearing) vs. 1621 ± 622 (incubation) vs. 1726 ± 1159 km (non-breeding). On the other hand, there were no differences between incubation and non-breeding periods.
Table
3.
Monthly accumulated distance, 95% KDE and 50% KDE during the different periods (incubation, chick-rearing, and non-breeding). Values appear as mean ± SD (median). * Monthly accumulated distance was calculated using a sub-sample (eight individuals with 30-min location frequency; see Table 2).
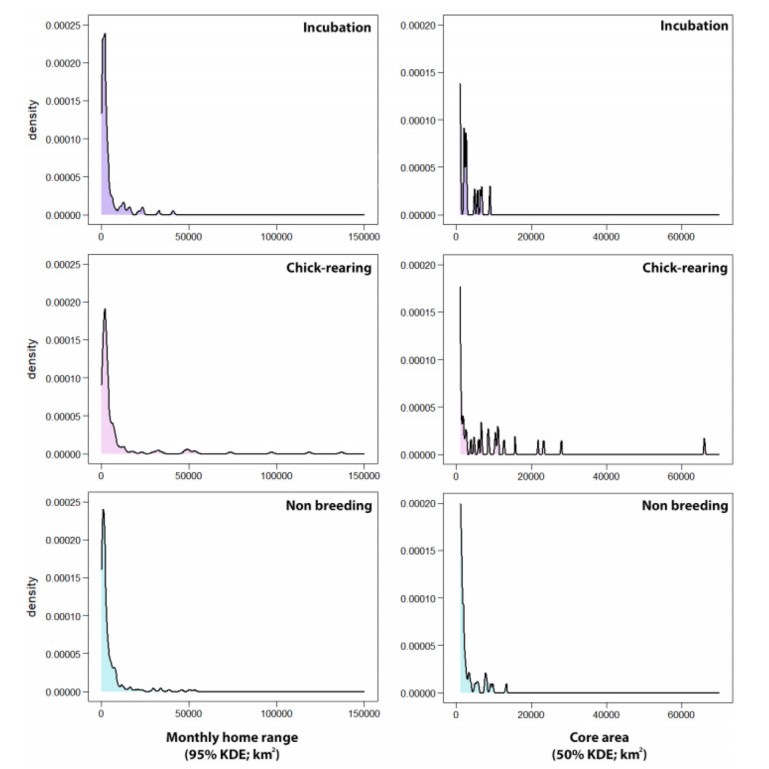
Seasonal differences in the monthly KDEs (95% and 50%) were found too. Home range sizes during chick-rearing were significantly larger than those of the other periods (Appendix Table S1). 95% KDEs averaged 11,035 ± 31,267 km2 during the chick-rearing period, 4032 ± 6476 during incubation, and 4385 ± 8107 during the non-breeding period. 50% KDEs averaged 1931 ± 6460 km2 during the chick-rearing period, 670 ± 1407 during incubation, and 852 ± 1726 during the non-breeding period (Table 3; Figs. 2 and 3). However, the monthly KDEs during all periods followed a non-normal skewed distribution, so mean values might not be enough to explore differences in home range sizes between periods, and median values may be more informative: 95% KDEs median values were 1840 km2 during incubation, 2241 km2 during chick-rearing, and 1648 km2 during the non-breeding period (Table 3). Within the three periods, smaller home ranges were considerably more frequent than larger ones. However, larger KDEs were estimated more frequently during chick-rearing for some individuals (Figs. 2 and 3).
Figure
2.
Distribution of monthly KDEs (95 and 50%) within the three considered periods (incubation, chick-rearing and non-breeding). The variables followed a non-normal distribution.
Figure
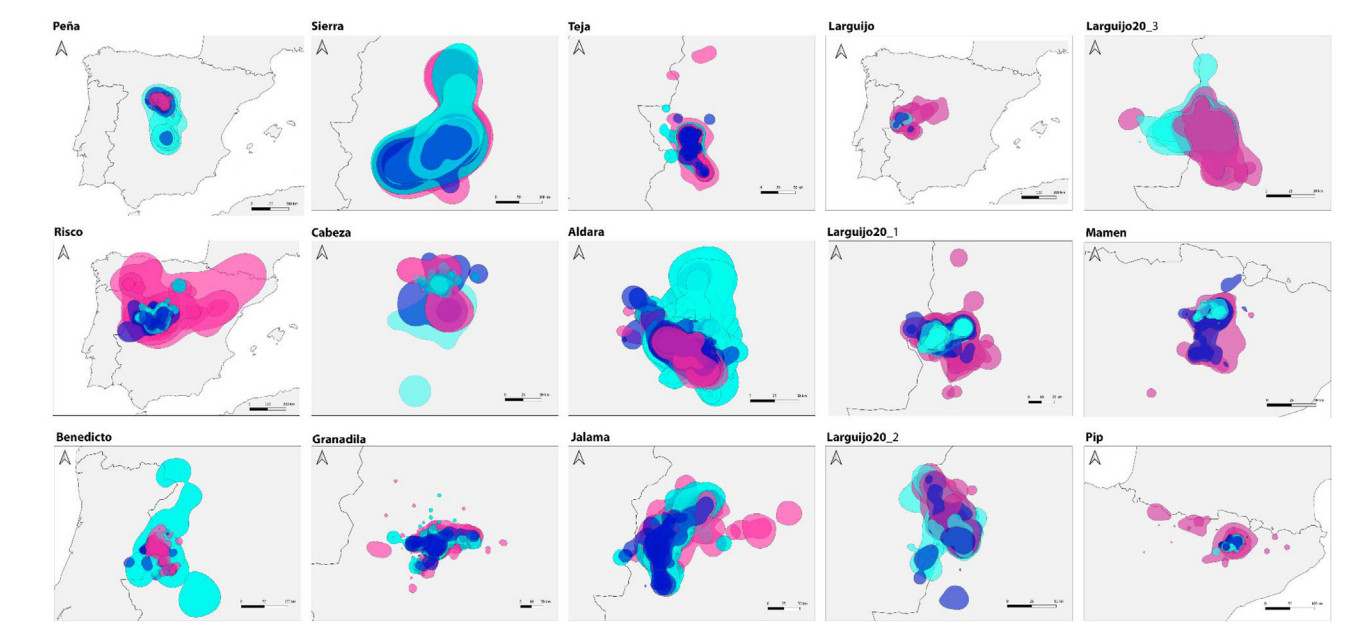
3.
Monthly home ranges (95% KDE) of the Cinereous Vultures during the entire tracked periods. Each pannel corresponds to one individual, and each polygon to a monthly home range. Dark blue = incubation (February–April), pink = chick-rearing (May–August), Light blue = non-breeding (September–January).
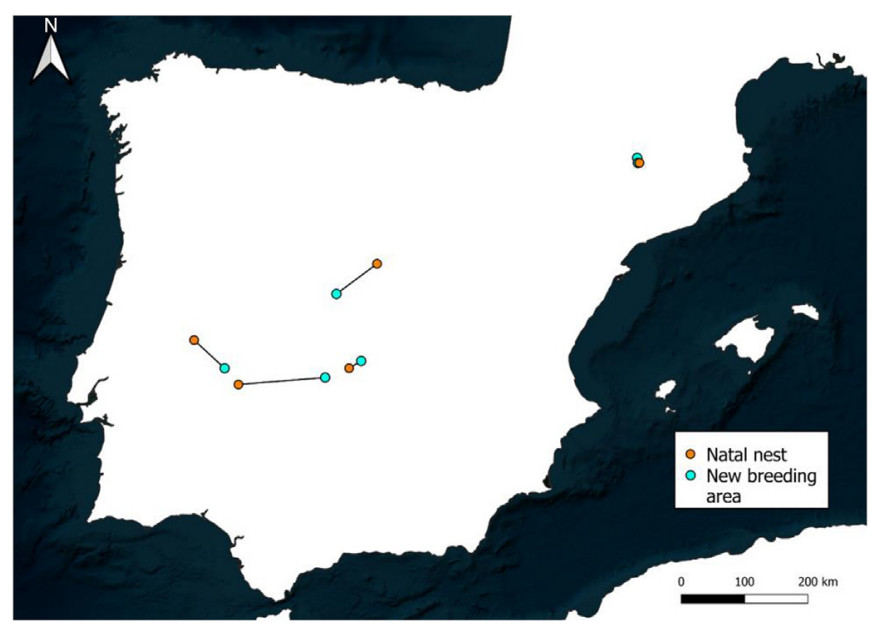
Finally, the Cinereous Vultures tagged as nestlings (n = 6) established their first breeding area 54 ± 51 km from the natal nest (range = 9–138 km). The two individuals from the eastern pre-Pyrenees (IDs: Mamen and Pip) located their first breeding area 9 and 10 km from their natal nest, respectively. Individuals from the Centre, South-Centre and West of the Iberian Peninsula established their first breeding area tens of kilometres away, reaching 138 km in one western individual (Table 4; Fig. 4).
Table
4.
Philopatry patterns of six Cinereous Vultures, tagged as nestlings and tracked until reproductive age, including Euclidian distance between natal nest and new breeding area, and fidelity to breeding area. A hyphen (−) indicates unavailable information.
Figure
4.
Natal dispersal of six cinereous vultures. The map represents the Euclidian distance between the natal nest and the first breeding area established by the individuals.
This study provides a comprehensive overview of the spatial ecology of the Iberian Cinereous Vultures throughout the annual cycle, highlighting the home range fidelity, the seasonal differences in the movement-related variables, and the philopatric tendency of the species.
Cinereous Vultures maximised the use of the space throughout the Iberian Peninsula, occupying areas of 6543 km2 per month on average (95% KDE), ranging from 4032 during the incubation period to 11,035 km2 in the chick-rearing period. These values are considerably higher than those estimated for other Iberian raptors. Prey-hunting territorial birds such as the Bonelli's Eagle (Aquila fasciata) used 55 km2 (Morollón et al., 2022). The Lesser Kestrel (Falco naumanni), a colonial falconid, used 13.37 km2 during the breeding season in eastern Iberia (Vidal-Mateo et al., 2019). The Red Kite (Milvus milvus), an opportunistic and facultative scavenger, used 3.65 km2 during the breeding period (García-Macía et al., 2022b), and 1158 km2 during the wintering season (García-Macía et al., 2022a). Other Iberian species of vultures showed similar home range sizes to those of Cinereous Vultures: 11,765 km2 in the Bearded Vulture (Gypaetus barbatus; Gil et al., 2014), and 5027 km2 in the Griffon Vulture (Gyps fulvus; Morant et al., 2023). On the other hand, our home range estimations were higher than those of other surveys on the Cinereous Vultures performed in the eastern Mediterranean basin (i.e., Greece; Vasilakis et al., 2008), but those home range estimations may be severely underestimated because it was carried out by traditional radiotracking. Thus, the species and their foraging habits greatly influences home range size. However, landscape-related factors (including from orographic characteristics to habitat heterogeneity) may also strongly influence home ranges of large scavengers, which are species highly dependent on carrion distribution (Ruxton and Houston, 2004). Therefore, regional differences in the spatial ecology of vultures are expected, even within Iberia. Future studies may analyse the influence of region in home range size and the habitat use of the Cinereous Vultures.
The home range fidelity of adult Cinereous Vultures was high, in contrast to juvenile individuals during the dispersal period (own data). This repeatability may be linked to breeding constraints and colonial hierarchy. First, the movements of adults are limited during most part of the year due to the presence of eggs, which must be incubated, and subsequently of chicks, which must be fed. Both members of the pair are involved in these two processes (incubation and chick-rearing), so sex differences during the breeding season are expected to be low. However, some studies on other similar scavengers in Iberia reported that females often occupy larger areas than males (Morant et al., 2023), which may be due to the higher flight effort of females during chick-rearing. Second, adults are higher within the colonial hierarchy, so they have priority access during carrion exploitation (van Overveld et al., 2018). This allows, under stable environmental conditions, the repeatability of home ranges. The high home range fidelity in adult vultures may decrease mortality risks, because individuals restrict their movements to well-known landscapes.
The high seasonal and individual variability should be highlighted. During the chick-rearing period (May–August), monthly accumulated distances and home range sizes were approximately 2- and 3-fold higher than those of incubation and non-breeding periods, respectively. There are two likely causes for these seasonal differences. Firstly, chick-rearing entails higher food demands, which need to be provided by the parental individuals. Therefore, larger movements and foraging areas are expected during this period in both sexes (López-López et al., 2021). Secondly, the increase of movement-related variables during chick-rearing may also be a consequence of the better environmental conditions for flying (thermal currents, more daylight hours, less rainfall and unfavourable winds, etc.) during spring and summer. These two explanations are not mutually exclusive. In fact, the phenology of the breeding season is a great advantage for large soaring-gliding raptors, as it allows them to cover larger areas of the territory with low energy expenditure. However, these data must be interpreted with caution because of the lack of information on some reproductive variables: reproductive success was not confirmed by field work. Non-reproductive adults might have different spatial patterns because they are not influenced by hatching and chick-rearing processes. Furthermore, many other unconsidered factors may be critical to explain the variability of Cinereous Vultures’ movements: i.e., supplementary feeding sites, habitat characteristics, type of carrion abundance in the region, etc.
The Cinereous Vultures settled their breeding area a few tens of kilometres from their natal nests, always within the same Iberian region. These philopatric patterns were expected due to the colonial behaviour of the species, also present in other colonial raptors in Iberia (García-Macía et al., 2022b). In colonial scavengers, philopatry could allow the stabilization of the colonies within their territories, but may have negative consequences in the expansion of their distribution area. The data collected by censuses of the species in Spain suggested that, despite the general increase in the populations, the distribution range of breeding individuals remained stable, except for re-introduced colonies (Del Moral, 2022). Therefore, the natural expansion of the distribution range of the species may have been limited by its philopatric behaviour, so re-introduction projects may be an appropriate management tool. On the other hand, although the sample size in our study was small, differences between regions in the natal dispersal should not be discarded: bigger colonies (located in West and Centre-South regions) showed further natal dispersal in our study, which may be a consequence of intraspecific competence for carrion exploitation or the presence of supplementary feeding sites. Future studies may explore the variability of the natal dispersal of the species in more detail.
Authors' contributions
JG-M: conceptualization, data curation, formal analysis and writing of the original draft. EA, MG, JJI-L, MG, GP, and MV: tagging of individuals, data management and projects administration. VU: conceptualization, review & editing, and supervision. All authors read and approved the final manuscript.
Ethics statement
The experiments comply with the current laws of Spain and taggings were carried out with the permission of the Administration.
Declaration of competing interest
The authors declare that they have no known competing financial interests or personal relationships that could have appeared to influence the work reported in this paper.
Acknowledgements
We would like to thank the Government of Aragon (SARGA), the Cos d’Agents Rurals de Catalunya (CAR), and the Grup de Suport de Muntanya for their collaboration in the tagging of the Caça de Boumort National Reserve. We are also grateful for the effort made by the Natural Environment Agents from Extremadura in the monitoring of the Cinereous Vulture population and their collaboration in the captures and taggings, especially to their Vertical Work Team; and for the work done by the Center for Wildlife Recovery and Environmental Education "Los Hornos" and the Wildlife Hospital of AMUS. This paper is part of Jorge García-Macía's Ph.D thesis.
Akinwande, M.O., Dikko, H.G., Samson, A., 2015. Variance inflation factor: as a condition for the inclusion of suppressor variable(s) in regression analysis. Open J. Stat. 5, 754–767. .
Baselga, A., 2010. Partitioning the turnover and nestedness components of beta diversity. Global Ecol. Biogeogr. 19, 134–143. .
Baselga, A., Bonthoux, S., Balent, G., 2015. Temporal beta diversity of bird assemblages in agricultural landscapes: land cover change vs. stochastic processes. PLoS One 10, e0127913. .
Bielańska-Grajner, I., GŁadysz, A., 2010. Planktonic rotifers in mining lakes in the Silesian Upland: relationship to environmental parameters. Limnologica 40, 67–72. .
Blandón, A.C., Perelman, S.B., Ramírez, M., López, A., Javier, O., Robbins, C.S., 2016. Temporal bird community dynamics are strongly affected by landscape fragmentation in a Central American tropical forest region. Biodivers. Conserv. 25, 311–330. .
Blondel, J., 2003. Guilds or functional groups: does it matter? Oikos 100, 223–231. .
Brandt, J.S., Haynes, M.A., Kuemmerle, T., Waller, D.M., Radeloff, V.C., 2013. Regime shift on the roof of the world: alpine meadows converting to shrublands in the southern Himalayas. Biol. Conserv. 158, 116–127. .
Château, P.A., Wunderlich, R.F., Wang, T.W., Lai, H.T., Chen, C.C., Chang, F.J., 2019. Mathematical modelling suggests high potential for the deployment of floating photovoltaic on fish ponds. Sci. Total Environ. 687, 654–666. .
Cintra, R., 2019. Waterbird community composition in relation to lake physical traits and wetland limnological conditions in the Amazon basin. Hydrobiologia 826, 43–65. .
Clarke, K.R., 1993. Non-parametric multivariate analyses of changes in community structure. Aust. J. Ecol. 18, 117–143. .
Davidson, N.C., 2014. How much wetland has the world lost? Long-term and recent trends in global wetland area. Mar. Freshw. Res. 65, 934–941. .
Delany, S., 2005. Guidelines for Participants in the International Waterbird Census (IWC). Wetlands International, Wageningen.
Fandos, G., Rotics, S., Sapir, N., Fiedler, W., Kaatz, M., Wikelski, M., et al., 2020. Seasonal niche tracking of climate emerges at the population level in a migratory bird. Proc. R. Soc. B 287, 20201799. .
Gianuca, A.T., Declerck, S.A.J., Lemmens, P., de Meester, L., 2017. Effects of dispersal and environmental heterogeneity on the replacement and nestedness components of beta-diversity. Ecology 98, 525–533. .
Giosa, E., Mammides, C., Zotos, S., 2018. The importance of artificial wetlands for birds: a case study from Cyprus. PLoS One 13, e0197286. .
Henry, D.A., Cumming, G.S., 2017. Can waterbirds with different movement, dietary and foraging functional traits occupy similar ecological niches? Landsc. Ecol. 32, 265–278. .
Hu, B., Guo, W., 2018. Mining subsidence area status, syntheses governance model and governance recommendation. Coal Mining Technol. 23, 1–4 (in Chinese).
Hu, Z., Xiao, W., Fu, Y., 2014. Introduction to concurrent mining and reclamation for coal mines in China. In: Drebenstedt, C., Singhal, R. (Eds.), Mine Planning and Equipment Selection: Proceedings of the 22nd MPES Conference, Dresden, Germany, 14th–19th October 2013. Springer, Cham, pp. 781–789.
Jackson, M.V., Choi, C.Y., Amano, T., Estrella, S.M., Lei, W., Moores, N., et al., 2020. Navigating coasts of concrete: pervasive use of artificial habitats by shorebirds in the Asia-Pacific. Biol. Conserv. 247, 108591. .
Kloskowski, J., Green, A.J., Polak, M., Bustamante, J., Krogulec, J., 2009. Complementary use of natural and artificial wetlands by waterbirds wintering in Doñana, south-west Spain. Aquat. Conserv. 19, 815–826. .
Kunte, K., 2008. Competition and species diversity: removal of dominant species increases diversity in Costa Rican butterfly communities. Oikos 117, 69–76. .
Lantz, S.M., Gawlik, D.E., Cook, M.I., 2011. The effects of water depth and emergent vegetation on foraging success and habitat selection of wading birds in the Everglades. Waterbirds 34, 439–447. .
Lewin, I., Spyra, A., Krodkiewska, M., Strzelec, M., 2015. The importance of the mining subsidence reservoirs located along the trans-regional highway in the conservation of the biodiversity of freshwater molluscs in industrial areas (Upper Silesia, Poland). Water Air Soil Pollut. 226, 1–12. .
Li, C., Yang, S., Zha, D., Zhang, Y., de Boer, W.F., 2019a. Waterbird communities in subsidence wetlands created by underground coal mining in China: effects of multi-scale environmental and anthropogenic variables. Environ. Conserv. 46, 67–75. .
Li, C., Zhang, Y., Zha, D., Yang, S., Huang, Z.Y., de Boer, W.F., 2019b. Assembly processes of waterbird communities across subsidence wetlands in China: a functional and phylogenetic approach. Divers. Distrib. 25, 1118–1129. .
Li, C., Zhao, B., Wang, Y., 2019c. Nestedness of waterbird assemblages in the subsidence wetlands recently created by underground coal mining. Curr. Zool. 65, 155–163. .
Li, X., Anderson, C.J., Wang, Y., Lei, G., 2021b. Waterbird diversity and abundance in response to variations in climate in the Liaohe Estuary, China. Ecol. Indicat. 132, 108286. .
Liu, H., Zhang, M., Su, L., Chen, X., Liu, C., Sun, A., 2021. A boundary model of terrain reconstruction in a coal-mining subsidence waterlogged area. Environ. Earth Sci. 80, 1–15. .
Lorenzón, R.E., Ronchi-Virgolini, A.L., Blake, J.G., 2020. Wetland dependency drives temporal turnover of bird species between high- and low-water years in floodplain wetlands of the Paraná River. Ecohydrology 13, e2179. .
Ludwig, J.A., Reynolds, J.F., 1988. Statistical Ecology: A Primer in Methods and Computing. John Wiley and Sons, New York.
Ma, Z., Li, B., Zhao, B., Jing, K., Tang, S., Chen, J., 2004. Are artificial wetlands good alternatives to natural wetlands for waterbirds? – a case study on Chongming island, China. Biodivers. Conserv. 13, 333–350. .
Ma, Z., Cai, Y., Li, B., Chen, J., 2010. Managing wetland habitats for waterbirds: an international perspective. Wetlands 30, 15–27. .
MacKinnon, J., Phillipps, K., Nong, Y., Hua, L., Yao, X., Zhi, G., et al., 2022. Guide to the Birds of China. Oxford University Press, Oxford.
Mundava, J., Caron, A., Gaidet, N., Couto, F.M., Couto, J.T., de Garine-Wichatitsky, M., et al., 2012. Factors influencing long-term and seasonal waterbird abundance and composition at two adjacent lakes in Zimbabwe. Ostrich 83, 69–77. .
Ouyang, Z., Gao, L., Yang, C., 2018. Distribution, sources and influence factors of polycyclic aromatic hydrocarbon at different depths of the soil and sediments of two typical coal mining subsidence areas in Huainan, China. Ecotoxicol. Environ. Saf. 163, 255–265. .
Pielou, E.C., 1966. The measurement of diversity in different types of biological collections. J. Theor. Biol. 13, 131–144. https://doi.org/10.1016/0022-5193(66) 90013-0.
Quan, R., Wen, X., Yang, X., 2002. Effects of human activities on migratory waterbirds at Lashihai Lake, China. Biol. Conserv. 108, 273–279. .
R Core Team, 2020. R: a Language and Environment for Statistical Computing. R Foundation for Statistical Computing, Vienna. . (Accessed 11 May 2020).
Rajpar, M.N., Ahmad, S., Zakaria, M., Ahmad, A., Guo, X., Nabi, G., et al., 2022. Artificial wetlands as alternative habitat for a wide range of waterbird species. Ecol. Indicat. 138, 108855. .
Sahu, A., Yadav, N., Sudhakar, K., 2016. Floating photovoltaic power plant: a review. Renew. Sustain. Energy Rev. 66, 815–824. .
Si, X., Baselga, A., Ding, P., 2015. Revealing beta-diversity patterns of breeding bird and lizard communities on inundated land-bridge islands by separating the turnover and nestedness components. PLoS One 10, e0127692. .
Soininen, J., Heino, J., Wang, J., 2017. A meta-analysis of nestedness and turnover components of beta diversity across organisms and ecosystems. Global Ecol. Biogeogr. 27, 96–109. .
Sun, C., Wang, Y., Sun, S., Zhang, F., 2006. Analysis dynamics of phytoplankton community characteristics in Daya Bay. Acta Ecol. Sin. 26, 3948–3958 (in Chinese).
Tavares, D.C., Guadagnin, D.L., de Moura, J.F., Siciliano, S., Merico, A., 2015. Environmental and anthropogenic factors structuring waterbird habitats of tropical coastal lagoons: implications for management. Biol. Conserv. 186, 12–21. .
Tourenq, C., Bennetts, R.E., Kowalski, H., Vialet, E., Lucchesi, J.L., Kayser, Y., et al., 2001. Are ricefields a good alternative to natural marshes for waterbird communities in the Camargue, southern France? Biol. Conserv. 100, 335–343. .
Wang, H., Shi, R., Lu, C., Jiang, Y., Deng, D., Zhang, D., 2019. Investigation of sudden faults instability induced by coal mining. Saf. Sci. 115, 256–264. .
Wang, X., Kuang, F., Tan, K., Ma, Z., 2018. Population trends, threats, and conservation recommendations for waterbirds in China. Avian Res. 9, 14. .
Wang, X., Li, X., Ren, X., Jackson, M.V., Fuller, R.A., Melville, D.S., et al., 2022. Effects of anthropogenic landscapes on population maintenance of waterbirds. Conserv. Biol. 36, e13808. .
Węsławski, J.M., Kendall, M.A., Włodarska-Kowalczuk, M., Iken, K., Kędra, M., Legezynska, J., et al., 2011. Climate change effects on Arctic fjord and coastal macrobenthic diversity – observations and predictions. Mar. Biodivers. 41, 71–85. .
Wu, L., Si, X., Didham, R.K., Ge, D., Ding, P., 2017. Dispersal modality determines the relative partitioning of beta diversity in spider assemblages on subtropical land-bridge islands. J. Biogeogr. 44, 2121–2131. .
Xu, P., Zhang, X., Zhang, F., Bempah, G., Lu, C., Lv, S., et al., 2020. Use of aquaculture ponds by globally endangered red-crowned crane (Grus japonensis) during the wintering period in the Yancheng national nature reserve, a ramsar wetland. Glob. Ecol. Conserv. 23, e01123. .
Xu, Z., Wang, Y., Chen, Y., Shen, H., 1995. An ecological study on zooplankton in maximum turbid zone of estuarine area of Changjiang (Yangtze) River. J. Fish. Sci. China 2, 39–48 (in Chinese).
Zeng, Q., Reid, J., Saintilan, N., Colloff, M.J., Lei, G., Wen, L., 2019. Contrasting diversity patterns of breeding anatidae in the Northern and Southern Hemispheres. Ecol. Evol. 9, 9990–10003. .
Zhang, G., Yuan, X., Wang, K., 2019. Biodiversity and temporal patterns of macrozoobenthos in a coal mining subsidence area in North China. PeerJ 7, e6456. .
Zhou, J., Zhou, L., Xu, W., 2020. Diversity of wintering waterbirds enhanced by restoring aquatic vegetation at Shengjin Lake, China. Sci. Total Environ. 737, 140190. .
Table
1.
Metadata of the 17 adult Cinereous Vultures (Aegypius monachus) tracked in this study. Tagging age, region, analysed period and transmitter model are shown. A hyphen (−) indicates unavailable information.
Table
2.
Monthly movement-related variables (accumulated distance, home ranges, core areas and monthly home range fidelity) for the 17 Cinereous Vultures tracked in this study. Values appear as mean ± SD (minimum–maximum).
Table
3.
Monthly accumulated distance, 95% KDE and 50% KDE during the different periods (incubation, chick-rearing, and non-breeding). Values appear as mean ± SD (median). * Monthly accumulated distance was calculated using a sub-sample (eight individuals with 30-min location frequency; see Table 2).
Table
4.
Philopatry patterns of six Cinereous Vultures, tagged as nestlings and tracked until reproductive age, including Euclidian distance between natal nest and new breeding area, and fidelity to breeding area. A hyphen (−) indicates unavailable information.

 DownLoad:


 Email Alerts
 RSS Feeds