Tianlong Zhou, Kasun H. Bodawatta, Aiwu Jiang. 2023: A network meta-analysis on comparison of invasive and non-invasive sampling methods to characterize intestinal microbiota of birds. Avian Research, 14(1): 100086. DOI: 10.1016/j.avrs.2023.100086
Citation:
Tianlong Zhou, Kasun H. Bodawatta, Aiwu Jiang. 2023: A network meta-analysis on comparison of invasive and non-invasive sampling methods to characterize intestinal microbiota of birds. Avian Research, 14(1): 100086. DOI: 10.1016/j.avrs.2023.100086
Tianlong Zhou, Kasun H. Bodawatta, Aiwu Jiang. 2023: A network meta-analysis on comparison of invasive and non-invasive sampling methods to characterize intestinal microbiota of birds. Avian Research, 14(1): 100086. DOI: 10.1016/j.avrs.2023.100086
Citation:
Tianlong Zhou, Kasun H. Bodawatta, Aiwu Jiang. 2023: A network meta-analysis on comparison of invasive and non-invasive sampling methods to characterize intestinal microbiota of birds. Avian Research, 14(1): 100086. DOI: 10.1016/j.avrs.2023.100086
Birds maintain complex and intimate associations with a diverse community of microbes in their intestine. Multiple invasive and non-invasive sampling methods are used to characterize these communities to answer a multitude of eco-evolutionary questions related to host-gut microbiome symbioses. However, the comparability of these invasive and non-invasive sampling methods is sparse with contradicting findings. Through performing a network meta-analysis for 13 published bird gut microbiome studies, here we attempt to investigate the comparability of these invasive and non-invasive sampling methods. The two most used non-invasive sampling methods (cloacal swabs and fecal samples) showed significantly different results in alpha diversity and taxonomic relative abundances compared to invasive samples. Overall, non-invasive samples showed decreased alpha diversity compared to intestinal samples, but the alpha diversities of fecal samples were more comparable to the intestinal samples. On the contrary, the cloacal swabs characterized significantly lower alpha diversities than in intestinal samples, but the taxonomic relative abundances acquired from cloacal swabs were similar to the intestinal samples. Phylogenetic status, diet, and domestication degree of host birds also influenced the differences in microbiota characterization between invasive and non-invasive samples. Our results indicate a general pattern in microbiota differences among intestinal mucosal and non-invasive samples across multiple bird taxa, while highlighting the importance of evaluating the appropriateness of the microbiome sampling methods used to answer specific research questions. The overall results also suggest the potential importance of using both fecal and cloacal swab sampling together to properly characterize bird microbiomes.
Birds (Class Aves) represent one of the most diverse and cosmopolitan vertebrate classes, with more than 10,000 extant species occupying a range of habitats across all the biomes (Pigot et al., 2020; Bodawatta et al., 2022a). They play many key ecological roles, such as pollination, seed dispersal, and ecosystem engineering, thereby influencing the stability of their natural ecosystems (Sekercioglu, 2006; Lees et al., 2022). Birds, like any other branch of vertebrates, harbor complex and diverse gut microbiomes (Ley et al., 2008), where microbes provide a variety of nutritional, defensive and developmental functions that affect the health and fitness of the bird hosts (Ramakrishna, 2013; Waite and Taylor, 2014; Grond et al., 2018; Bodawatta et al., 2022a). Therefore, the exploration of drivers and functions of avian gut microbiomes are necessary to fully understand the biology and evolution of birds and their ecological roles.
Although numerous research has been conducted on intestinal microbiota of various bird species in the past two decades (Bodawatta et al., 2022a), there is still no standardized set of best practices to guide the collection of microbiome samples from bird hosts. Generally, three types of samples, including fecal, cloacal swabs, and intestinal mucosa, are used to characterize the gut microbiota of birds (Videvall et al., 2018; Berlow et al., 2020). Direct sampling of the host intestinal mucosa or mucosal tissue biopsy can lead to the most accurate characterization of gut microbiota (Sun et al., 2021). Unfortunately, the collection of mucosal samples by biopsy is a highly invasive procedure with risks of perforation (Jones et al., 2018; Sun et al., 2021). Hence, destructive intestinal mucosal sampling often requires killing the target individuals (Hird et al., 2015). Henceforth, intestinal mucosal sampling is not possible in extensive research or those studies requiring repeated sampling of the same individuals and in studies that focus on endangered animals (Ingala et al., 2018; Jones et al., 2018; Sun et al., 2021).
Fecal samples are the most common samples used to assess the composition and function of bird gut microbiomes. This is probably the most convenient sampling method because it is relatively non-invasive and allows repeated sampling of individuals over time. However, it may only capture information about bacteria in the lumen, so that there may be variability and differences in microbial composition between fecal and the intestinal mucosal samples (Jones et al., 2018; Videvall et al., 2018; Berlow et al., 2020; Sun et al., 2021). Cloacal swab sampling is another relatively non-invasive and low-risk sampling method for bird microbiomes. In contrast to fecal sampling, it can capture a portion of the mucosal bacterial community at the hind gut along with lumen bacteria (Budding et al., 2014; Jones et al., 2018). These non-invasive sampling methods, thus provide promising alternatives to invasive sampling, but it is important to assess how representative are these non-invasive sampling methods for characterization of gut microbiomes.
In birds, multiple independent studies across different taxonomic groups have investigated the comparability between non-invasive (fecal and cloacal swab samples) and invasive methods for gut microbiome profiling (Videvall et al., 2018; Berlow et al., 2020). However, the results are inconsistent across studies. For example, several studies have found that the bacterial community in bird feces does not always reflect the gut community of the host (Stanley et al., 2015; Wilkinson et al., 2016). However, they seem to be better at representing the microbiomes obtained with intestinal mucosa samples than cloacal swab samples (Videvall et al., 2018). On the other hand, other studies have demonstrated that cloacal swab samples are a good substitute for intestinal samples obtained by invasive sampling (Berlow et al., 2020; Bodawatta et al., 2020). The extensive variation and heterogeneity in previous research make it challenging to synthesize and explain these differences between invasive and non-invasive sampling methods of bird gut microbiomes.
To fill this knowledge gap, here we attempt to answer two timely questions related to the appropriateness of using non-invasive samples to characterize bird gut microbiomes: First, do fecal and cloacal swab samples characterize the intestinal flora similar to invasive samples across bird species? Second, which sampling method can better capture the dynamic changes of intestinal microbiota under the influence of different host and environmental factors? Using a robust network meta-analysis of data from 13 published studies (24 subsets of 11 species) on bird gut microbiomes, for the first time we compare the composition and alpha diversities of microbiota obtained from invasive and non-invasive samples. We also performed meta-regression analysis to investigate whether biological and ecological factors (e.g., phylogeny, diet, and domestication) influence the magnitude of relative differences in microbiomes between different sampling methods.
2.
Methods
2.1
Literature search and inclusion criteria
We searched Web of Science (WoS) to identify published avian microbiome studies using the following combinations of the terms: (gut microbiota OR intestinal microbiota) AND bird AND (feces OR cloaca OR cecum) in Subject/Title/Abstract. Moreover, we manually checked the reference lists of the identified papers for additional studies that may have been missed through WoS search.
Subsequently, we followed the following criteria to select studies to use in our meta-analysis: (1) control studies that were conducted between intestinal and feces/cloaca; (2) ability to obtain the mean difference (MD) with standard deviation (STD) in these two groups or sufficient data to calculate these. We excluded the studies if we failed to obtain aforementioned information or sufficient data.
2.2
Sequence data acquisition and processing
16S rRNA gene sequence data of all samples were obtained from the publicly available data sets provided by the selected literature. Amplicon data were downloaded from MG-Rast and the NCBI Sequence Read Archive using the accession number provided by the included literature.
We processed sequence data separately for each study to avoid potential batch effects through analyzing all the studies together according to Ho et al. (2018). To keep the data consistency for meta-analysis, OTU picking was performed at 97% similarity using QIIME2 Core 2021.11 (Bolyen et al., 2019), with the Greengenes database (version 13.8) (DeSantis et al., 2006). Alpha rarefaction was done in QIIME2 using default options. Rarefaction depth was selected as the highest depth that retained all study samples. Taxonomic relative abundances (phylum level) and alpha diversity indices (Richness, Shannon, Chao1 index and Phylogenetic_Diversity_whole_tree: PD) were calculated based on rarefied OTU tables with the ‘picante’ package (v1.8.2) (Kembel et al., 2010) in R (version 4.0.5) (R Core Team, 2021). For each study, mean alpha diversity indices were calculated at the selected rarefaction depth for each sample. The summary tables of bacterial taxa relative abundances were filtered to retain only the taxa with an average relative abundance of at least 0.005% and were detected in at least 5% of the samples in that study.
2.3
Data extraction
We extracted following meta data from studies that met the inclusion criteria: (1) general information (last name of first author, year of publication, and sampling location); (2) bird characteristics (species, diet, domestication and divergence time (Bryson and Vogel, 1965; Yang and Rannala, 2005; Jetz et al., 2012); (3) experimental data, including effect size of taxonomic relative abundances (phylum level; MD and STD) and the most frequently measured alpha-diversity indices (MD and STD).
The diet and domestication-levels of species were determined from the included articles and the World Database of Birds (https://avibase.bsc-eoc.org). We classify birds into three levels of domestication: domesticated, transitional (it is in the process of domestication and has the ability to survive in the wild), and wild. The divergence times (as a proxy for the phylogenetic status) were calculated for all bird species included in the study, as detailed in the supplementary materials and methods in Appendix 1 pp. 2–5.
2.4
Pairwise meta-analysis
We ran all analyses in R (version 4.0.5) (R Core Team, 2021). To examine the overall effects while addressing heterogeneity across studies, we synthesized data in a meta-analysis using random-effects meta-analysis models with inverse variance weighting and DerSimonian–Laird estimator in the ‘metafor’ package (version 3.0–2) (Viechtbauer, 2010) and ‘meta’ package (version 5.1–0) (Balduzzi et al., 2019). We investigated the heterogeneity of treatment effects visually by inspecting forest plots, alongside monitoring τ (the standard deviation of the distribution of true effect sizes) and the I2 (the percentage of variability in the effect sizes that is not caused by sampling error) (Higgins and Thompson, 2002). I2 values of 25%, 50%, and 75% were related to low, moderate, and high heterogeneity (Higgins et al., 2003). To visualize heterogeneity, prediction intervals were included in forest plots. Small study effects and publication bias were assessed by visual inspection of contour-enhanced funnel plots (Peters et al., 2008) and Egger's test (Stanley and Doucouliagos, 2014).
2.5
Assessment of the transitivity assumption
Transitivity is the fundamental underlying assumption of network meta-analysis (Efthimiou et al., 2016). It allows us to combine direct evidence (e.g., from comparisons A−B and C–B) to create indirect evidence about a related comparison (e.g., A−C; Efthimiou et al., 2016). To assess this assumption, we examined the distribution of possible effect modifiers across sampling method comparisons. Potential effect modifiers included phylogenetic status, diet, and domestication (Pradhan, 2014; Pillinger et al., 2020).
2.6
Frequentist network meta-analysis
We conducted a random effects network meta-analysis (NMA) to synthesize all evidence for each outcome. We used a frequentist approach to NMA using ‘netmeta’ (version 2.0–1) (Gerta et al., 2021). Network plots were generated using the ‘netgraph’ function. The value change for each given alpha diversity or taxonomic relative abundance (phylum level) was expressed as the standard mean difference (SMD) with 95% confidence intervals. Intestinal mucosa sample was selected as the reference ‘treatment’ and forest plots were created using ‘ggplot2’ (version 3.3.5) (Wickham, 2016). League tables were created to show the relative degree to which fecal and cloacal swab samples differ from intestinal mucosal samples using the ‘netleague’ function. For each alpha diversity or taxonomic relative abundance, a frequentist analogue of ‘Surface under the Cumulative Ranking Curve’ (SUCRA) was used to rank antipsychotics based on alpha diversity and taxonomic relative abundance, using the ‘netrank’ function. This provided P-scores which rank the three sampling methods on a continuous 0 to 1 scale: the higher the P-score, the lower the alpha diversity and the relative abundance of taxa.
2.7
Risk of bias in network analysis
Comparison-adjusted funnel plots (Salanti et al., 2014) and Egger's regression (Peters et al., 2006) were used to assess publication bias in network meta-analysis models.
2.8
Sensitivity analysis
We hypothesized that the inclusion of various bird species might contribute to heterogeneity and inconsistency. Thus, we fitted an alternative statistical approach (Bayesian hierarchical model; Efthimiou et al., 2016) after changing the effect quantification into the mean difference (MD) between the two analyses conditions to assess the robustness of the findings.
2.9
Meta-regression and subgroup analysis: predictors of variation of gut microbiota
Diet, domestication, and phylogenetic status influence the intestinal flora of birds (Hird et al., 2015; Davidson et al., 2020; Liu et al., 2020). Therefore, we investigated whether these covariates were related to changes in gut microbiota. Using the ‘metafor’ package (version 3.0–2) (Viechtbauer, 2010), we did meta-regressions and subgroup analysis to examine the relationship between intestinal microbiota change and diet, domestication, and phylogenetic status (using the divergence time as a proxy).
3.
Results
3.1
Study selection and characteristics
We found 657 articles through our search, but only 24 articles conducted controlled experiments to compare invasive and non-invasive sampling methods. However, we were only able to obtain raw sequence reads of bacterial 16S rRNA genes and calculate the data required for meta-analysis from 13 of these 24 articles. Three of the included studies had three sampling methods (fecal, cloacal swab, and intestinal mucosa samples). The rest of the studies only compared two sampling methods (fecal vs. intestinal mucosa samples or cloacal swab vs. intestinal mucosa samples). To control the heterogeneity of experimental conditions in different studies, we divided the original studies into data subsets of different experimental conditions based on the experimental design. All data subsets (24 in total) were then included in the meta-analysis. In total, 1093 samples from 11 bird species were included in our analyses. A summary of information on the raw data of the included studies was presented in Appendix 2 Table S1 (pp. 6–10). We also supplied the predictive factor of data subset included in meta-analysis in Appendix 2 Table S2 (pp. 10–11).
3.2
Pairwise meta-analysis revealed differences in microbial diversity and composition between sampling methods
Divergence time of the birds were similarly distributed across treatment comparisons. Species and diet differed across treatment comparisons (Appendix 2 pp. 10–11), but overall, we felt the samples were similar enough to synthesize jointly. We did two types of pairwise comparisons of variations caused by different sampling methods to detect the composition and diversity changes (Appendix 3 pp. 12–33). Cloacal swabs and fecal samples showed different trends in diversity and microbiota composition compared to intestinal mucosal samples. The alpha diversity of cloacal swab samples was significantly lower than that of intestinal mucosa samples. In contrast, the alpha diversity of fecal samples was not significantly different from that of intestinal mucosa samples. Only the relative abundance of Proteobacteria in cloacal swab samples was significantly higher than in intestinal mucosa samples, while only the relative abundance of Firmicutes in fecal samples was similar to intestinal mucosa samples. This indicated that microbial composition of intestinal samples is more comparable to cloacal samples than fecal samples. Furthermore, we did not find evidence of small-study effects and publication bias, except for relative abundance of Bacteroidetes (Appendix 3 p. 31) — Egger's regression test suggested funnel plot asymmetry (z = −3.41, p = 0.01).
3.3
Outcomes of frequentist network meta-analysis
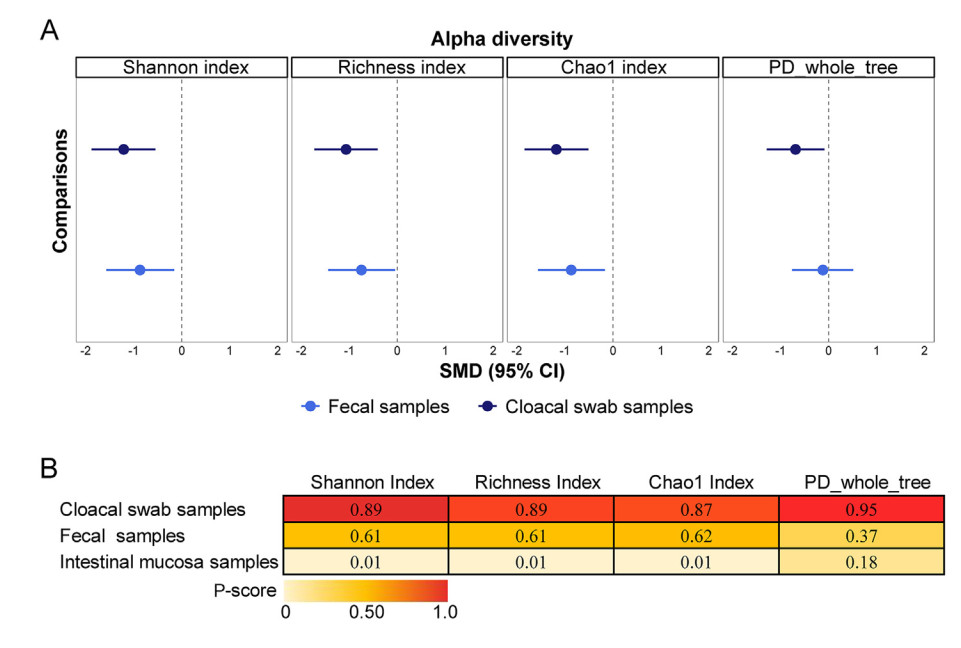
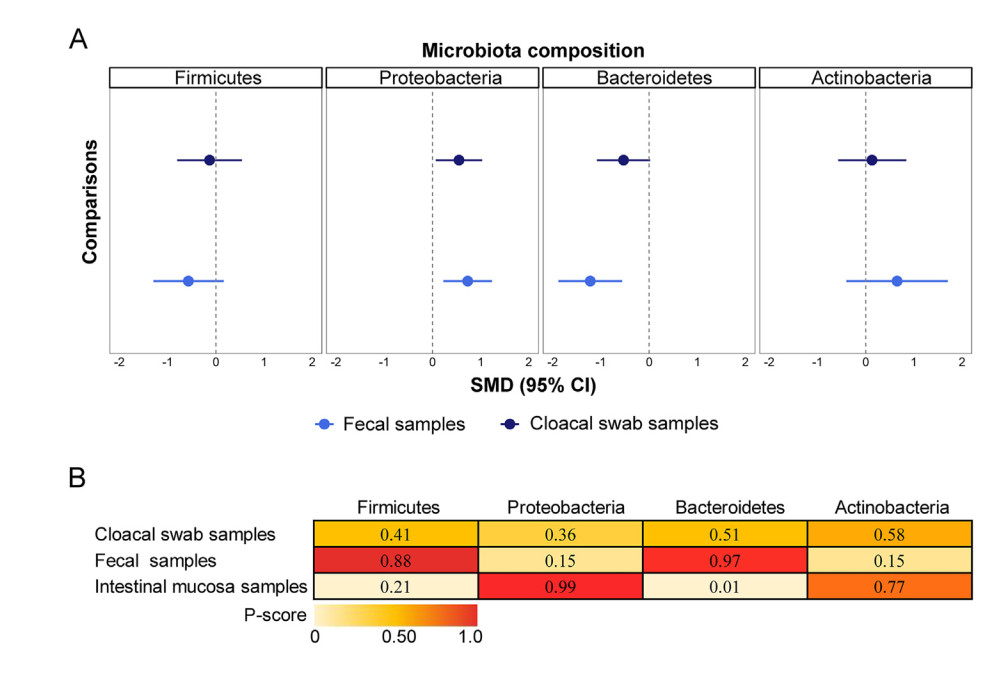
Network graphs showed the network of eligible comparisons for three sampling methods (Appendix 10 pp. 53–54). Only two studies directly compared fecal samples to cloacal swab samples, and almost all studies directly compared two types of non-invasive samples to invasive samples. P-value rankings of sampling methods for alpha diversity and taxonomic relative abundances (phylum level) of microbiota are shown collectively in a heatmap in Fig. 1, Fig. 2B, and individually in Appendix 4 pp. 35–36. Appendix 6 pp. 38–42 shows local assessments of inconsistency.
Figure
1.
The variations in alpha diversity between non-invasive and intestinal mucosal samples. Forest plots for alpha diversity differences between non-invasive and invasive sampling (A). The dotted line represents the diversity index of the intestinal mucosa samples. Crossing the dotted line means that the diversity of the sample is not significantly different from that of the intestinal mucosa samples, and falling to the left of the dotted line means that the diversity of the intestinal mucosa samples is significantly higher, and vice versa. Full results were shown in the Appendix 4 (pp. 34–35). Heat map of sampling methods ranked according to the associated degree of alteration in microbiota alpha diversity (B). Numbers reflects P-scores, which ranks antipsychotics continuously from 0 to 1. A higher P-score indicates a lower alpha diversity of microbiota.
Figure
2.
The variations in microbiota composition between non-invasive and intestinal mucosal samples. Forest plots for differences in the taxonomic relative abundances (phylum level) of microbiota between non-invasive and invasive samples (A). The dotted line represents the taxonomic relative abundances (phylum level) of the intestinal mucosa samples. Crossing the dotted line means that the taxonomic relative abundances (phylum level) of the sample is not significantly different from that of the intestinal mucosa samples, and falling to the left of the dotted line means that the taxonomic relative abundances (phylum level) of the intestinal mucosa samples is significantly higher, and vice versa. Full results were shown in the Appendix 4 (pp. 35–36). Heat map of sampling methods ranked according to the associated degree of alteration in microbiota's taxonomic relative abundances (phylum level) (B). Numbers reflect P-scores, which ranks antipsychotics continuously from 0 to 1. A higher P-score indicates a lower taxonomic relative abundance (phylum level) of microbiota.
3.4
Network meta-analysis further confirms the comparability of alpha diversity of fecal samples with intestine samples
Across the included 22 comparison subsets, which compared two different non-invasive sampling methods (560 samples) with intestinal mucosa sampling (533 samples), we examined the different outcomes of network meta-analysis for four commonly used alpha diversity indices. Overall, microbial alpha diversities in cloacal swab and fecal samples were consistently lower than in intestinal mucosa samples (Fig. 1A, Appendix 4 pp. 34–35). However, there was no significant difference in phylogenetic diversity between fecal and intestinal mucosa samples (pooled standardized mean difference [SMD] = −0.12, 95% confidence intervals [95% CIs] = −0.71 to −0.51). Overall, this suggests that the fecal samples were more similar to the intestinal samples in microbial community alpha diversities (OTU level) than the cloacal swab samples (Fig. 1B; Appendix 5 p. 37).
For the Richness index and Chao1 index, τ was 1.08 and 1.08, and I2 was 89.8% and 89.8% (both large), respectively. The Global Q Score for inconsistency was 9.07 (p = 0.0107) and 9.46 (p = 0.0088), respectively, showing global inconsistency in both diversity indices. A significant hotspot of inconsistency was identified in the Richness index with the fecal compared with the intestinal mucosa samples, including disagreements between direct and indirect evidence (Appendix 6 pp. 38–39). However, we did not find evidence of network inconsistency in the comparisons of the three sampling methods for Chao1 index (Appendix 6 p. 39). A post-hoc analysis showed that the estimated difference was broadly similar, but there was no evidence of inconsistency (Appendix 8 pp. 49–50).
For the Shannon index and PD, τ was 1.11 and 0.97, and I2 was 89.9% and 88.9% (both large), respectively. The Global Q Score for inconsistency was 4.05 (p = 0.13) and 4.60 (p = 0.1002), suggesting they are not globally inconsistent. A significant hotspot of inconsistency was identified in the PD with the fecal sample compared with the intestinal mucosa sample, including some disagreements between direct and indirect evidence (Appendix 6 pp. 39–40). However, we did not find evidence of network inconsistency in comparing the three sampling methods for Shannon index (Appendix 6 p. 38). A post-hoc analysis showed that the estimated difference was broadly similar, and inconsistency assessments did not materially change (Appendix 8 pp. 49–50). Thus, we deemed that no evidence existed for significant inconsistency in these two network meta-analysis models.
3.5
The comparison of microbiome between cloacal and intestinal samples
For the change in the taxonomic relative abundances (phylum level), four phyla showed different trends in the variation between non-invasive (fecal and cloacal swab) and invasive samples (intestinal mucosa). The relative abundance of Firmicutes and Bacteroidetes in non-invasive samples was lower than in invasive samples. On the contrary, the relative abundance of Proteobacteria and Actinobacteria was higher in non-invasive than in invasive samples (Fig. 2A; Appendix 4 pp. 35–36). In addition, the relative abundance of Proteobacteria ([SMD] = 0.73, [95% CIs] = 0.23 to 1.23) and Bacteroidetes ([SMD] = −1.22, [95% CIs] = −1.88 to −0.56) in feces was significantly different from intestinal mucosa samples. The relative abundance of Proteobacteria ([SMD] = 0.55, [95% CIs] = 0.07 to 1.03) and Bacteroidetes ([SMD] = −0.53, [95% CIs] = −1.08 to 0.02) in clocal swab samples were similar to or not significantly different from those in intestinal mucosa samples. This demonstrates that cloacal samples better represent the composition of the intestinal microbiome than fecal samples (Fig. 2B; Appendix 5 p. 37).
For the relative abundance of Firmicutes and Bacteroidetes, τ was 1.13 and 0.74, and I2 was 91.9% and 80.6% (both large), respectively. The Global Q Score for inconsistency was 5.07 (p = 0.0794) and 2.34 (p = 0.3103), suggesting they are both not globally inconsistent. No significant hotspots of inconsistency were identified in comparing the three sampling methods in the relative abundance of these two phyla (Appendix 6 pp. 40–41). However, a post-hoc analysis showed that the inconsistent assessments of the relative abundance of Bacteroidetes become diametrically opposite (Appendix 8 pp. 50–51). Overall, we concluded that inconsistency was not the main concern in this network meta-analysis.
For the relative abundance of Proteobacteria and Actinobacteria, τ was 0.70 and 1.04, and I2 was 80.2% and 86.5% (both large), respectively. The Global Q Score for inconsistency was 15.17 (p = 0.0005) and 2.77 (p = 0.2499). Significant hotspots of inconsistency were identified in the relative abundance of Proteobacteria with cloacal swabs compared with fecal or intestinal mucosa samples, showing disagreement between indirect and direct evidence (Appendix 6 pp. 40–41). Similarly, we found significant hotspots of inconsistency in both comparisons of the three sampling methods on the relative abundance of Actinobacteria (Appendix 6 pp. 41–42). However, a post-hoc analysis showed no evidence of inconsistency in the network of Actinobacteria (Appendix 8 pp. 50–51).
3.6
Effect of host lineage on differences in microbiome characterization between non-invasive and invasive methods
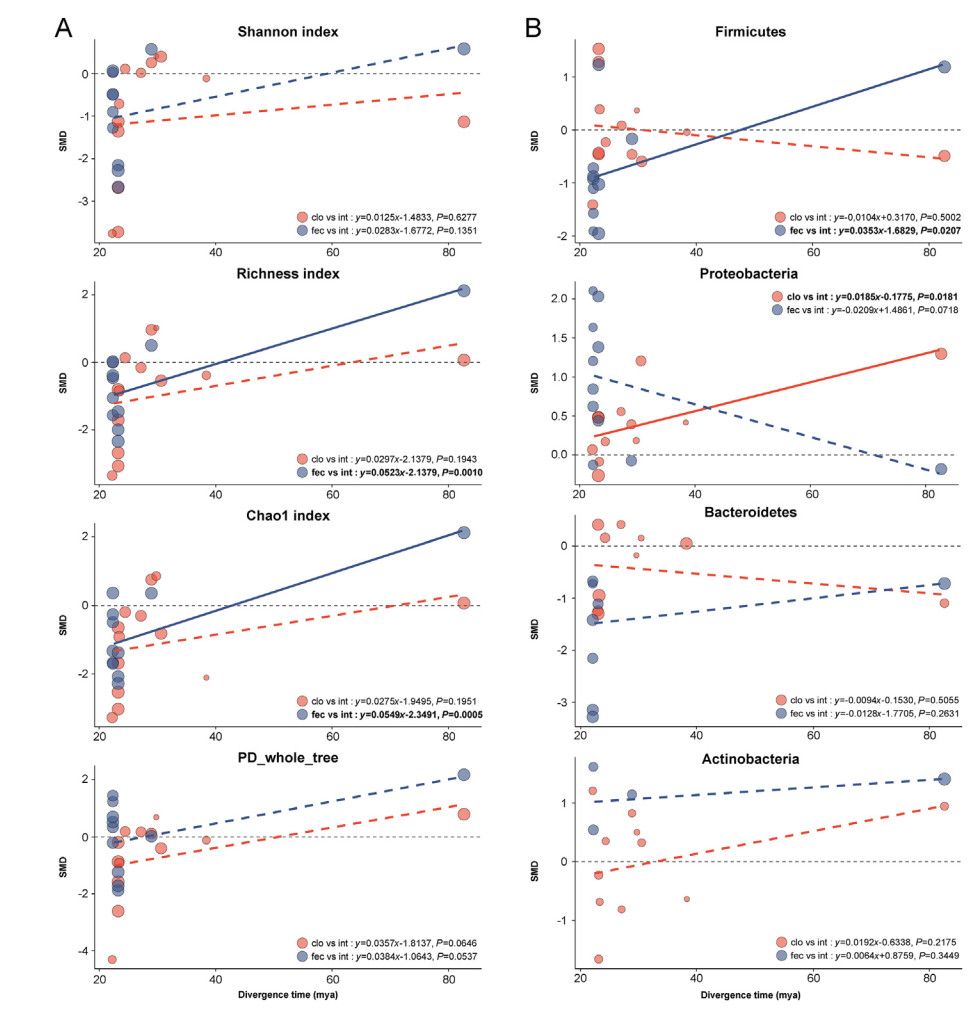
Our meta-regression analysis demonstrated that the variation of Richness index and Chao1 index between fecal samples and intestinal samples were significantly positively associated with the divergence time of the bird host. We did not find such associations in the variation of any alpha diversity indices between cloacal and intestinal samples (Fig. 3A). When comparing the relative abundance differences of bacterial phyla between invasive and non-invasive samples, the differences in relative abundance of Firmicutes between fecal samples and intestinal mucosa samples increased significantly with divergence time, while the differences in relative abundance of Proteobacteria between cloacal swab samples and intestinal mucosa samples varied significantly with the divergence time (Fig. 3B). However, it is worth mentioning that these patterns were partly caused by the results from ostriches, which had a very long divergence time compared to the other bird species included in this analysis.
Figure
3.
Bubble plots for meta-regressions. The association of divergence time with alpha diversity difference (A) and the difference in the composition of four main bacterial phyla (B). Each bubble corresponds to a study. The size of the bubble is proportional to the study weight. The solid (significant) and dotted lines (non-significant) correspond to the meta-regression estimate. The gray dashed line indicates that the effect size is 0, and the fitting line crossing the gray dashed line from below indicates that the diversity of non-invasive samples or the taxonomic relative abundances (phylum level) changes from lower than intestinal mucosa samples to higher than intestinal mucosa samples, and vice versa. SMD=standard mean difference.
3.7
Influence of domestication on microbiome differences between non-invasive and invasive samples
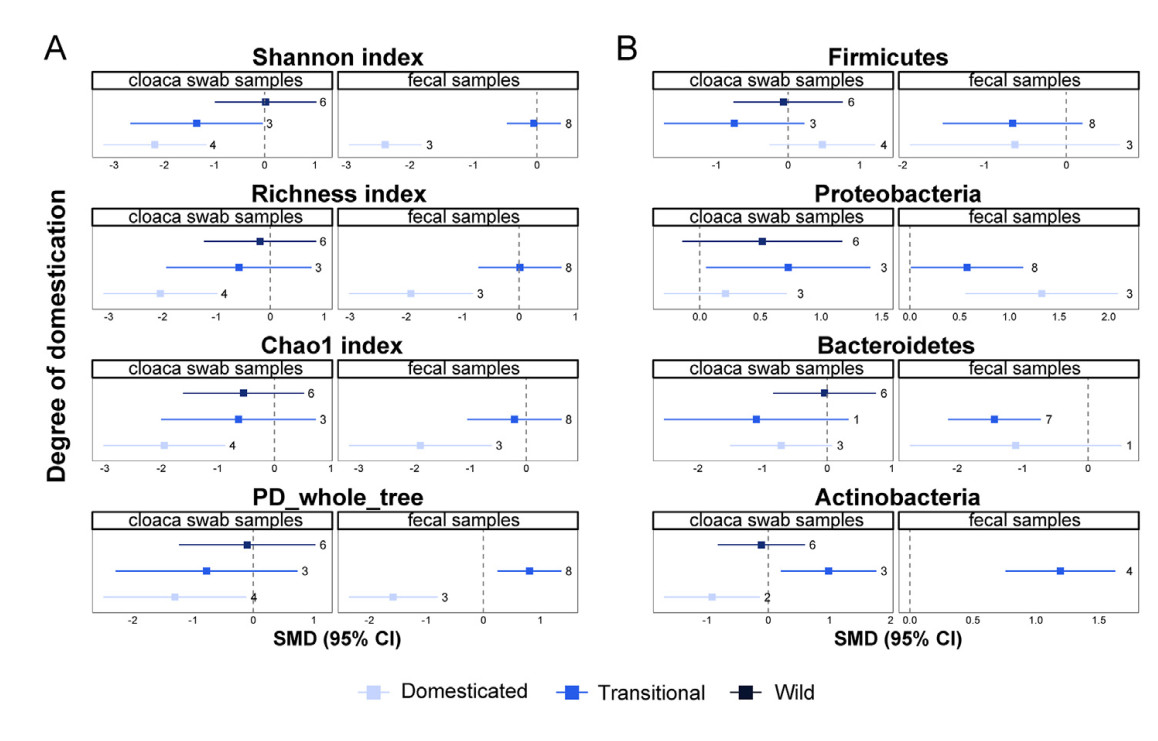
The alpha diversity in non-invasive samples was significantly lower than that of the invasive samples from the subgroup of domesticated birds (Fig. 4A). In contrast, we found no significant differences in alpha diversity between cloacal swab and intestinal mucosa samples from the wild subgroup. There was a little difference in alpha diversity between non-invasive and invasive samples from the transitional bird subgroup, except that the phylogenetic diversity of fecal samples was significantly higher than that of intestinal mucosa samples (Fig. 4A). From domesticated to transitional and wild birds, we found no significant difference in alpha diversity between invasive and non-invasive samples (Fig. 4A).
Figure
4.
Subgroup analysis of domestication degree. The effect of domestication degree on alpha diversity difference (A) and the effect of domestication degree on microbiota composition. Squares of different colors represent estimates of SMD (B). Bars around the squares denote 95% CIs. The numbers on the right side of the confidence intervals indicate the number of observations. (For interpretation of the references to color in this figure legend, the reader is referred to the Web version of this article.)
The effect of acclimation degree on the microbiota composition was inconsistent among the three types of samples (Fig. 4B). Only the relative abundance of Actinobacteria was significantly higher in non-invasive samples than in the intestinal mucosa samples (Fig. 4B). We didn't find a significant difference in the taxonomic relative abundances (phylum level) between cloacal swab and intestinal mucosa samples from the wild bird subgroup. However, the relative abundance of Proteobacteria in feces from the wild bird subgroup was higher than in intestinal mucosal samples. The relative abundance of Actinobacteria in cloacal swabs from the wild bird subgroup was lower than in intestinal mucosal samples.
3.8
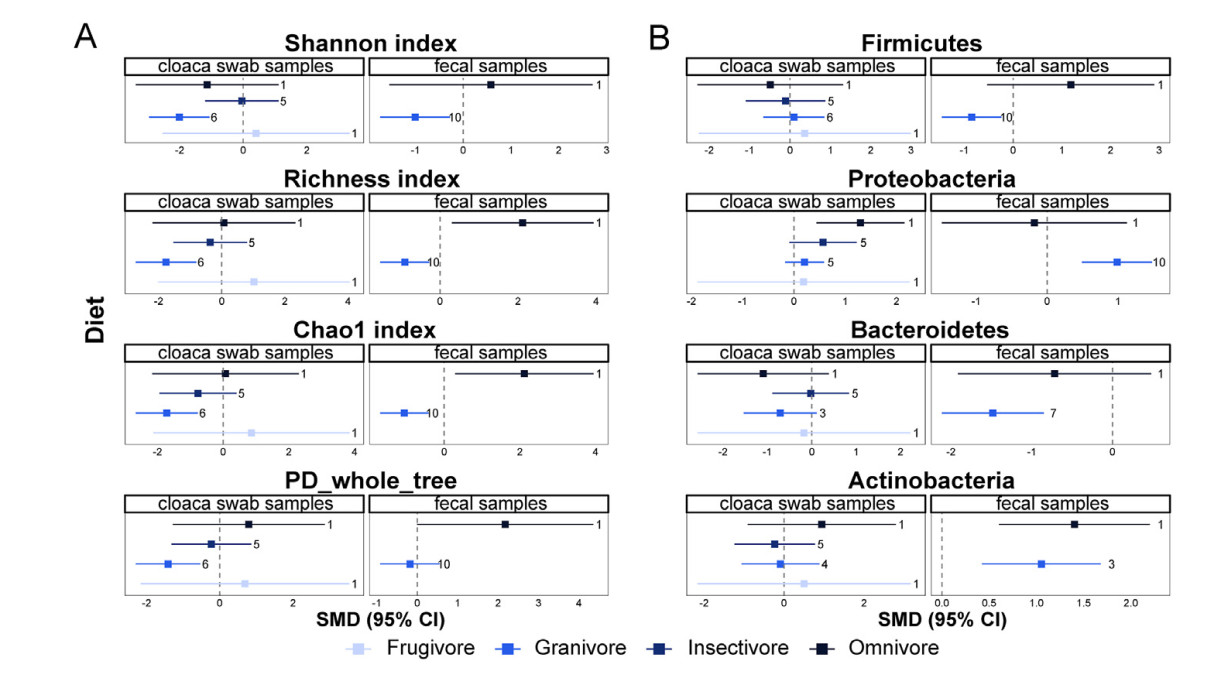
Effect of diet on microbiome differences in sampling methods
We found no significant differences in alpha diversity and microbiome composition between cloacal swab and intestinal mucosa samples from the subgroup of insectivorous birds (Fig. 5A and B). On the contrary, the alpha diversity in non-invasive samples was significantly lower than in invasive samples from granivorous birds, except for the PD between fecal and intestinal mucosa samples (Fig. 5A). This overall trend was mainly driven by the observed significant differences between fecal and intestinal mucosa samples in granivorous birds (Fig. 5A). The differences between non-invasive and intestinal mucosal samples tends to gradually decrease from granivorous to insectivorous birds, implying that dietary content and macronutrient levels (e.g., carbohydrate and protein levels) of host diets can influence the differences in microbiomes acquired from different sampling methods.
Figure
5.
Subgroup analysis of different diets of birds. The effect of diet on alpha diversity (A) and the effect of diet on microbiota composition (B). Squares of different colors represent estimates of SMD. Bars around the squares denote 95% CIs. The numbers on the right side of the confidence intervals indicate the number of observations. (For interpretation of the references to color in this figure legend, the reader is referred to the Web version of this article.)
We didn't detect significant differences in alpha diversity and microbiota composition between cloacal swab and intestinal mucosal samples from frugivorous birds. However, the relative abundance of Proteobacteria in cloacal swab samples of omnivorous birds were higher than those in intestinal mucosa samples (Fig. 5B). When looking at fecal samples we observed that the Richness index, Chao1 index, and the relative abundance of Actinobacteria in omnivorous birds were higher than in intestinal mucosa samples (Fig. 5A and B).
3.9
Publication bias and sensitivity analysis
Temporal change tests testified that there was no significant correlation between the reported pooled effect size and publication year for alpha diversities and the taxonomic relative abundances (phylum level) across all group comparisons (Appendix 9 p. 52). Comparison-adjusted funnel plots and Egger's test did not indicate that there were small-study effects in our network (Appendix 7 pp. 43–48; Salanti et al., 2014). The sensitivity for all network meta-analysis was assessed by fitting a Bayesian network meta-analysis using effect sizes based on mean difference (Efthimiou et al., 2016). The results essentially remained the same in all sensitivity analyses (Appendix 8 pp. 49–51), indicating that the inclusion of these studies did not significantly influence results.
4.
Discussions
Our meta-analyses provide a robust and generalizable assessment of the comparability of different bird gut microbiome sampling methods based on large datasets from multiple studies on various bird species. Overall, our results demonstrated that the two non-invasive sampling methods yield significantly different alpha diversities and taxonomic relative abundances compared to invasive intestinal samples. These inconsistencies indicate that a single non-invasive sampling method might not be ideal to fully characterize bird gut microbiomes, but rather a combination of non-invasive methods are needed.
4.1
Cloacal and fecal samples are better to analyze different aspects of bird microbiomes
Our results showed that the alpha diversity of microbiomes in non-invasive samples decreased consistently compared with invasive samples. Among the non-invasive sampling methods, fecal samples depicted a better potential way to reflect the microbial alpha diversity in intestinal mucosa. This finding agrees with most of the previous evaluations based on single host species, e. g., Galliformes (Pauwels et al., 2015; Stanley et al., 2015; Crisol-Martínez et al., 2016; Oakley and Kogut, 2016; Wilkinson et al., 2016; Siegerstetter et al., 2017; Yan et al., 2017, 2019; Wen et al., 2019) and Anseriformes (Xu et al., 2017). However, the overall outcome of the alpha diversity of cloacal swabs compared to intestinal samples are somewhat contradictory with studies from individual species. Aligning with our synthesis, cloacal swab samples from ostriches (Struthio camelus) had significantly lower microbial diversity than intestinal mucosal samples (Videvall et al., 2018). On the other hand, most studies from Galliformes (Andreani et al., 2020; Das et al., 2020; Lee et al., 2020) and Passeriformes (Berlow et al., 2020; Bodawatta et al., 2020) demonstrated little difference in the microbiota diversity of cloacal swab samples and intestinal mucosa samples.
Contrary to the alpha diversities, the taxonomic relative abundances (phylum level) from cloacal swabs were more comparable with intestinal mucosal samples. These results are consistent with previous studies from chickens (Gallus gallus domesticus; Andreani et al., 2020; Kang et al., 2021) and Zebra Finches (Taeniopygia guttata; Berlow et al., 2020). However, there were significant differences in microbiota composition among cloacal swab, fecal and intestinal mucosa samples from other birds of Galliformes (Zhang et al., 2017; Das et al., 2020; Lee et al., 2020; Williams and Athrey, 2020; Liu et al., 2021), Passeriformes (Bodawatta et al., 2020), and Struthioniformes (Videvall et al., 2018). Of these studies, only one study on ostrich showed that the microbiota composition of fecal samples were close to intestinal mucosa samples (Videvall et al., 2018). These heterogeneous results in microbiome differences between different sample types could be caused by differences in host evolutionary histories and ecologies, as we discuss below. Taken together, our meta-analysis indicates that alpha diversity information based on fecal samples and microbial compositional information based on cloacal swab samples tend to be representative of the intestinal microbiomes in birds. This implies that in order to characterize the bird gut microbiomes properly, without using invasive methods, we need to start sampling both fecal and cloacal microbiomes of individuals.
4.2
Phylogenetic and ecological factors influence the microbiome differences between sampling methods
Previous studies have shown that various factors, including host lineage, dietary habits, captive status, host body size, and so on, would influence the gut microbiota of vertebrates (Albenberg et al., 2014; Waite and Taylor, 2014; Hird et al., 2015; Groussin et al., 2017; Youngblut et al., 2019, 2021; Liu et al., 2020; Bodawatta et al., 2021b; Li et al., 2021). Despite these predictable differences, our results revealed some crucial consistencies across species. We demonstrated that the phylogenetic status of the host affects, to some extent, differences in alpha diversities and relative abundances of some microbial taxa between non-invasive and intestinal mucosal samples. However, we only found a significant correlation between the relative abundance of Firmicutes in cloacal samples and the divergence time, implying that the differences between cloacal swab and intestinal mucosa samples are less affected by host lineage than the differences between fecal and intestinal mucosa samples. The observed association of microbiome differences and divergence time, however, tend to be driven by ostrich in our dataset, which have one of the oldest divergence times among birds. Ostriches also have a much larger gut than other birds (Videvall et al., 2018) and previous studies have revealed that the diversity of vertebrate intestinal microbiota is positively correlated with its intestinal size (Godon et al., 2016). Therefore, this might indicate the potential influence of the interaction between host phylogeny and body sizes on the observed microbiome differences.
Among birds with different diets and degrees of domestication, there was substantial heterogeneity in intestinal microbiota between invasive and non-invasive samples. For example, the alpha diversity of non-invasive samples from the subgroup of domesticated birds was much lower than that of the invasive samples, but no significant differences in transitional and wild birds. Similar difference in the alpha diversity was observed between granivore subgroup. Interestingly, most of the species included in our study were listed in the subgroups of domesticated birds that fed on grains. Apart from that, we found a consistent trend in domesticated to transitional to wild birds or from granivores to omnivores to insectivores, where the variation in alpha diversity between invasive and non-invasive samples decreased to no significant difference. The essence of this transformation is potentially underlined by the interaction between domestication and diet. Long-term fixed dietary habits (like subgroup of domesticated birds) determine gut microbial enterotypes (Wu et al., 2011), while short-term dietary changes (like subgroup of transitional birds) may be attributed to differences in relative protein, fat and fibre content, resulting in fluctuations in certain bacterial groups in the gut (Singh et al., 2017; Bodawatta et al., 2021a). For example, a diet manipulation study on wild great tits has shown that wild bird microbiomes are highly flexible for short-term dietary changes and can recover to original microbiome compositions when the diets are restored (Bodawatta et al., 2021a). In contrary, the domesticated granivores, which are fed with the same diet throughout their life and even across generations would develop microbiomes with highly gut adapted bacterial taxa, such as Roseburia, Eubacterium rectale, and Ruminococcus bromii, that are specialized in metabolizing dietary plant polysaccharides (David et al., 2014; Ding et al., 2017). We might not capture these gut-adapted anaerobes properly with the non-invasive sampling techniques. This reveals that the diet and domestication degree as two crucial factors that we have to consider when choosing sampling methods for specific studies.
Another possible explanation for these microbiome differences associated with diet and domestication is the compartmentalization of gut microbiomes in different bird groups. Most of the domesticated-granivorous bird species in our study include bird species with highly developed ceca (Clench, 1999) with strong compartmentalization of gut microbiomes (Videvall et al., 2018; Drovetski et al., 2019). The bird species belonging to other domestication degrees and dietary guilds (e.g., Passeriformes), lack or have a reduced cecum and tend to have low levels of gut microbiome compartmentalization (Bodawatta et al., 2020, 2022b). This implies that the observed heterogeneity in microbiomes between sampling methods might be stronger in bird taxa with developed ceca compared to taxa lacking or having vestigial ceca. This suggests that we must also select our microbiome sampling method based on the gut physiology of the bird species.
4.3
Robustness and limitation
We found no inconsistency for network meta-analysis examining change in Shannon index, Chao1 index, PD, and relative abundances of Bacteroidetes and Actinobacteria, supporting the robustness of these outcomes. However, we had some concerns regarding inconsistency in the network meta-analysis of Richness index and relative abundances of Firmicutes and Proteobacteria, especially concerns for the network meta-analysis of relative abundance of Proteobacteria. These network meta-analysis showed some global inconsistency and local hotspots of inconsistency. These inconsistencies might have been secondary to the insufficient number of trials included in our study and the high heterogeneity in the model. However, our sensitivity analyses that fit a Bayesian network meta-analysis using effect sizes based on mean difference found similar results to the overall findings, and inconsistency measures were essentially unchanged, supporting the inclusion of these data in primary analyses.
There were some limitations to our analyses. The trials with large sample sizes included in this study mainly focused on captive birds. Therefore, our results are conservative in the estimation of wild birds. Further work is required to define the differences between different intestinal sampling methods of wild birds, which will better inform the study of intestinal microbiota. The alpha diversities and taxonomic relative abundances (phylum level) of each trial included in our study were obtained by processing sequence data of each trial using the same criteria in software QIIME2. Standardization of alpha diversity indices and taxonomic relative abundances (phylum level) from each study makes the estimates of these measures comparable among various studies. In addition, some data sets used in our study came from the same experiment as the researchers conducted several different treatments or used different test species, which made it difficult to combine these data sets. Data sets from the same trial may have the same bias, overestimating or underestimating the differences between the three intestinal samples.
5.
Conclusion
Our network meta-analysis revealed differences in microbiomes sampled with invasive and non-invasive methods in various bird species, which may guide us in selecting appropriate sampling methods to explore bird gut microbiomes. Although invasive sampling is the most accurate, it often requires the killing of birds, so the same individual cannot be sampled repeatedly. As a result, invasive sampling methods are difficult to apply in many current experimental designs. Cloacal swab samples were closer to intestinal mucosa samples in the microbiota composition, while fecal samples were closer to microbial alpha diversities in intestinal mucosa samples. Consequently, to avoid any biases of non-invasive sampling methods, it is recommended to utilize both cloacal swabs and fecal samples to characterize bird gut microbiomes. This is achievable considering the reducing prices and increasing efficiency of molecular work and sequencing techniques. However, if we were to choose one non-invasive sampling method over the other, we should consider several other factors, such as host clade, diet and domestication, to ensure our sampling methods are able to capture the gut microbiome diversity and compositions similar to invasive samples. In conclusion, although we confirm that non-invasive samplings can analyze the gut microbiota of birds, more robust testing is warranted to assess the effectiveness of various microbiome sampling methods.
Authors’ contributions
All authors contributed intellectual input and assistance to this study. TZ and AJ designed the research. TZ conducted literature search, data extraction and analysis. TZ wrote the first draft of the manuscript, and AJ and KHB contributed substantially to revisions. All authors read and approved the final manuscript.
Ethics statement
This study is based on the literature search and data network meta-analyses, and ethical review is not required.
The data that support the findings of this study are available in Figshare with the identifier https://doi.org/10.6084/m9.figshare.20195111. The source data for plotting figures and tables can also be archived in the above link, except for Fig. 1, Fig. 2B in the maintext of this paper and Appendix 4 Tables S3–S10, which are generated by Excel after R exports the file. The R code used to generate the results in this paper is available in Figshare with the identifier https://doi.org/10.6084/m9.figshare.20195111.
Declaration of competing interest
The authors declare that they have no competing interests.
Acknowledgements
We would like to thank Ning Yang, Wei Yan, Dragana Stanley, Guolong Zhang, Jing Liu, Giri N. Athrey, Elin Videvall, Jeff Johnson, and Yan Zhang for providing primary data for this article. This work was funded by the National Natural Science Foundation of China (31870370) and the Key Grant of Guangxi Nature and Science Foundation (2018GXNSFDA281016).
Albenberg, L., Esipova, T.V., Judge, C.P., Bittinger, K., Chen, J., Laughlin, A., et al., 2014. Correlation between intraluminal oxygen gradient and radial partitioning of intestinal microbiota. Gastroenterology 147, 1055-1063.e8.
Andreani, N.A., Donaldson, C.J., Goddard, M., 2020. A reasonable correlation between cloacal and cecal microbiomes in broiler chickens. Poultry Sci. 99, 6062–6070.
Balduzzi, S., Rücker, G., Schwarzer, G., 2019. How to perform a meta-analysis with R: a practical tutorial. Evid. Base Ment. Health 22, 153–160.
Benson, A.K., Kelly, S.A., Legge, R., Ma, F., Low, S.J., Kim, J., et al., 2010. Individuality in gut microbiota composition is a complex polygenic trait shaped by multiple environmental and host genetic factors. Proc. Natl. Acad. Sci. U.S.A. 107, 18933–18938.
Berlow, M., Kohl, K.D., Derryberry, E.P., 2020. Evaluation of non-lethal gut microbiome sampling methods in a passerine bird. Ibis 162, 911–923.
Bodawatta, K.H., Freiberga, I., Puzejova, K., Sam, K., Poulsen, M., Jønsson, K.A., 2021a. Flexibility and resilience of great tit (Parus major) gut microbiomes to changing diets. Anim Microbiome. 3, 20.
Bodawatta, K.H., Hird, S.M., Grond, K., Poulsen, M., Jønsson, K.A., 2022a. Avian gut microbiomes taking flight. Trends Microbiol. 30, 268–280.
Bodawatta, K.H., Klečková, I., Klečka, J., Pužejová, K., Koane, B., Poulsen, M., et al., 2022b. Specific gut bacterial responses to natural diets of tropical birds. Sci. Rep. 12, 713.
Bodawatta, K.H., Koane, B., Maiah, G., Sam, K., Poulsen, M., Jønsson, K.A., 2021b. Species-specific but not phylosymbiotic gut microbiomes of New Guinean passerine birds are shaped by diet and flight-associated gut modifications. Proc. R. Soc. B 288, 20210446.
Bodawatta, K.H., Puzejova, K., Sam, K., Poulsen, M., Jønsson, K.A., 2020. Cloacal swabs and alcohol bird specimens are good proxies for compositional analyses of gut microbial communities of Great tits (Parus major). Anim. Microbiome. 2, 9.
Bodawatta, K.H., Sam, K., Jønsson, K.A., Poulsen, M., 2018. Comparative analyses of the digestive tract microbiota of new guinean passerine birds. Front. Microbiol. 9, 1830.
Bolyen, E., Rideout, J.R., Dillon, M.R., Bokulich, N.A., Abnet, C.C., Al-Ghalith, G.A., et al., 2019. Reproducible, interactive, scalable and extensible microbiome data science using QIIME 2. Nat. Biotechnol. 37, 852–857.
Budding, A.E., Grasman, M.E., Eck, A., Bogaards, J.A., Vandenbroucke-Grauls, C.M., van Bodegraven, A.A., et al., 2014. Rectal swabs for analysis of the intestinal microbiota. PLoS One 9, e101344.
Capunitan, D.C., Johnson, O., Terrill, R.S., Hird, S.M., 2020. Evolutionary signal in the gut microbiomes of 74 bird species from Equatorial Guinea. Mol. Ecol. 29, 829–847.
Clench, M.H., 1999. The avian cecum: Update and motility review. J. Exp. Zool. 283, 441–447.
Crisol-Martínez, E., Moreno-Moyano, L.T., Wilkinson, N., Prasai, T., Brown, P.H., Moore, R.J., et al., 2016. A low dose of an organophosphate insecticide causes dysbiosis and sex-dependent responses in the intestinal microbiota of the Japanese quail (Coturnix japonica). PeerJ 4, e2002.
Das, Q., Islam, M.R., Lepp, D., Tang, J., Yin, X., Mats, L., et al., 2020. Gut microbiota, blood metabolites, and spleen immunity in broiler chickens fed berry pomaces and phenolic-enriched extractives. Front. Vet. Sci. 7, 150.
David, L.A., Maurice, C.F., Carmody, R.N., Gootenberg, D.B., Button, J.E., Wolfe, B.E., et al., 2014. Diet rapidly and reproducibly alters the human gut microbiome. Nature 505, 559–563.
Davidson, G.L., Wiley, N., Cooke, A.C., Johnson, C.N., Fouhy, F., Reichert, M.S., et al., 2020. Diet induces parallel changes to the gut microbiota and problem solving performance in a wild bird. Sci. Rep. 10, 20783.
DeSantis, T.Z., Hugenholtz, P., Larsen, N., Rojas, M., Brodie, E.L., Keller, K., et al., 2006. Greengenes, a Chimera-Checked 16S rRNA Gene Database and Workbench Compatible with ARB. Appl. Environ. Microbiol. 72, 5069–5072.
Ding, J., Dai, R., Yang, L., He, C., Xu, K., Liu, S., et al., 2017. Inheritance and establishment of gut microbiota in chickens. Front. Microbiol. 8, 1967.
Drovetski, S.V., O’Mahoney, M.J.V., Matterson, K.O., Schmidt, B.K., Graves, G.R., 2019. Distinct microbiotas of anatomical gut regions display idiosyncratic seasonal variation in an avian folivore. Anim. Microbiome 1, 2.
Efthimiou, O., Debray, T.P.A., van Valkenhoef, G., Trelle, S., Panayidou, K., Moons, K.G.M., et al., 2016. GetReal in network meta-analysis: a review of the methodology. Res. Synth. Methods 7, 236–263.
Gerta, R., Ulrike, K., Jochem, K., Orestis, E., Annabel, D., Theodoros, P., et al., 2021. Netmeta: Network Meta-Analysis Using Frequentist Methods. R Package Version 2.0- 1. .
Godon, J.J., Arulazhagan, P., Steyer, J.P., Hamelin, J., 2016. Vertebrate bacterial gut diversity: size also matters. BMC Ecol. 16, 12.
Grond, K., Sandercock, B.K., Jumpponen, A., Zeglin, L.H., 2018. The avian gut microbiota: community, physiology and function in wild birds. J. Avian Biol. 49, e01788.
Groussin, M., Mazel, F., Sanders, J.G., Smillie, C.S., Lavergne, S., Thuiller, W., et al., 2017. Unraveling the processes shaping mammalian gut microbiomes over evolutionary time. Nat. Commun. 8, 14319.
Higgins, J.P.T., Thompson, S.G., 2002. Quantifying heterogeneity in a meta-analysis. Stat. Med. 21, 1539–1558.
Ho, N.T., Li, F., Lee-Sarwar, K.A., Tun, H.M., Brown, B.P., Pannaraj, P.S., et al., 2018. Meta-analysis of effects of exclusive breastfeeding on infant gut microbiota across populations. Nat. Commun. 9, 4169.
Hong, P.Y., Wheeler, E., Cann, I.K.O., Mackie, R.I., 2011. Phylogenetic analysis of the fecal microbial community in herbivorous land and marine iguanas of the Galapagos Islands using 16S rRNA-based pyrosequencing. ISME J 5, 1461–1470.
Ingala, M.R., Simmons, N.B., Wultsch, C., Krampis, K., Speer, K.A., Perkins, S.L., 2018. Comparing microbiome sampling methods in a wild mammal: Fecal and intestinal samples record different signals of host ecology, evolution. Front. Microbiol. 9, 803.
Jetz, W., Thomas, G.H., Joy, J.B., Hartmann, K., Mooers, A.O., 2012. The global diversity of birds in space and time. Nature 491, 444–448.
Jones, R.B., Zhu, X., Moan, E., Murff, H.J., Ness, R.M., Seidner, D.L., et al., 2018. Inter-niche and inter-individual variation in gut microbial community assessment using stool, rectal swab, and mucosal samples. Sci. Rep. 8, 4139.
Kang, K., Hu, Y., Wu, S., Shi, S., 2021. Comparative metagenomic analysis of chicken gut microbial community, function, and resistome to evaluate noninvasive and cecal sampling resources. Animals 11, 1718.
Kembel, S.W., Cowan, P.D., Helmus, M.R., Cornwell, W.K., Morlon, H., Ackerly, D.D., et al., 2010. Picante: R tools for integrating phylogenies and ecology. Bioinformatics 26, 1463–1464.
Lee, S.J., Cho, S., La, T.M., Lee, H.J., Lee, J.B., Park, S.Y., et al., 2020. Comparison of microbiota in the cloaca, colon, and magnum of layer chicken. PLoS One 15, e0237108.
Lees, A.C., Haskell, L., Allinson, T., Bezeng, S.B., Burfield, I.J., Renjifo, L.M., et al., 2022. State of the World's Birds. Annu. Rev. Environ. Resour. 47, 231–260.
Ley, R.E., Lozupone, C.A., Hamady, M., Knight, R., Gordon, J.I., 2008. Worlds within worlds: evolution of the vertebrate gut microbiota. Nat. Rev. Microbiol. 6, 776–788.
Li, C., Liu, Y., Gong, M., Zheng, C., Zhang, C., Li, H., et al., 2021. Diet-induced microbiome shifts of sympatric overwintering birds. Appl. Microbiol. Biotechnol. 105, 5993–6005.
Liu, G., Meng, D., Gong, M., Li, H., Wen, W., Wang, Y., et al., 2020. Effects of sex and diet on gut microbiota of farmland-dependent wintering birds. Front. Microbiol. 11, 587873.
Liu, J., Stewart, S.N., Robinson, K., Yang, Q., Lyu, W., Whitmore, M.A., et al., 2021. Linkage between the intestinal microbiota and residual feed intake in broiler chickens. J. Anim. Sci. Biotechnol. 12, 22.
Oakley, B.B., Kogut, M.H., 2016. Spatial and temporal changes in the broiler chicken cecal and fecal microbiomes and correlations of bacterial taxa with cytokine gene expression. Front. Vet. Sci. 3, 11.
Pauwels, J., Taminiau, B., Janssens, G.P., De Beenhouwer, M., Delhalle, L., Daube, G., et al., 2015. Cecal drop reflects the chickens' cecal microbiome, fecal drop does not. J. Microbiol. Methods 117, 164–170.
Peters, J.L., Sutton, A.J., Jones, D.R., Abrams, K.R., Rushton, L., 2006. Comparison of two methods to detect publication bias in meta-analysis. JAMA 295, 676–680.
Peters, J.L., Sutton, A.J., Jones, D.R., Abrams, K.R., Rushton, L., 2008. Contour-enhanced meta-analysis funnel plots help distinguish publication bias from other causes of asymmetry. J. Epidemiol. 61, 991–996.
Pigot, A.L., Sheard, C., Miller, E.T., Bregman, T.P., Freeman, B.G., Roll, U., et al., 2020. Macroevolutionary convergence connects morphological form to ecological function in birds. Nat. Ecol. Evol. 4, 230–239.
Pillinger, T., McCutcheon, R.A., Vano, L., Mizuno, Y., Arumuham, A., Hindley, G., et al., 2020. Comparative effects of 18 antipsychotics on metabolic function in patients with schizophrenia, predictors of metabolic dysregulation, and association with psychopathology: a systematic review and network meta-analysis. Lancet Psychiatry 7, 64–77.
Pradhan, A.D., 2014. Sex Differences in the metabolic syndrome: implications for cardiovascular health in women. Clin. Chem. 60, 44–52.
R Core Team, 2021. R: A Language and Environment for Statistical Computing. R Foundation for Statistical Computing, Vienna, Austria. .
Ramakrishna, B.S., 2013. Role of the gut microbiota in human nutrition and metabolism. J. Gastroenterol. Hepatol. 28, 9–17.
Rothschild, D., Weissbrod, O., Barkan, E., Kurilshikov, A., Korem, T., Zeevi, D., et al., 2018. Environment dominates over host genetics in shaping human gut microbiota. Nature 555, 210–215.
Salanti, G., Del Giovane, C., Chaimani, A., Caldwell, D.M., Higgins, J.P.T., 2014. Evaluating the quality of evidence from a network meta-analysis. PLoS One 9, e99682.
Siegerstetter, S.C., Schmitz-Esser, S., Magowan, E., Wetzels, S.U., Zebeli, Q., Lawlor, P.G., et al., 2017. Intestinal microbiota profiles associated with low and high residual feed intake in chickens across two geographical locations. PLoS One 12, e0187766.
Singh, R.K., Chang, H.W., Yan, D., Lee, K.M., Ucmak, D., Wong, K., et al., 2017. Influence of diet on the gut microbiome and implications for human health. J. Transl. Med. 15, 73.
Song, S.J., Sanders, J.G., Delsuc, F., Metcalf, J., Amato, K., Taylor, M.W., et al., 2020. Comparative analyses of vertebrate gut microbiomes reveal convergence between birds and bats. mBio 11, e02901–02919.
Stanley, D., Geier, M.S., Chen, H., Hughes, R.J., Moore, R.J., 2015. Comparison of fecal and cecal microbiotas reveals qualitative similarities but quantitative differences. BMC Microbiol. 15, 51.
Stearns, J.C., Zulyniak, M.A., de Souza, R.J., Campbell, N.C., Fontes, M., Shaikh, M., et al., 2017. Ethnic and diet-related differences in the healthy infant microbiome. Genome Med. 9, 32.
Sullam, K.E., Essinger, S.D., Lozupone, C.A., O’connor, M.P., Rosen, G.L., Knight, R., et al., 2012. Environmental and ecological factors that shape the gut bacterial communities of fish: a meta-analysis. Mol. Ecol. 21, 3363–3378.
Sun, S., Zhu, X., Huang, X., Murff, H.J., Ness, R.M., Seidner, D.L., et al., 2021. On the robustness of inference of association with the gut microbiota in stool, rectal swab and mucosal tissue samples. Sci. Rep. 11, 14828.
Trevelline, B.K., Sosa, J., Hartup, B.K., Kohl, K.D., 2020. A bird's-eye view of phylosymbiosis: weak signatures of phylosymbiosis among all 15 species of cranes. Proc. Royal Soc. B 287, 20192988.
Videvall, E., Strandh, M., Engelbrecht, A., Cloete, S., Cornwallis, C.K., 2018. Measuring the gut microbiome in birds: Comparison of faecal and cloacal sampling. Mol. Ecol. Resour. 18, 424–434.
Viechtbauer, W., 2010. Conducting meta-analyses in r with the metafor package. J. Stat. Softw. 36, 1–48.
Waite, D.W., Taylor, M.W., 2014. Characterizing the avian gut microbiota: membership, driving influences, and potential function. Front. Microbiol. 5, 223.
Wen, C., Yan, W., Sun, C., Ji, C., Zhou, Q., Zhang, D., et al., 2019. The gut microbiota is largely independent of host genetics in regulating fat deposition in chickens. ISME J 13, 1422–1436.
Wickham, H., 2016. ggplot2: Elegant Graphics for Data Analysis. Springer, New York, NY. .
Wilkinson, N., Hughes, R.J., Aspden, W.J., Chapman, J., Moore, R.J., Stanley, D., 2016. The gastrointestinal tract microbiota of the Japanese quail, Coturnix japonica. Appl. Microbiol. Biotechnol. 100, 4201–4209.
Williams, T., Athrey, G., 2020. Cloacal swabs are unreliable sources for estimating lower gastro-intestinal tract microbiota membership and structure in broiler chickens. Microorganisms 8, 718.
Wu, G.D., Chen, J., Hoffmann, C., Bittinger, K., Chen, Y.Y., Keilbaugh, S.A., et al., 2011. Linking long-term dietary patterns with gut microbial enterotypes. Science 334, 105–108.
Xu, J., Lawley, B., Wong, G., Otal, A., Chen, L., Ying, T.J., et al., 2020a. Ethnic diversity in infant gut microbiota is apparent before the introduction of complementary diets. Gut Microbes 11, 1362–1373.
Xu, L.L., Chen, H., Zhang, M., Zhu, W., Chang, Q., Lu, G., et al., 2020b. Changes in the community structure of the symbiotic microbes of wild amphibians from the eastern edge of the Tibetan Plateau Microbiol 9, e1004.
Xu, Q., Yuan, X., Gu, T., Li, Y., Dai, W., Shen, X., et al., 2017. Comparative characterization of bacterial communities in geese fed all-grass or high-grain diets. PLoS One 12, e0185590.
Yan, W., Sun, C., Yuan, J., Yang, N., 2017. Gut metagenomic analysis reveals prominent roles of Lactobacillus and cecal microbiota in chicken feed efficiency. Sci. Rep. 7, 45308.
Yan, W., Sun, C., Zheng, J., Wen, C., Ji, C., Zhang, D., et al., 2019. Efficacy of fecal sampling as a gut proxy in the study of chicken gut microbiota. Front. Microbiol. 10, 2126.
Yang, Z., Rannala, B., 2005. Bayesian estimation of species divergence times under a molecular clock using multiple fossil calibrations with soft bounds. Mol. Biol. Evol. 23, 212–226.
Youngblut, N.D., Reischer, G.H., Walters, W., Schuster, N., Walzer, C., Stalder, G., et al., 2019. Host diet and evolutionary history explain different aspects of gut microbiome diversity among vertebrate clades. Nat. Commun. 10, 2200.
Zhang, Y., Simon, S.E., Johnson, J.A., Allen, M.S., 2017. Spatial microbial composition along the gastrointestinal tract of captive attwater's prairie chicken. Microb. Ecol. 73, 966–977.

 DownLoad:


 Email Alerts
 RSS Feeds