Theria Ecologie, 6 avenue des martyrs, 05400, Veynes, France
b.
UMR 6249 Chrono-Environnement, CNRS, Université de Franche-Comté, 16 route de Gray, 25000, Besançon, France
c.
Conservatoire d'Espaces Naturels d'Occitanie, 26 allée de Mycènes, 34000, Montpellier, France
d.
Office Français de la Biodiversité, 12 cours Lumière, 94300, Vincennes, France
e.
Tour du Valat Research Institute for the Conservation of Mediterranean Wetlands, Le Sambuc, 13200, Arles, France
Funds:
the French Ministry of Ecological Transition through the Direction Régionale de l'Environnement, de l'Aménagement et du Logement d'Occitanie, the Office Français de la Biodiversité, and the Conservatoire d'Espaces Naturels d'Occitanie
Reedbeds are crucial breeding habitats for vulnerable songbird species. Irrespective of their protection status, these habitats may be threatened by organic matter accumulation, progressively leading to structural homogenization and habitat succession towards woodland. Managers prevent excessive litter build-up with various interventions opening-up the reedbeds, such as grazing, which may be detrimental or suitable for some reed bird species. We assessed the effects of extensive grazing by horses and its cessation in the medium and long terms on reedbed structure, and the consequences on reed-nesting songbird densities in Estagnol Nature Reserve, a protected wetland near the French Mediterranean coast. We compared reedbed structural features between grazed, newly ungrazed and old-ungrazed plots. During nine years, we censused four songbird species in spring and collected water level data in the same survey plots. Grazing reduced reedbed extent, rejuvenated the vegetation with more short green stems on a thinner litter, and produced higher structural heterogeneity and discontinuity compared to long-lasting non grazing. Newly ungrazed plot showed intermediate effects. All surveyed songbird total densities were similar among plots while species numbers and densities differed. Grazed reedbed was more attractive to Moustached Warblers (Acrocephalus melanopogon) and Great Reed Warblers (Acrocephalus arundinaceus), likely due to the large edges and the high vegetation structural heterogeneity. However, Moustached Warblers were more negatively affected by higher water level in grazed reedbed, presumably because flooding prevents litter foraging. The newly ungrazed reedbed was not preferred by any species. All warbler species were found under low density in the old-ungrazed reedbed, where Reed Buntings (Emberiza schoeniclus) were exclusively found. Food availability related to thick litter layer may explain this predilection. Common Reed Warblers (Acrocephalus scirpaceus) were found everywhere in similar densities. We conclude that reedbed management by extensive horse grazing and also its long-term cessation may benefit several songbird species. Within a context of wetland degradation and disappearance, both management strategies are useful to establish and maintain suitable habitats for reed-nesting songbird communities.
Reedbeds, generally characterized by homogeneous and monospecific stands of the perennial Common Reed (Phragmites australis), are home to a unique and outstanding biodiversity worldwide, particularly regarding birds (Dudgeon et al., 2006). Unfortunately, most of them have already been lost during the past century due to conversion into agricultural lands and draining, while many of the remaining ones are degraded, fragmented and threatened by climate change-related drought and urban or tourism development (Middleton and Kleinebecker, 2012; Davidson, 2014; Lefebvre et al., 2019) and often fail to re-establish (Vermaat et al., 2016).
Reedbeds also face advancement of their aging in the absence of certain natural dynamic processes or human uses (Battisti et al., 2020). As Common Reed is a highly productive plant of high density that generates a lot of biomass (Packer et al., 2017), reedbeds represent in general the early stages of ecological succession from open water to woodland following unregulated eutrophication and accumulation of organic matter (Andersen et al., 2021). This organic matter constitutes a litter mainly composed of shed leaves which accumulate at the end of the growing seasons. Thus, reedbeds tend to gradually dry out, to become homogeneous and then to be colonized by grasses, shrubs and trees leading to their aging and ultimately to their disappearance (Ostendorp, 1993).
To halt this decline, many remaining reedbeds in Europe have been designated as protected areas benefitting from management plans (Čížková et al., 2023). To slow down or reverse the vegetative succession, restore structural heterogeneity and so preserve the long-term integrity of the reedbeds, managers prevent excessive litter build-up with various interventions such as periodical reed flooding, cutting, burning, grazing, grinding and excavation (Middleton et al., 2006; Ausden, 2007). These management actions may modify habitat structural continuity, creating permanent or periodical open water areas, and alter vegetation structure, density and biomass (Christensen, 1997; Andersen et al., 2021). The effects of management actions depend on their type, frequency and spatial extent (McCabe and Gotelli, 2000).
European reedbeds host rich avifauna diversity and represent crucial nesting habitats for several strict reed specialist birds that include vulnerable species of high conservation priority (Poulin, 2001; Bozó, 2020; IUCN, 2023). Nesting habitat selection by these birds depends on vegetation structure, patch size, edge length, water level fluctuation, and external features, i.e., patch isolation and surrounding landscape (Foppen et al., 2000; Poulin et al., 2002; Surmacki, 2004; Báldi, 2006; Laikun et al., 2021). Sensitivity to these different habitat features when establishing a breeding territory is species-specific according to ecological niche breadth (Tscharntke, 1992; Henle et al., 2004; Koma et al., 2021).
Considering that habitat features are key components in habitat selection, influencing bird abundance and breeding success (e.g., Martínez-Vilalta et al., 2002; Vadász et al., 2008), a deep understanding of the relationships between birds and management-induced reedbed structure is essential for an effective and relevant avian conservation (Pearce-Higgins and Grant, 2006; Musseau et al., 2021).
Wetland managers rely on studies on reedbed changes subject to management treatments to guide their choices regarding conservation strategies and objectives. Thus, the aim of this study was to assess the effects of grazing and its cessation in the medium and long terms on reed-nesting songbird densities to provide some elements for management guidelines. We focused on four representative songbird species of European reedbeds. In this work, we: (ⅰ) assessed the impacts of the different treatments on reedbed structure; (ⅱ) tested the effects of these treatments with monthly variations of water levels on songbird densities; (ⅲ) discussed the relationships between reedbed structure and songbird densities, and the related conservation implications.
2.
Materials and methods
2.1
Study site
The study was performed in the Estagnol Nature Reserve (43°32ʹ N, 03°50ʹ E), a protected slightly brackish marsh belonging to a network of wetlands along the Mediterranean coast of France (Fig. 1). The site is a former saltpan composed of reedbeds (dominated by Phragmites australis), open water areas, wet meadows (communities of Molinio-Holoschoenion and Isoeto-Nanojuncetea), riparian forests (Populus alba, Fraxinus angustifolia and Ulmus minor), and a network of channels periodically connected with a coastal lagoon; it is situated within an agricultural landscape with a high human population density. Rainfall with runoff and one spring supply the wetland with freshwater. The site is under Mediterranean climate, with low rainfall and high temperatures in summer favoring complete evaporation in July–August, whereas high autumn rainfall contributes to increase water levels in October–November, keeping the marsh flooded until spring. Rainfall pattern may be variable from year to year. The temporary water drawdown alleviates the effects of eutrophication and organic matter accumulation by favoring its decomposition and mineralization (Alvarez et al., 2005).
Figure
1.
Map of the study area. Yellow polygon delimits the Estagnol Nature Reserve. The four surveyed plots are represented by colors indicating management treatment. Open water areas are uncolored. Bottom right corner: map of western Europe, with study area indicated by the black square. (For interpretation of the references to color in this figure legend, the reader is referred to the Web version of this article.)
The marsh was classified as a nature reserve in 1975. At that time, all the marsh was covered with reeds. A first management plan aimed at creating some open water areas for duck populations, translating into ponds excavating between 1978 and 1982. During the 1990s, all the reedbed area was mowed or grinded with a cage-wheel tractor, without plant material removal, and Camargue Horse (Equus caballus) grazing was used to limit reed regrowth and keep the reedbed open. From 1999, a grazing plan define spatial grazing pressures in fenced plots according to rotational system, where a small part of the reedbed is left unmanaged, in order to break up reedbed homogeneity. The herd, composed of 12–14 mares (without chemical agent in their sanitary treatment to avoid any negative impact on dung insects communities, see Jochmann and Blanckenhorn, 2016), grazes during 4 separate periods of 2–4 weeks in a same plot between late May and late February of the next year. Grazing pressure is very extensive with 0.24 horses × day/ha/year on average (ca. 0.39 livestock units/ha/year). In 2010, the grazing was stopped in some of the plots to minimize human interventions in the reserve and permit a natural development of reeds.
The reedbed covers an area of 56.1 ha divided into 11 plots separated by channels. Vegetation is grazed since 1994 in five plots, ungrazed since 2010 in four plots, and ungrazed since 1999 in two plots. All different plots are situated close together and constitute patchy stands of reeds with comparable hydrological and sedimentary conditions (only topography slightly varies depending on management treatment).
For the survey, we selected two grazed plots that we next considered as only one discontinuous grazed plot due to their reduced reedbed extents (cumulatively 12.6 ha total; 3.2 ha reedbed – 25.4%), one plot ungrazed since 2010 (4.5 ha total; 3.2 ha reedbed – 71.1%) and one plot ungrazed since 1999 (7.3 ha total; 6.7 ha reedbed – 91.8%). These three management treatments were thereafter referred to as 'grazed', 'newly ungrazed' and 'old-ungrazed' (Fig. 1).
2.2
Reedbed structure
We used a multispectral orthophotography with 10-cm spatial resolution to describe the reedbed structural discontinuity (edge complexity and internal fragmentation rate). We processed the orthophotography by using QGIS software (version 3.10.9) with the 'Semi-Automatic Classification' plugin (Congedo, 2018). First, we differentiated reedbed and open areas (bare ground in dry season during image acquisition, corresponding to open water in wet season) based on its spectral signature (Tuominen and Lipping, 2016). Reference spectral channels (region of interest) were configured and associated to both classes. The whole study area was classified by the algorithm to the 'nearest neighbor', i.e., by assigning to each pixel the class with the lowest Euclidean distance between its spectral signature and the references. Isolated polygons of reeds ≤1 m2 were converted as open area because they were not considered as forming a reedbed. Then, for each class polygon we calculated its edge complexity index, i.e., the measured perimeter compared to the theoretical perimeter of a circle of the same area as the polygon, using the following formula:
I=1−[2π√AπPolygonperimeter]
where A is the area of the polygon (the closer the value is to 0, the simpler the polygon).
For the calculation of this edge complexity index at the plot scale, we only considered the reedbed-open area edge of the internal part of plot (i.e., length of reedbed-channel edge was removed) and open area polygons whose areas were > 3 m2 or 2–3 m2 with a complexity over 0.5.
We calculated the internal fragmentation rate of the reedbed at the plot scale by integrating all open area polygons smaller than 3 m2 and having a complexity below 0.5 within the reedbed polygons. The obtained rasters were analyzed with the GuidosToolbox software to calculate the rate (Graphical User Interface of Image Objects and their Shapes, version 2.9; see Vogt and Riitters, 2017).
To characterize the vegetation structure, each of the four selected plots was divided into 30 parts whose size varied according to the plot size after removal of a 5m-wide internal buffer area around the plot to avoid any external edge effect unrelated to management (sample size based on power tests obtained from previous sampling with the 'pwr' and 'effsize' R packages; see Ferguson, 2009; Champely, 2017; Torchiano and Torchiano, 2020; R Core Team, 2021). Within each part, we randomly placed a 0.25 m × 0.25 m sampling plot on reed tussock where eight variables were measured: number of dry stems (ind./0.252 m2), number of green stems (ind./0.252 m2), basal diameter (mm) and height (cm) of the highest stem, diameter (mm) and height (cm) of the green stems located at each corner of the plot, number of flower heads (panicle), and litter height (cm).
These surveys on reedbed structure took place in June–July during the reed growth period and at the end of the birds breeding season to limit disturbance, and were carried out in 2020, i.e., after ca. 25 years of regular grazing in the grazed plot, and about 10 and 20 years without grazing in the newly ungrazed and the old-ungrazed plots, respectively.
2.3
Birds census
We surveyed a set of four reed-nesting songbird species representative of European reedbeds: Great Reed Warbler (Acrocephalus arundinaceus), Common Reed Warbler (Acrocephalus scirpaceus), Moustached Warbler (Acrocephalus melanopogon), and Reed Bunting (Emberiza schoeniclus). These species are present in the Estagnol wetland in important densities at the level of the French Mediterranean area (Table 1). The two reed warblers are trans-Saharan migrants, while the other two species are sedentary or partial migrants in the study area (Issa and Muller, 2015). All these species have experienced a decline in recent years (Alambiaga et al., 2021; Burfield et al., 2023) and are categorized as 'Least Concern' by the International Union for the Conservation of Nature (IUCN, 2023). Their presence is considered as an indicator of the ecological status of a reedbed (Morganti et al., 2019).
Table
1.
Densities of study species in the Estagnol Nature Reserve estimated using transect counts and distance sampling method with 'Rdistance' R packages (McDonald et al., 2023) from 2017 to 2023.
N
Specific model selected by AICc criteria
Density (ind./ha)
95% CI
LCL
UCL
Great Reed Warbler
234
Gamma function with 2 orders of cosine adjustment
0.290
0.210
0.390
Common Reed Warbler
408
Hazard-rate function with 3 orders of cosine adjustment
0.380
0.210
0.520
Moustached Warbler
459
Gamma function
0.460
0.390
0.540
Reed Bunting
19
Gamma function
0.024
0.009
0.043
N = sample size. CI = Confidence Interval; UCL = Upper Confidence Limit; LCL = Lower Confidence Limit.
To determine the presence and to acquire the densities for each target species in each study plot, we used a mapping method (Bibby et al., 2000) where we considered only singing birds, as singing delimits territories (Anich et al., 2009). During the breeding season (late March to early July) from 2015 to 2023, three visits at one-month intervals on average with a comparable sampling effort (ca. 2 h per visit) were carried out by the same observers and only during good weather conditions, i.e., no wind or rain, to ensure good species detection. During each visit, the observers collected data following non-linear transects around each plot (3.2 km-long in total) at constant speed, in the early morning right after dawn when singing activity was maximal. Contacts with each singing individual were noted and their positions reported on a numerical map on a smartphone application (Open Data Kit software installed on android). We kept contacts within the 5 m-wide internal buffer area around the plot as territory sizes exceed this area (Catchpole, 1972; Glutz von Blotzheim and Bauer, 1997; Monrós et al., 2023). We assumed that the detection probability of each species was identical in all plots.
At the end of each fieldwork season, singing males of each species were mapped following the clustering procedure adapted from Bibby et al. (2000), with two contacts less than 30 m apart at two different visits being considered as the same individual, and attributed to plots. For each species and each plot, we obtained the occurrence or absence of potential breeders and their density (total number of singing males/ha of reedbed).
2.4
Statistical analyses
Parametric tests were used when data distribution satisfied the assumptions of normality (Shapiro-Wilk test) and homoscedasticity (Bartlett test). Otherwise, data was log- or square-transformed or we applied non-parametric statistics.
To examine the effects of management treatments (as fixed factor) on vegetation structural features (dependent variables) of each sampling plot, we first used Generalized Linear Models (GLM) with F-test. Gaussian or quasi-Poisson family functions were used depending on variables. Then, the Spearman rank correlation test was used to detect possible correlations between these variables. Correlation coefficients rs between two variables ≥0.70 were considered high (Mukaka, 2012). In such cases, we removed the least predictable variables by management (highest deviances) for further analysis to avoid multicollinearity. A Principal Component Analysis (PCA) was then performed to represent the inter-relationships between best predictable variables of the data matrix and to segregate the three management treatments based on their vegetation-related structures. Factors generated by the PCA with eigenvalues > 1 were used as characteristic structural traits of reedbed vegetation.
To assess the vegetation structural heterogeneity in each plot, we built a dendrogram of clusters of homogeneous vegetation structure, based on the set of variables, applying a Hierarchical Ascending Classification (HAC) with the Ward's method (Ward, 1963). This method allows to view hierarchical links between sampling plots and to aggregate the most similar classes based on their vegetation structure. The clusters, delimiting vegetation structural homogeneity areas, were then reported on a map to represent the structural heterogeneity at plot-scale (Fig. 2). The areas of the clusters were computed and then, for each plot, we calculated the heterogeneity Shannon index (He; Farina, 1995), as:
He=−∑fr*ln(fr)
where fr is the relative frequency of the homogeneity clusters on the plots.
Figure
2.
Maps of the vegetation structural homogeneity clusters defined by the Hierarchical Ascending Classification in each surveyed plot. The nine different clusters were identified and symbolized with colors. Uncolored areas depict water. (For interpretation of the references to color in this figure legend, the reader is referred to the Web version of this article.)
Next, we determined whether the management treatments, associated or not with annual mean water levels in early February, March, April and May in each plot (measured with gauging stations), could explain and predict species-specific songbird density by performing Poisson distribution Generalized Linear Mixed Models (GLMM) with a log-link function and a stepwise procedure. We used the abundance of singing males as a dependent variable with the log-transformed reedbed size as offset. We used the Akaike Information Criterion (AIC) to select the models that best fitted the data. Correction of Akaike's index (AICc) for small sample sizes was performed and we considered models with the lowest AICc and the ΔAICc < 2 as the best models (Burnham and Anderson, 2002).
The means of the different dependent variables (vegetation structural features, bird densities) between the plots based on their treatment were compared by performing analysis of variance (ANOVA) and Tukey post-hoc tests or Kruskal-Wallis and Dunn post-hoc tests depending on whether or not the use conditions of the parametric test were met.
Overall, reedbeds exhibited dissimilar structures depending on their management treatment. The structural variables with their mean and standard deviation values are given in Tables 2 and 3 when applicable.
Table
2.
Reedbed structure features (vegetation heterogeneity expressed by Shannon index and reedbed structural discontinuity) for the three management treatments.
Table
3.
Mean and standard deviation (SD) of the vegetation structure variables measured in each plot according to the management treatment. Effect of management (fixed factor in GLM) on each variable is indicated by F-test result with its p-value and model deviance.
Regarding the reedbed structural discontinuity, the internal fragmentation rate was higher in the grazed (88.8%) than in the newly ungrazed (59.0%) plot (χ2 = 21.59, df = 1, p < 0.001) and old-ungrazed (60.6%) plot (χ2 = 19.66, df = 1, p < 0.001), although the edge complexities appeared to be analogous with a slight gradient from high in the old-ungrazed plot to very high in the grazed plot (Table 2).
We found highly significant differences in vegetation structural features between management treatments, except for dry stem and flower densities (Table 3). Total reed density only slightly differed (ANOVA: F = 4.27, df = 2, p = 0.016). Mean reed stem height and diameter were smaller in the grazed plot than in the newly ungrazed (Tukey's test: p < 0.001) and old-ungrazed plots (Tukey's test: p < 0.001). These two variables appeared to be highly correlated with their maximum measures (rs = 0.86 and rs = 0.69, p < 0.001, respectively). Green stem density in the newly ungrazed plot was lower than in grazed plot (Tukey's test: p < 0.001), but the ratio of dry vs. total stem number did not differ between these two management treatments (Dunn's test: z = 1.82, p = 0.067). In the old-ungrazed plot, this ratio was higher (Dunn's test: p < 0.001 for both), while the green stem density was lower than in the other plots (Tukey's test: p < 0.05 for both). The amount of litter was significantly larger in the old-ungrazed plot than in the grazed plot (Tukey's test: p < 0.001), with intermediate and not significantly different values in the newly ungrazed plot (Tuckey's test: p = 0.17 and p = 0.13).
Vegetation structural heterogeneity according to Shannon index was high and increasing from newly ungrazed to old-ungrazed and grazed plots (Fig. 2; Table 2).
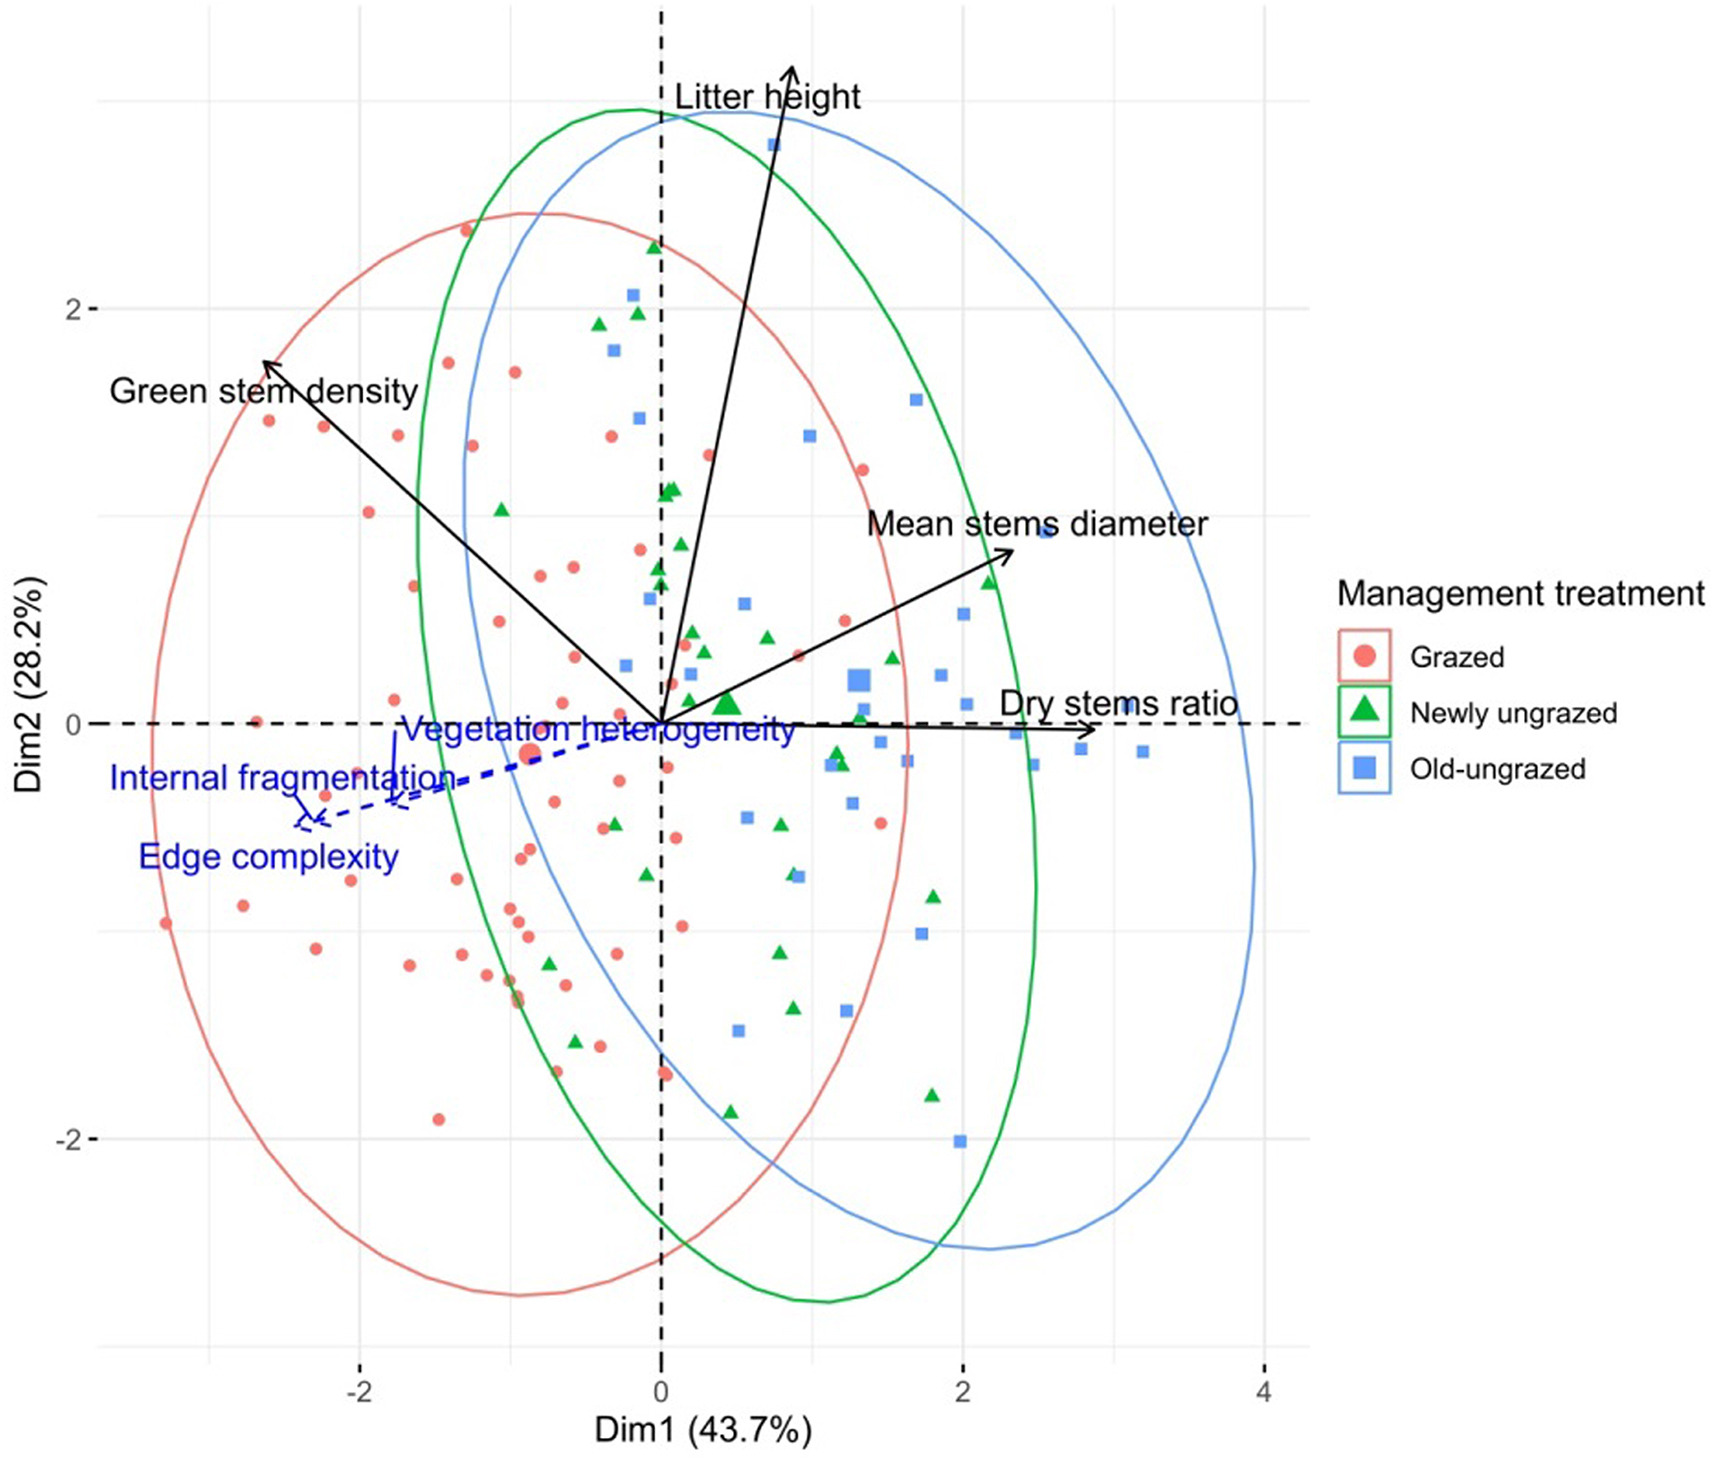
After testing collinearity among variables (Appendix Table S1), we retained four of them to perform the PCA: mean stems diameter, green stem density, litter height and dry to total stems ratio. Vegetation structural heterogeneity, internal fragmentation rate and edge complexity are indicated in Fig. 3 but not included in the calculation of the PCA axes. The two first axes explained 71.9% of the variance. The first axis represents the reed aging through the contribution of the dry stems ratio and the mean stems diameter (43.7% of the explained variance). The second axis is mostly related to the amount of litter (28.2% of the explained variance). Litter thickness tends to decrease as discontinuity increases.
Figure
3.
Projections of the reedbed vegetation structure variables and sampling plots on the first two axes of the Principal Component Analysis according to the management treatment. The variables indicated in blue dotted lines did not participate in the calculation of the axes. Each management treatment is indicated by a specific symbol and clustered in an ellipse. Grazed (n = 60); Newly ungrazed (n = 30); Old-ungrazed (n = 30). (For interpretation of the references to color in this figure legend, the reader is referred to the Web version of this article.)
The two axes discriminated reedbeds according to their management treatment: (1) old-ungrazed reedbed mainly made of high and broad dry stems on a thick litter; (2) grazed reedbed made of a fragmented and heterogeneous stand with dense short and thin green stems mixing with some bigger dry stems on a thinner litter layer; and (3) newly ungrazed reedbed being on the overlapping area between the two first categories (Fig. 3).
3.2
Effects of management on songbird densities
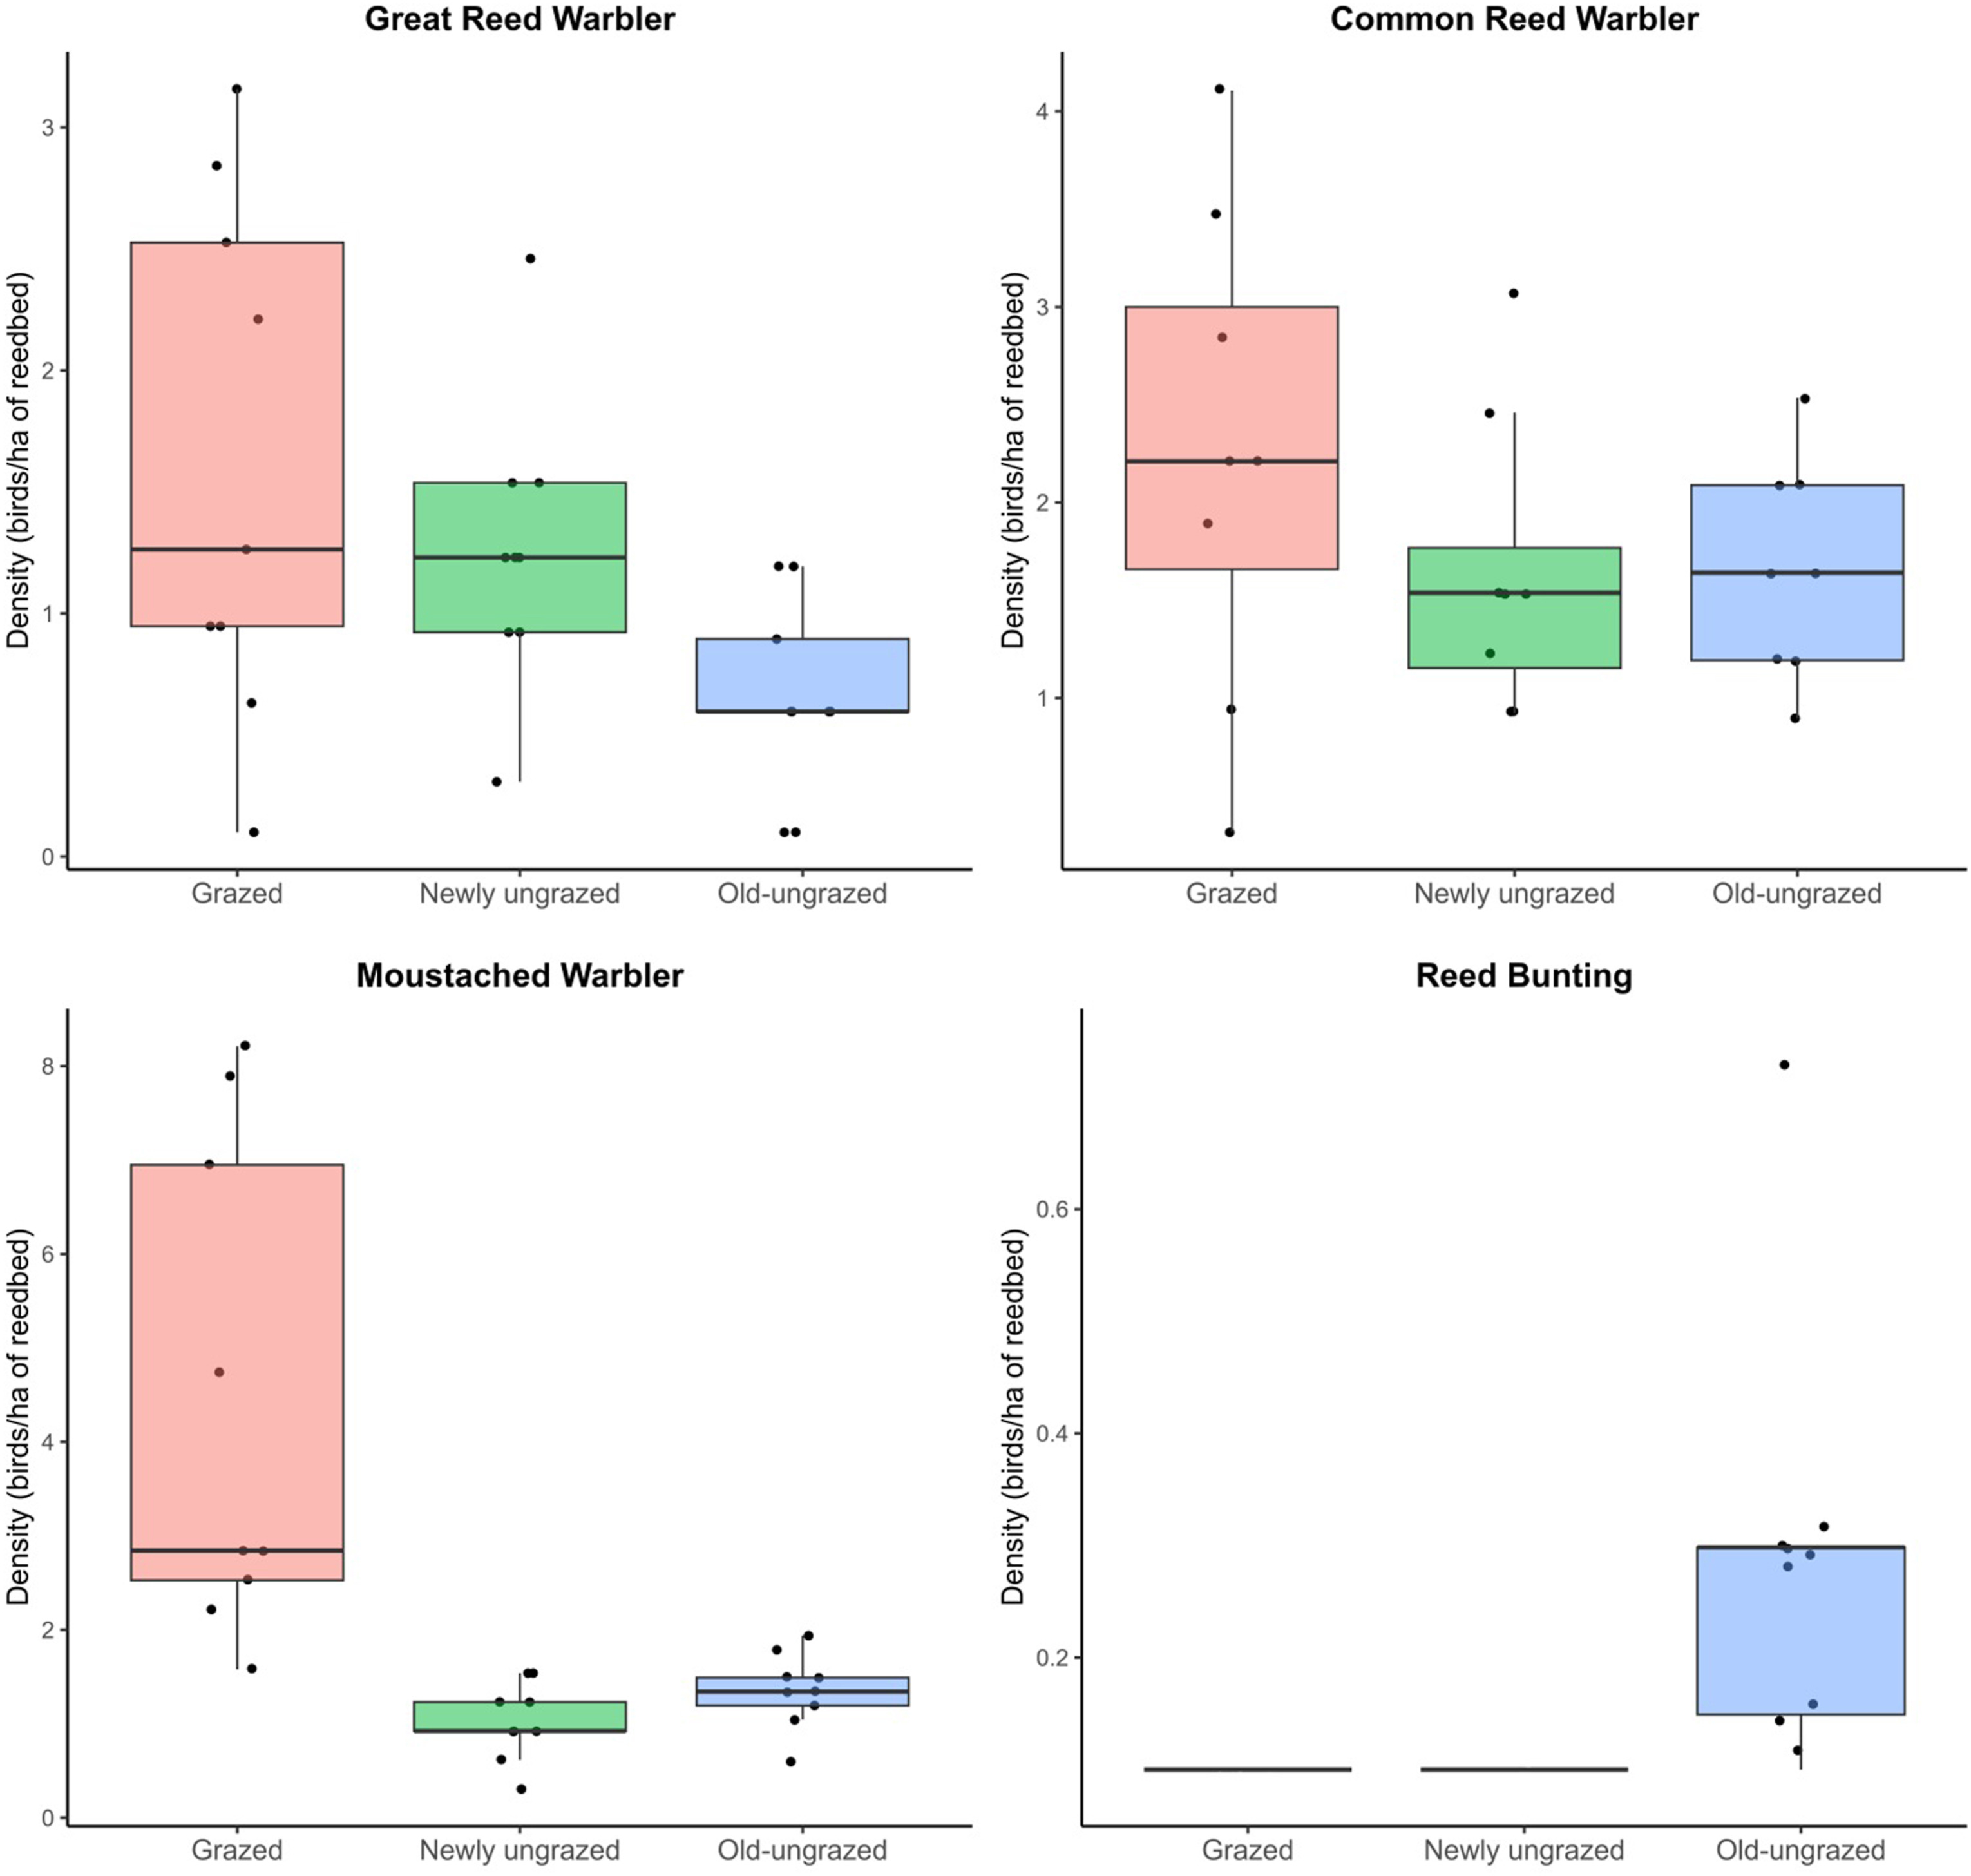
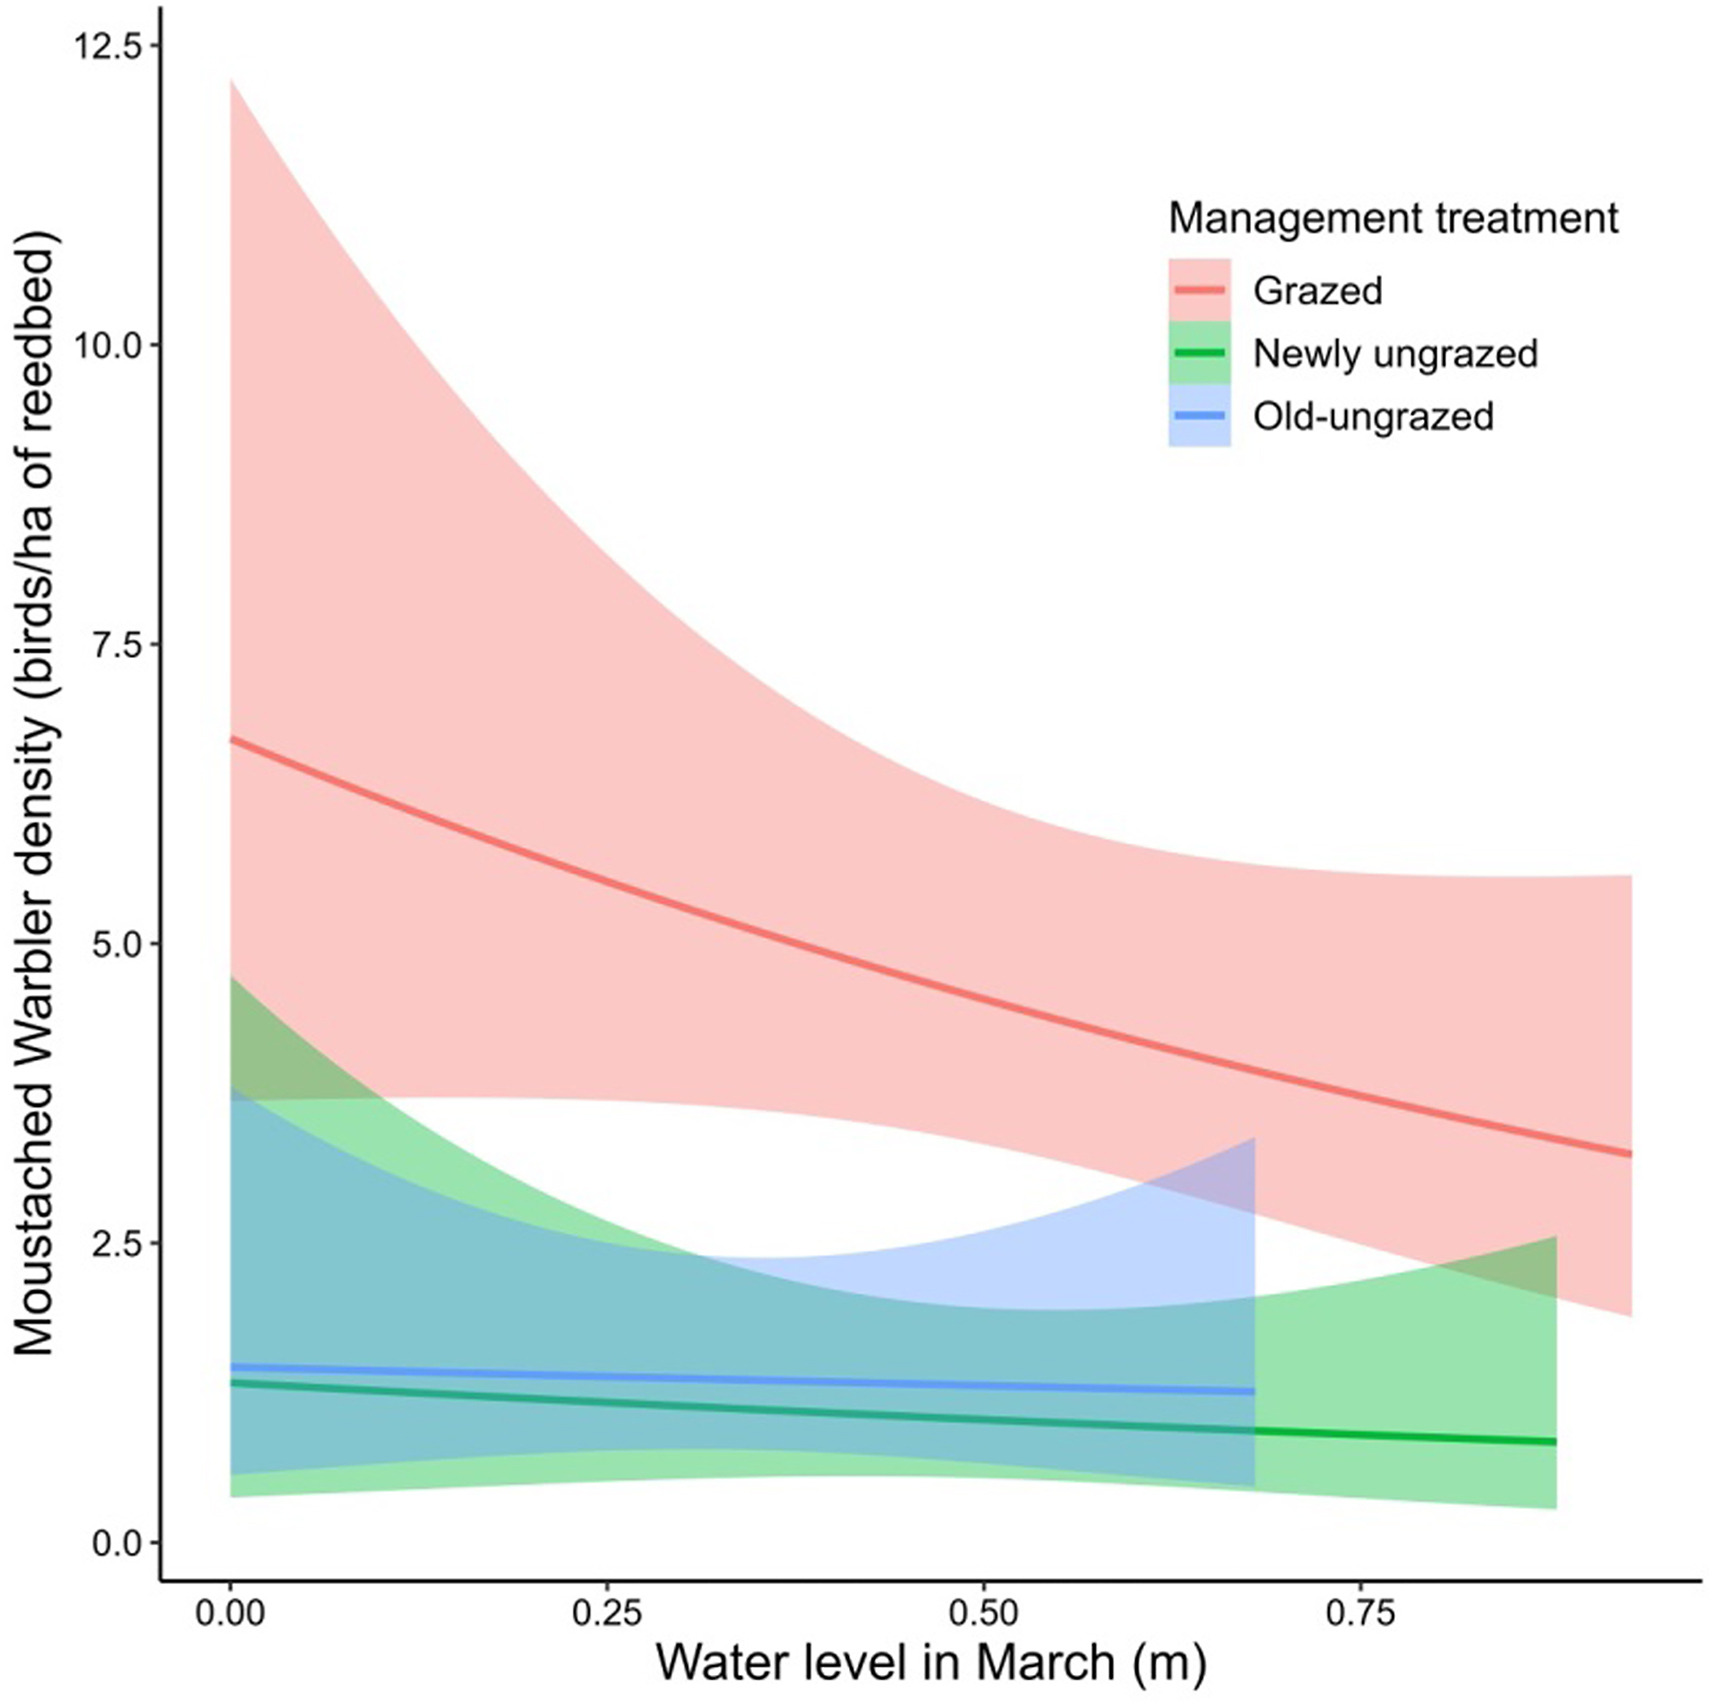
All surveyed songbird total densities did not differ significantly between plots (Kruskal-Wallis test: χ2 = 5.15, df = 2, p = 0.0762). Yet, management treatment was the best predictor of the Great Reed Warbler, Moustached Warbler and Reed Bunting densities during the breeding season (Table 4). The response of birds to management treatments differed greatly among species (Fig. 4). The Great Reed Warbler tended to be more associated with grazed reedbed than old-ungrazed reedbed (Dunn's test: z = −2.62, p < 0.05). The grazed reedbed was by far the most suitable habitat for the Moustached Warbler, with densities higher than in the newly ungrazed (Dunn's test: z = −4.04, p < 0.005) and the old-ungrazed (Dunn's test: z = −3, p < 0.01) reedbeds. This species was also sensitive to water levels as revealed by the second best fitted model: its density decreased as water levels increased in March within the grazed reedbed, while its density remained low and stable in others reedbeds (Fig. 5). Opposite to the other birds, the Reed Bunting depended entirely on the old-ungrazed reedbed, being totally absent from all other reedbeds. For the Common Reed Warbler, density patterns did not segregate between the three treatments (Kruskal-Wallis test: χ2 = 2.02, df = 2, p = 0.364). This species was instead very slightly affected by water levels in April and showed a negative response to the water level increase (Appendix Fig. S1).
Table
4.
Specie-specific predictors of density in reedbed for the four reed-nesting songbird species. Results were calculated by GLMM with bird abundance as dependent variable, reedbed size as offset and year as random effect. WL = water level.
Figure
4.
Annual densities of reed-nesting songbirds species expressed in number of singing males per hectare of reedbed in grazed, newly ungrazed and old-ungrazed plots. The box plots show the medians (thick horizontal line), interquartile ranges (box), ranges (whiskers), and data (dots) of densities per species between 2015 and 2023.
Figure
5.
Relationship between Moustached Warbler densities (singing males/ha of reedbed) and the water levels in March for the three management treatments, from second best fitted linear model. Shaded area represents the 95% confidence intervals around model predictions.
A previous meta-analysis found that active management altered the reedbed structure (Valkama et al., 2008). Prior studies addressed the detrimental effects of reed mowing (Graveland, 1999; Schmidt et al., 2005; Antoniazza et al., 2018), burning (Moga et al., 2010) and cutting (Poulin and Lefebvre, 2002; Vadász et al., 2008) on bird abundances. However, no probative negative effect of grazing has been shown so far (Mérő et al., 2015; Lehikoinen et al., 2017), although its effect may depend on the type of livestock and grazing intensity (Vulink et al., 2000), and likely change after the discontinuation of this treatment (Tanneberger et al., 2009). We found that reedbed grazing and its cessation induced specific structural features, and hence influenced the breeding songbird presence and density. Because of the wide distribution of the target species and habitats, our results could be critical and provide useful information for wetland managers.
4.1
Effects of management on reedbed structure
Continuous grazing on grassland alters the sward structure and composition by fostering short and light-sensitive annual grasses (Pavlů et al., 2007). In contrast, its cessation leads to modifications in vegetation composition with taller and more perennial plants, litter accumulation and decrease in fresh biomass (Golodets et al., 2010; Xu et al., 2021).
Our study showed that grazing rejuvenated reedbed, through the increase of the new reeds growth with more green and shorter stems than in both ungrazed reedbeds, which is consistent with Valkama et al. (2008) and Andersen et al. (2021). However, total reeds stem density was only weakly impacted by grazing; probably because horses begin to graze predominantly thicker primary shoots in late spring, which then enhances the growth of smaller secondary shoots (van Deursen and Drost, 1990). Although grazing can induce a reduction in reed vigor (Ausden et al., 2005), inflorescence density was unaltered. The amount of dry and flowering reeds did not seem to depend on the density of green stems or litter decomposition.
Any reed removals slow down the litter accumulation rate (Cowie et al., 1992). In ungrazed reedbeds, litter was not removed or trampled anymore and so accumulated up to a level above the surface of water in flooding times, which probably reduces the rate of vegetation regeneration since litter layers provide mechanical resistance to emerging shoots (Campbell et al., 1992).
Litter accumulation did not appear to influence the vegetation structural heterogeneity. In the newly ungrazed reedbed, where heterogeneity was the lowest, litter height was intermediate. Even though the old-ungrazed reedbed harbored a higher amount of accumulated litter than the grazed reedbed, we found that they both maintained a high vegetation structural heterogeneity. However, our results also showed that this structural heterogeneity was increased by grazing. This latter has a random effect on vegetation with some stems being eaten and others remaining, which may generate microvariations in vegetation structure but also a high internal fragmentation with large open areas (hence reducing substantially the reedbed area). Ungrazed reedbed also reached high vegetation structural heterogeneity in the long term, likely because of a heterogeneous biomass distribution (Deak et al., 2015) and a much larger reedbed area is conducive to variations at micro-spatial scale. In shorter term, grazing cessation seemed to create a moderately more homogeneous habitat. The newly ungrazed reedbed was, as expected, at an intermediate stage between long-time grazing and long-time non-grazing, and so did not have distinct features, but rather constituted an interface mixing some features from the two other treatments. The open areas previously maintained by grazing were slowly colonized by vegetation from the edges, recreating the natural succession of vegetation stages (Antoniazza et al., 2018), and reducing the fragmentation rate and the edge complexity.
4.2
Effect of management-induced reedbed structure on songbird densities
Reed-nesting songbirds are strict habitat specialists whose distributions across reedbeds vary among species due to their different habitat structure requirements, such as vegetation age, edge typology, heterogeneity, and hydrological parameters related with their morphology and ecology (Leisler et al., 1989; Laikun et al., 2021; Koma et al., 2022). The reedbed structure may drive the local composition and abundance of the avian community by providing various niches for species co-existence (Báldi and Kisbenedek, 1999; Poulin et al., 2002; Báldi, 2006).
Our results showed that management did not influence the songbird total densities considering the reedbed-covered areas only. However, management did affect absolute bird abundance by increasing or decreasing reedbed areas. Reedbeds cover 91.8% of the total area in the old-ungrazed plot versus 25.4% in the grazed one, which means that the bird abundance was globally much higher in the plot where the reedbed was not opened-up or formerly opened-up by grazing. Moreover, reduced-size reed patches may be avoided by birds if they are smaller than territory size (Benassi et al., 2009).
Although high density reeds and large green leaves of fully grown reeds are likely to provide better nest concealment from predators (Mérő et al., 2023), we did not find more birds in the grazed plot where the green reed density was the highest.
The management treatments were associated with a slightly different songbird community composition, with only the old-ungrazed reedbed hosted all the surveyed species (consistent with Martínez-Vilalta et al., 2002), but with some great variations in species densities. Some species preferring heterogeneous ungrazed reedbeds (i.e., old-ungrazed reedbed; consistent with Báldi, 2004; Benassi et al., 2009), while other species being attracted by grazing effects (consistent with Mérő et al., 2015). By looking at the simultaneous effects of reedbed structural features and water levels, these inter-specific differences may be understood (Šťastný and Riegert, 2021; Bozó et al., 2023).
High fragmentation rate, as found in grazed reedbed, causes edge effects at a very local scale, i.e., changes of microclimate (higher solar radiation, higher temperature, and lower humidity), vegetation (denser and greener stems), animal community (e.g., arthropods species distribution) attributes along a gradient from edge to interior of reedbed habitat (Báldi, 2005). Reedbed songbirds show individualistic and species-specific responses to edges, albeit with most species preferring edge proximity for nesting despite a higher probability of nest predation (Báldi, 2004; Pasinelli and Schiegg, 2006). The Great Reed Warbler and the Moustached Warbler are known to colonize reeds neighboring open water, which often represents the first stages of the succession in wetlands (Báldi and Kisbenedek, 1999; Báldi, 2006; Paracuellos, 2006; Vadász et al., 2008). Both species were found here in highest density in the grazed reedbed, where large edges were present. Conversely, the Reed Bunting seemed to avoid water edges, preferring old-ungrazed reedbed where edges are mainly limited to external borders or few internal fragmentations.
Reed-nesting songbird density depends also on food availability (Poulin et al., 2002). Thicker litter in reedbeds, less likely to be fully saturated when water levels are raised, is associated with higher numbers of invertebrates (Hardman et al., 2012). Reed bunting dwelled only in the oldest reedbed on dense litter, which is consistent with Vera et al. (2011) and Surmacki (2004), likely because it mainly feeds on the ground (Cramp et al., 1994). In contrast, grazing-induced thinner litter layer may reduce dramatically the numbers of beetles (Coleoptera) and spiders (Araneae), which are major prey components used by reed passerines (Schmidt et al., 2005; Valkama et al., 2008; Ientile et al., 2022). Annual water level fluctuations produce submergence and exposure conditions which are disruptive for both aquatic and terrestrial invertebrate communities, and may result in lower invertebrate diversity and abundance (Bedford and Powell, 2005; Hoffmann et al., 2016). Small spiders account for a large part of the Moustached Warbler diet (Poulin et al., 2002; Ceresa et al., 2016). Although several spider species use panicles as refuge, they also live in large numbers in the litter (Schmidt et al., 2005). The thinner litter layer in the grazed reedbed is more likely to be completely flooded by spring rainfall, making the food resource inaccessible during the breeding period. This may explain the decrease of Moustached Warblers in the grazed reedbed when the water level increases. For the Common Reed Warbler, which did not seem sensitive to reedbed structure (consistent with Koma et al., 2021), a similar effect of water level on food availability could also be considered to explain the variations in densities.
As observed in Battisti et al. (2020), the aging reedbed maintained a significant vegetation structural heterogeneity. High degree of habitat heterogeneity has often positive effects on birds, but this also depends on the spatial scale because species-specific sensitivity to habitat features is linked to the minimum area required for an individual to establish a territory (Henle et al., 2004; Tews et al., 2004). Habitat heterogeneity includes a set of different structural variables that increase the global suitability of reedbed for birds, i.e., adequate food resources and quality nesting sites (Tscharntke, 1992; Paracuellos, 2006; Benassi et al., 2009; Monrós et al., 2023). The newly ungrazed reedbed which had the lowest, yet not negligible heterogeneity was never preferred by any species. At the opposite, the grazed reedbed which had the highest heterogeneity, thanks to the random effect of grazing on vegetation, hosted the highest density of Moustached Warblers and, to a lesser extent, of Great Reed Warblers. The Moustached warbler is an early breeder that seeks for patches of dense vegetation near the ground to forage and conceal its nest. At the opposite, the Great Reed Warbler is a late (migratory) breeder of larger size attracted by tall and thick reeds to perch on and to hang its nest from (Graveland, 1998; Martínez-Vilalta et al., 2002). It seems likely that the vigorous reed found at the water edge has a determining factor for this species. A highly heterogeneous reedbed has most probably some of the required habitat patches. Fidelity to such habitat heterogeneity could be related to natal and breeding philopatry (Mérő et al., 2018).
4.3
Implications for bird conservation
Long-term management of reedbeds is usually considered appropriate to ensure sustainable bird conservation. Understanding the habitat needs of target species and the effects of management on their habitat are prerequisites to develop conservation strategies.
The introduction of horses in wetland ecosystems integrates the concept of trophic rewilding where large mammalian herbivores are cost-effective tools to restore top-down trophic interactions and to maintain open or half-open structurally diverse landscapes (Naundrup and Svenning, 2015). Reedbed grazing aims to diversify wetland habitats through the promotion of discontinuity and to prevent reedbeds from dying back. The use of horses that are untreated with veterinary chemical products, outside the spring season when birds are nesting, and with very low grazing pressures on reeds can contribute to providing suitable habitats for some reed-nesting songbird species, like warblers. Although it leads to a local reduction of reed extent which results in a decrease of reed-nesting songbird total abundance, it does not affect their density. Resulting open water areas with patchy reeds created by low grazing intensity additionally support many waterbirds, such as ducks and grebes (Lovász et al., 2023). The duration and periodicity of grazing will depend on the trade-offs between bird requirements and vegetation control (Čížková et al., 2023). Horses help to rejuvenate the reedbed but, unlike other large grazers, they do not include a great proportion of woody plants in their diet (Cromsigt et al., 2018), and so are little efficient to limit scrub encroachment.
Grazing cessation may also benefit avian conservation (Poessel et al., 2020). A long period without grazing appears to sustain high levels of vegetation structural heterogeneity and likely ensure food availability even at high water levels. Keeping large reedbeds ungrazed for a long time can be relevant when aiming to promote reed-nesting songbird abundance, and particularly the Reed Bunting. This should however be considered with caution because reed die-back may in time have negative effects (Nemeth and Dvorak, 2022).
Based on local conservation priorities and hydrological conditions, managers must find an appropriate balance between increasing the size of old reed stands and increasing the vegetation opening-up and rejuvenation, within a mosaic wetland landscape. Management choices are contextual and philosophical issues that benefits from adaptive approaches.
Ethics statement
The study was conducted according to the guidelines of the Estagnol Nature Reserve management plan, and approved by the Conseil Scientifique Régional du Patrimoine Naturel and the French Ministry of Ecological Transition.
The authors declare that they have no known competing financial interests or personal relationships that could have appeared to influence the work reported in this paper.
Acknowledgments
We are grateful to Louis Gérard Martin d'Escrienne, Hervé Bluhm, Etienne Frejefond (heads of Office Français de la Biodiversité Occitanie), Sonia Bertrand and Daniel Marc (heads of Conservatoire d'Espaces Naturels d'Occitanie) for the opportunity to conduct the study on this place, the institutional and the financial supports. We are thankful to Christine Rochat, Anne Hervouët and Frédéric Dentand (representatives of Direction Régionale de l'Environnement, de l'Aménagement et du Logement d'Occitanie, département Biodiversité) for their financial supports. We also thank Louise Froud for spelling corrections and especially Frédérique Malgoire for her great help in fieldwork.
Alambiaga, I., Carrasco, M., Ruiz, C., Mesquita-Joanes, F., Monrós, J., 2021. Population trends and habitat selection of threatened marsh passerines in a protected Mediterranean wetland. Avian Conserv. Ecol. 16, 23. .
Alvarez, M.G., Tron, F., Mauchamp, A., 2005. Sexual versus asexual colonization by Phragmites australis: 25-year reed dynamics in a Mediterranean marsh, southern France. Wetlands 25, 639-647. .
Andersen, L.H., Nummi, P., Bahrndorff, S., Pertoldi, C., Trøjelsgaard, K., Lauridsen, T.L., et al., 2021. Reed bed vegetation structure and plant species diversity depend on management type and the time period since last management. Appl. Veg. Sci. 24, e12531 .
Anich, N.M., Benson, T.J., Bednarz, J.C., 2009. Estimating territory and home-range sizes: do singing locations alone provide an accurate estimate of space use? Auk 126, 626-634. .
Antoniazza, M., Clerc, C., Le Nédic, C., Sattler, T., Lavanchy, G., 2018. Long-term effects of rotational wetland mowing on breeding birds: evidence from a 30-year experiment. Biodivers. Conserv. 27, 749-763. .
Ausden, M., Hall, M., Pearson, P., Strudwick, T., 2005. The effects of cattle grazing on tall-herb fen vegetation and molluscs. Biol. Conserv. 122, 317-326. .
Ausden, M., 2007. Habitat Management for Conservation. A Handbook of Techniques.
Oxford University Press, Oxford.
Báldi, A., Kisbenedek, T., 1999. Species-specific distribution of reed-nesting passerine birds across reed-bed edges: effect of spatial scale and edge type. Acta Zool. Hung. 45, 97-114.
Báldi, A., 2004. Area requirements of passerine birds in the reed archipelago of Lake Velence, Hungary. Acta Zool. Hung. 50, 1-8.
Báldi, A., 2005. The importance of temporal dynamics of edge effect in reedbed design: a 12-year study on five bird species. Wetlands Ecol. Manage. 13, 183-189. .
Báldi, A., 2006. Factors influencing occurrence of passerines in the reed archipelago of Lake Velence (Hungary). Acta Ornithol. (Warszaw) 41, 1-6. .
Batáry, P., Winkler, H., Baldi, A., 2004. Experiments with artificial nests on predation in reed habitats. J. Ornithol. 145, 59-63. .
Bates, D., Mächler, M., Bolker, B., Walker, S., 2014. Fitting Linear Mixed-Effects Models
Using Lme4 arXiv preprint. arXiv, 1406.5823.
Battisti, C., Grosso, G., Ioni, S., Zullo, F., Cerfolli, F., 2020. Response of specialized birds to reed-bed aging in a Mediterranean wetland: significant changes in bird biomass after two decades. Isr. J. Ecol. Evol. 67, 17-22.
Bedford, A.P., Powell, I., 2005. Long-term changes in the invertebrates associated with the litter of Phragmites australis in a managed reedbed. Hydrobiologia 549, 267-285. .
Benassi, G., Battisti, C., Luiselli, L., Boitani, L., 2009. Area-sensitivity of three reed bed bird species breeding in Mediterranean marshland fragments. Wetl. Ecol. Manag. 17, 555-564. .
Bibby, C.J., Burgess, N., Hillis, D., Hill, D., Mustoe, S., 2000. Bird Census Techniques.
Elsevier, Amsterdam.
Bozó, L., 2020. The role of reedbeds in secondary habitats during the migration and breeding of reed warblers. Ornis Hung. 28, 76-91. .
Bozó, L., Németh, Á., Csörgő, T., 2023. Long-term population changes of the Moustached Warbler in a Central Hungarian wetland habitat. Ornis Hung. 31, 89-98. .
Burfield, I.J., Rutherford, C.A., Fernando, E., Grice, H., Piggott, A., Martin, R.W., et al., 2023. Birds in Europe 4: the fourth assessment of species of European conservation concern. Bird. Conserv. Int. 33, e66.
Burnham, K.P., Anderson, D.R., 2002. In: Model Selection and Multimodel Inference: A
Practical Information-Theoretic Approach, second ed. Springer, New York.
Campbell, B.D., Grime, J.P., Mackey, J.M.L., 1992. Shoot thrust and its role in plant competition. J. Ecol. 80, 633-641. .
Catchpole, C.K., 1972. A comparative study of territory in the reed warbler (Acrocephalus scirpaceus) and sedge warbler (A. schoenobaenus). J. Zool. 166, 213-231. .
Ceresa, F., Belda, E.J., Gómez, J., Miñana, I.J., Soler, L., Villarroya, J., et al., 2016. Differences in time and space use between two sympatric Acrocephalus warblers with similar diets. Hous. Theor. Soc. 63, 172-180. .
Champely, S., 2017. Pwr: basic functions for power analysis. R Package Version 1, 2-1.
Christensen, N.L., 1997. Managing for heterogeneity and complexity on dynamic
landscapes. In: Pickett, S.T.A., Ostfeld, R.S., Shachak, M., Likens, G.E. (Eds.), The
Ecological Basis for Conservation: Heterogeneity, Ecosystems, and Biodiversity.
Chapman & Hall, New York, pp. 167–186.
Čížková, H., Kucera, T., Poulin, B., Květ, J., 2023. Ecological basis of ecosystem services and management of wetlands dominated by Common Reed (Phragmites australis): European perspective. Diversity 15, 629. .
Cowie, N.R., Sutherland, W.J., Ditlhogo, M.K.M., James, R., 1992. The effects of conservation management of reed beds. II. The flora and litter disappearance. J. Appl. Ecol. 29, 277-284. .
Cramp, S., Perrins, C.M., Brooks, D.J., 1994. Handbook of the birds of Europe, the Middle
East and north africa: the birds of the western palearctic. In: Buntings and New
World Warblers, vol. IX. Oxford University Press, Oxford. .
Cromsigt, J.P., Kemp, Y.J., Rodriguez, E., Kivit, H., 2018. Rewilding Europe's large grazer community: how functionally diverse are the diets of European bison, cattle, and horses? Restor. Ecol. 26, 891-899. .
Davidson, N.C., 2014. How much wetland has the world lost? Long-term and recent trends in global wetland area. Mar. Freshw. Res. 65, 934-941. .
Deak, B., Valko, O., Török, P., Kelemen, A., Toth, K., Miglecz, T., et al., 2015. Reed cut, habitat diversity and productivity in wetlands. Ecol. Complex. 22, 121-125. .
Dudgeon, D., Arthington, A.H., Gessner, M.O., Kawabata, Z-I., Knowler, D.J., Lévêque, C., et al., 2006. Freshwater biodiversity: importance, threats, status and conservation challenges. Biol. Rev. 81, 163-182. .
Farina, A., 1995. Distribution and dynamics of birds in a rural sub-Mediterranean landscape. Landsc. Urban Plann. 31, 269-280. .
Ferguson, C.J., 2009. An effect size primer: a guide for clinicians and researchers. Prof. Psychol. Res. Pract. 40, 532-538. .
Foppen, R.P.B., Chardon, J.P., Liefveld, W., 2000. Understanding the role of sink patches in source-sink metapopulations: reed Warbler in an agricultural landscape. Conserv. Biol. 14, 1881-1892. .
Glutz von Blotzheim, U.N., Bauer, K.M., 1997. Handbuch der Vögel Mitteleuropas,
Volume 14, Passeriformes. Aula Verlag, Wiesbaden.
Golodets, C., Kigel, J., Sternberg, M., 2010. Recovery of plant species composition and ecosystem function after cessation of grazing in a Mediterranean grassland. Plant Soil 329, 365-378. .
Gordon, I.J., Duncan, P., Grillas, P., Lecomte, T., 1990. The use of domestic herbivores in the conservation of the biological richness of European wetlands. Bull. d'Ecol. 21, 49-60.
Graveland, J., 1998. Reed die-back, water level management and the decline of the Great Reed Warbler Acrocephalus arundinaceus in The Netherlands. Ardea 86, 187-201.
Graveland, J., 1999. Effects of reed cutting on density and breeding success of Reed Warbler Acrocephalus scirpacaeus and Sedge Warbler A. schoenobaenus. J. Avian Biol. 30, 469-482. .
Hardman, C.J., Harris, D.B., Sears, J., Droy, N., 2012. Habitat associations of invertebrates in reedbeds, with implications for management. Aquat. Conserv. 22, 813-826. .
Henle, K., Davies, K.F., Kleyer, M., Margules, C., Settele, J., 2004. Predictors of species sensitivity to fragmentation. Biodivers. Conserv. 13, 207-251. .
Hoffmann, H., Michalik, P., Gorn, S., Fischer, K., 2016. Effects of fen management and habitat parameters on staphylinid beetle (Coleoptera: Staphylinidae) assemblages in northeastern Germany. J. Insect Conserv. 20, 129-139. .
Ientile, R., Tuliozi, B., Campobello, D., Borghi, S., Sala, L., Dal Zotto, M., et al., 2022. Analysis of prey composition in Eurasian Reed Warblers' Acrocephalus scirpaceus droppings at four breeding sites in Italy. Diversity 14, 1134. .
Issa, N., Muller, Y., 2015. Atlas des Oiseaux de France Métropolitaine: Nidification et
Présence Hivernale. Delachaux et Niestlé, Paris.
IUCN, 2023. The IUCN red list of threatened species. Version 2023-1. Available at: . (Accessed 16 December 2023).
Jochmann, R., Blanckenhorn, W.U., 2016. Non-target effects of ivermectin on trophic groups of the cow dung insect community replicated across an agricultural landscape. Basic Appl. Ecol. 17, 291-299. .
Koma, Z., Grootes, M.W., Meijer, C.W., Nattino, F., Seijmonsbergen, A.C., Sierdsema, H., et al., 2021. Niche separation of wetland birds revealed from airborne laser scanning. Ecography 44, 907-918. .
Koma, Z., Seijmonsbergen, A.C., Grootes, M.W., Nattino, F., Groot, J., Sierdsema, H., et al., 2022. Better together? Assessing different remote sensing products for predicting habitat suitability of wetland birds. Divers. Distrib. 28, 685-699. .
Laikun, M., Canchao, Y., Wei, L., 2021. Nest-site choice and breeding success among four sympatric species of passerine birds in a reedbed-dominated wetland. J. Resour. Ecol. 12, 22-29. .
Lefebvre, G., Redmond, L., Germain, C., Palazzi, E., Terzago, S., Willm, L., et al., 2019. Predicting the vulnerability of seasonally-flooded wetlands to climate change across the Mediterranean Basin. Sci. Total Environ. 692, 546-555. .
Lehikoinen, P., Lehikoinen, A., Mikkola-Roos, M., Jaatinen, K., 2017. Counteracting wetland overgrowth increases breeding and staging bird abundances. Sci. Rep. 7, 41391 .
Leisler, B., Ley, H.W., Winkler, H., 1989. Habitat, behavior and morphology of Acrocephalus warblers: an integrated analysis. Ornis Scand. 20, 181-186. .
Lengyel, S., Mester, B., Szabolcs, M., Szepesváry, C., Szabo, G., Polyák, L., et al., 2020. Restoration for variability: emergence of the habitat diversity paradigm in terrestrial ecosystem restoration. Restor. Ecol. 28, 1087-1099. .
Lovász, L., Korner-Nievergelt, F., Amrhein, V., 2023. Effects of grazer density, season and landcover on bird guilds in a restored conservation area. Res. Square (Preprint). .
McCabe, D.J., Gotelli, N.J., 2000. Effects of disturbance frequency, intensity and area on assemblages of stream macroinvertebrates. Oecologia 124, 270-279. .
McDonald, T., Carlisle, J., McDonald, A., 2023. Rdistance: distance-sampling analyses for density and abundance estimation. R package version 3, 0.0. .
Martínez-Vilalta, J., Bertolero, A., Bigas, D., Paquet, J.Y., Martínez-Vilalta, A., 2002. Habitat selection of passerine birds nesting in the Ebro Delta reed-beds (NE Spain): management implications. Wetlands 22, 318-325. .
Mérő, T.O., Lontay, L., Lengyel, S., 2015. Habitat management varying in space and time: the effects of grazing and fire management on marshland birds. J. Ornithol. 156, 579-590. .
Mérő, T.O., Žuljević, A., Varga, K., Lengyel, S., 2018. Reed management influences philopatry to reed habitats in the Great Reed Warbler (Acrocephalus arundinaceus). Condor 120, 94-105. .1.
Mérő, T.O., Žuljević, A., Lengyel, S., 2023. Timing of reed management affects habitat use and breeding success in Great Reed Warblers: a field experiment on agricultural drainage canals. Global Ecol. Conserv. 48, e02691. .
Middleton, B.A., Holstein, B., van Diggelen, R., 2006. Biodiversity management of fens and fen meadows by grazing, cutting and burning. Appl. Veg. Sci. 9, 307-316. .
Middleton, B.A., Kleinebecker, T., 2012. The effects of climate change-induced drought
and freshwater wetlands. In: Middleton, B.A. (Ed.), Global Change and the Function
and Distribution of Wetlands. Springer, Dordrecht, pp. 117–147.
Moga, C.I., Öllerer, K., Hartel, T., 2010. The effect of reed burning on the habitat occupancy of passerine species. N. West. J. Zool. 6, 90-94.
Monrós, J.S., Belda, E.J., Drechsler, R.M., Gómez, J., Mestre, A., Sanjuán, J.J., 2023. Home range and habitat use of the moustached warbler (Acrocephalus melanopogon) during the reproductive period in the eastern iberian peninsula. Open J. Ecol. 13, 80-94. .
Morganti, M., Manica, M., Bogliani, G., Gustin, M., Luoni, F., Trotti, P., et al., 2019. Multi-species habitat models highlight the key importance of flooded reedbeds for inland wetland birds: implications for management and conservation. Avian Res. 10, 15. .
Mukaka, M., 2012. A guide to appropriate use of correlation coefficient in medical research. Malawi Med. J. 24, 69-71.
Musseau, R., Crépin, M., Brugulat, C., Kerbiriou, C., 2021. Conservation and restoration of coastal reed beds in the context of global change: potential effects of habitat fragmentation for specialist marshland passerines. Wetlands 41, 70. .
Naundrup, P.J., Svenning, J.C., 2015. A geographic assessment of the global scope for rewilding with wild-living horses (Equus ferus). PLoS One 10, e0132359. .
Nemeth, E., Dvorak, M., 2022. Reed die-back and conservation of small reed birds at Lake Neusiedl, Austria. J. Ornithol. 163, 683-693. .
Ostendorp, W., 1993. Reed bed characteristics and significance of reeds in landscape
ecology. In: Ostendorp, W., Krummscheid-Plankert, P. (Eds.), Seeuferzerstörung und Seeuferrenaturierung in Mitteleuropa. Limnologie Aktuell 5, Gustav-Fischer-Verlag,
pp. 149–160. Stuttgart.
Packer, J.G., Meyerson, L.A., Skalova, H., Pyšek, P., Kueffer, C., 2017. Biological flora of the British isles: Phragmites australis. J. Ecol. 105, 1123-1162. .
Paracuellos, M., 2006. Relationships of songbird occupation with habitat configuration and bird abundance in patchy reed beds. Ardea 94, 87-98.
Pasinelli, G., Schiegg, K., 2006. Fragmentation within and between wetland reserves: the importance of spatial scales for nest predation in Reed Buntings. Ecography 29, 721-732. .
Pavlů, V., Hejcman, M., Pavlu, L., Gaisler, J., 2007. Restoration of grazing management and its effect on vegetation in an upland grassland. Appl. Veg. Sci. 10, 375-382. .
Pearce-Higgins, J.W., Grant, M.C., 2006. Relationships between bird abundance and the composition and structure of moorland vegetation. Hous. Theor. Soc. 53, 112-125. .
Poessel, S.A., Hagar, J.C., Haggerty, P.K., Katzner, T.E., 2020. Removal of cattle grazing correlates with increases in vegetation productivity and in abundance of imperiled breeding birds. Biol. Conserv. 241, 108378 .
Poulin, B., 2001. Introduction: reedbed management and conservation in Europe. In:
Fields, R., Warren, R.J., Okarma, H., Sievert, P.R. (Eds.), Wildlife Land and People:
Priorities for the 21th Century. The Wildlife Society, Bethesda, Maryland,
pp. 378–381.
Poulin, B., Lefebvre, G., 2002. Effect of winter cutting on the passerine breeding assemblage in French Mediterranean reedbeds. Biodivers. Conserv. 11, 1567-1581. .
Poulin, B., Lefebvre, G., Mauchamp, A., 2002. Habitat requirements of passerines and reedbed management in southern France. Biol. Conserv. 107, 315-325. .
R Core Team, 2021. R: A Language and Environment for Statistical Computing. R
Foundation for Statistical Computing. .
Sebastián-González, E., Sánchez-Zapata, J.A., Botella, F., Figuerola, J., Hiraldo, F., Wintle, B.A., 2011. Linking cost efficiency evaluation with population viability analysis to prioritize wetland bird conservation actions. Biol. Conserv. 144, 2354-2361. .
Šťastný, V., Riegert, J., 2021. Habitat use of breeding birds in Central European reed beds. Wetl. Ecol. Manag. 29, 81-91. .
Surmacki, A., 2004. Habitat use by Reed Bunting Emberiza schoeniclus in an intensively used farmland in Western Poland. Ornis Fenn. 81, 137-143.
Tanneberger, F., Tegetmeyer, C., Dylawerski, M., Flade, M., Joosten, H., 2009. Commercially cut reed as a new and sustainable habitat for the globally threatened Aquatic Warbler. Biodivers. Conserv. 18, 1475-1489. .
Tews, J., Brose, U., Grimm, V., Tielbörger, K., Wichmann, M.C., Schwager, M., et al., 2004. Animal species diversity driven by habitat heterogeneity/diversity: the importance of keystone structures. J. Biogeogr. 31, 79-92. .
Torchiano, M., Torchiano, M.M., 2020. Package 'effsize'. R documentation. .
Trnka, A., Prokop, P., 2006. Reedbed structure and habitat preference of reed passerines during the post-breeding period. Biologia 61, 225-230. .
Trnka, A., Batáry, P., Prokop, P., 2009. Interacting effects of vegetation structure and breeding patterns on the survival of Great Reed Warbler Acrocephalus arundinaceus nests. Ardea 97, 109-116. .
Tscharntke, T., 1992. Fragmentation of Phragmites habitat, minimum viable population size, and local extinction of moths, midges, flies, aphids and birds. Conserv. Biol. 6, 530-536. .
Tuominen, J., Lipping, T., 2016. Spectral characteristics of common reed beds: studies on spatial and temporal variability. Rem. Sens. 8, 181. .
Vadász, C., Nemet, A., Biro, C., Csorgo, T., 2008. The effect of reed cutting on the abundance and diversity of breeding passerines. Acta Zool. Acad. Sci. Hungar. 54, 177-188.
Valkama, E., Lyytinen, S., Koricheva, J., 2008. The impact of reed management on wildlife: a meta-analytical review of European studies. Biol. Conserv. 141, 364-374. .
van Deursen, E.J.M., Drost, H.J., 1990. Defoliation and treading by cattle of reed Phragmites australis. J. Appl. Ecol. 27, 284-297. .
Vermaat, J.E., Bos, B., van der Burg, P., 2016. Why do reed beds decline and fail to re-establish? A case study of Dutch peat lakes. Freshw. Biol. 61, 1580-1589. .
Vogt, P., Riitters, K., 2017. GuidosToolbox: universal digital image object analysis. Eur. J. Rem. Sens. 50, 352-361. .
Vulink, J.T., Drost, H.J., Jans, L., 2000. The influence of different grazing regimes on Phragmites- and shrub vegetation in the welldrained zone of a eutrophic wetland. Appl. Veg. Sci. 3, 73-80. .
Wagner, K.I., Gallagher, S.K., Hayes, M., Lawrence, B.A., Zedler, J.B., 2008. Wetland restoration in the new millennium: do research efforts match opportunities? Restor. Ecol. 16, 367-372. .
Ward, J.H., 1963. Hierarchical grouping to optimize an objective function. J. Am. Stat. Assoc. 58, 236-244. .
Xu, D., Harder, J.K., Xu, W., Guo, X., 2021. Evaluating the impact of grazing cessation and reintroduction in mixed prairie using raster time series analysis of landsat data. Rem. Sens. 13, 3397. .
Table
1.
Densities of study species in the Estagnol Nature Reserve estimated using transect counts and distance sampling method with 'Rdistance' R packages (McDonald et al., 2023) from 2017 to 2023.
N
Specific model selected by AICc criteria
Density (ind./ha)
95% CI
LCL
UCL
Great Reed Warbler
234
Gamma function with 2 orders of cosine adjustment
0.290
0.210
0.390
Common Reed Warbler
408
Hazard-rate function with 3 orders of cosine adjustment
0.380
0.210
0.520
Moustached Warbler
459
Gamma function
0.460
0.390
0.540
Reed Bunting
19
Gamma function
0.024
0.009
0.043
N = sample size. CI = Confidence Interval; UCL = Upper Confidence Limit; LCL = Lower Confidence Limit.
Table
2.
Reedbed structure features (vegetation heterogeneity expressed by Shannon index and reedbed structural discontinuity) for the three management treatments.
Table
3.
Mean and standard deviation (SD) of the vegetation structure variables measured in each plot according to the management treatment. Effect of management (fixed factor in GLM) on each variable is indicated by F-test result with its p-value and model deviance.
Table
4.
Specie-specific predictors of density in reedbed for the four reed-nesting songbird species. Results were calculated by GLMM with bird abundance as dependent variable, reedbed size as offset and year as random effect. WL = water level.


 DownLoad:


 Email Alerts
 RSS Feeds