Orlando J. Espinosa-Chávez, Adolfo G. Navarro-Sigüenza, Hernando Rodríguez-Correa, Luis A. Sánchez-González. 2024: Highly divergent sympatric lineages of Leptotila verreauxi (Aves: Columbidae) suggest a secondary contact area in the Isthmus of Tehuantepec, Mexico. Avian Research, 15(1): 100160. DOI: 10.1016/j.avrs.2024.100160
Citation:
Orlando J. Espinosa-Chávez, Adolfo G. Navarro-Sigüenza, Hernando Rodríguez-Correa, Luis A. Sánchez-González. 2024: Highly divergent sympatric lineages of Leptotila verreauxi (Aves: Columbidae) suggest a secondary contact area in the Isthmus of Tehuantepec, Mexico. Avian Research, 15(1): 100160. DOI: 10.1016/j.avrs.2024.100160
Orlando J. Espinosa-Chávez, Adolfo G. Navarro-Sigüenza, Hernando Rodríguez-Correa, Luis A. Sánchez-González. 2024: Highly divergent sympatric lineages of Leptotila verreauxi (Aves: Columbidae) suggest a secondary contact area in the Isthmus of Tehuantepec, Mexico. Avian Research, 15(1): 100160. DOI: 10.1016/j.avrs.2024.100160
Citation:
Orlando J. Espinosa-Chávez, Adolfo G. Navarro-Sigüenza, Hernando Rodríguez-Correa, Luis A. Sánchez-González. 2024: Highly divergent sympatric lineages of Leptotila verreauxi (Aves: Columbidae) suggest a secondary contact area in the Isthmus of Tehuantepec, Mexico. Avian Research, 15(1): 100160. DOI: 10.1016/j.avrs.2024.100160
Museo de Zoología “Alfonso L. Herrera”, Depto. de Biología Evolutiva, Facultad de Ciencias, Universidad Nacional Autónoma de México, Apdo. Postal 70-399, CP 04510, Ciudad de México, Mexico
b.
Posgrado en Ciencias Biológicas, Unidad de Posgrado, Edificio D, 1° Piso, Circuito de Posgrados, Ciudad Universitaria, Universidad Nacional Autónoma de México, Coyoacán, CP 04510, CDMX, Mexico
c.
Escuela Nacional de Estudios Superiores Unidad Morelia, Universidad Nacional Autónoma de México. Antigua Carretera a Pátzcuaro No. 8701 Col. Ex Hacienda de San José de la Huerta, C.P. 58190, Morelia, Michoacán, Mexico
Due to a complex geological and biotic history, the Isthmus of Tehuantepec (IT), has been long recognized as a driver for the evolutionary divergence of numerous lowland and highland taxa. Widely distributed in the lowlands of the American continent, the White-Tipped Dove (Leptotila verreauxi) is a polytypic species with 13 recognized subspecies. Four of these have been recorded in Mexico, and the distribution of three abuts at the IT, suggesting a contact zone. To estimate phylogenetic patterns, divergence times and genetic differentiation, we examined two mtDNA (ND2 and COI) and one nDNA (β-fibint 7) markers. We also used correlative ecological niche models (ENM) to assess whether ecological differences across the IT may have acted as a biogeographical boundary. We estimated paleodistributions during the Middle Holocene, Last Glacial Maximum and Last Interglacial, to evaluate the influence of climate changes on the distribution and demographic changes. Our results showed genetically distinct lineages that diverged approximately 2.5 million years ago. Climatic and ecological factors may have played a dual role in promoting differentiation, but also in the formation of a secondary contact zone in the southern IT. Our ecological niche comparisons indicated that the ecological niche of sympatric lineages at the IT are not identical, suggesting niches divergence; in addition, environmental niche models across the region indicated no abrupt biogeographic barriers, but the presence of regions with low suitability. These results suggest that genetic differentiation originated by a vicariant event probably related to environmental factors, favored the evolution of different ecological niches. Also, the absence of a biogeographic barrier but the presence of less suitable areas in the contact regions, suggest that secondary contact zones may be also maintained by climatic factors for the eastern group, but also by biotic interactions for the western group.
Located in southeastern Mexico, the Isthmus of Tehuantepec (IT) has been long recognized as one of the most important geographic features in the diversification of a large number of taxa in northern Mesoamerica (Binford, 1989; Peterson et al., 1999; Barber and Klicka, 2010; Ornelas et al., 2013). Studies in montane-forest birds distributed east and west of the IT have suggested its crucial role as a geographic barrier acting in different times or “pulses” (Barber and Klicka, 2010; Ornelas et al., 2013; Tsai et al., 2019). However, the role that IT has played in the diversification of lowland birds is still poorly understood (see Sosa-López et al., 2013), probably because it has been long assumed that lowland bird species can disperse freely throughout the region (Edwards and Lea, 1955; Binford, 1989), thus preventing complete divergence in these taxa (e.g., Howell and Webb, 1995).
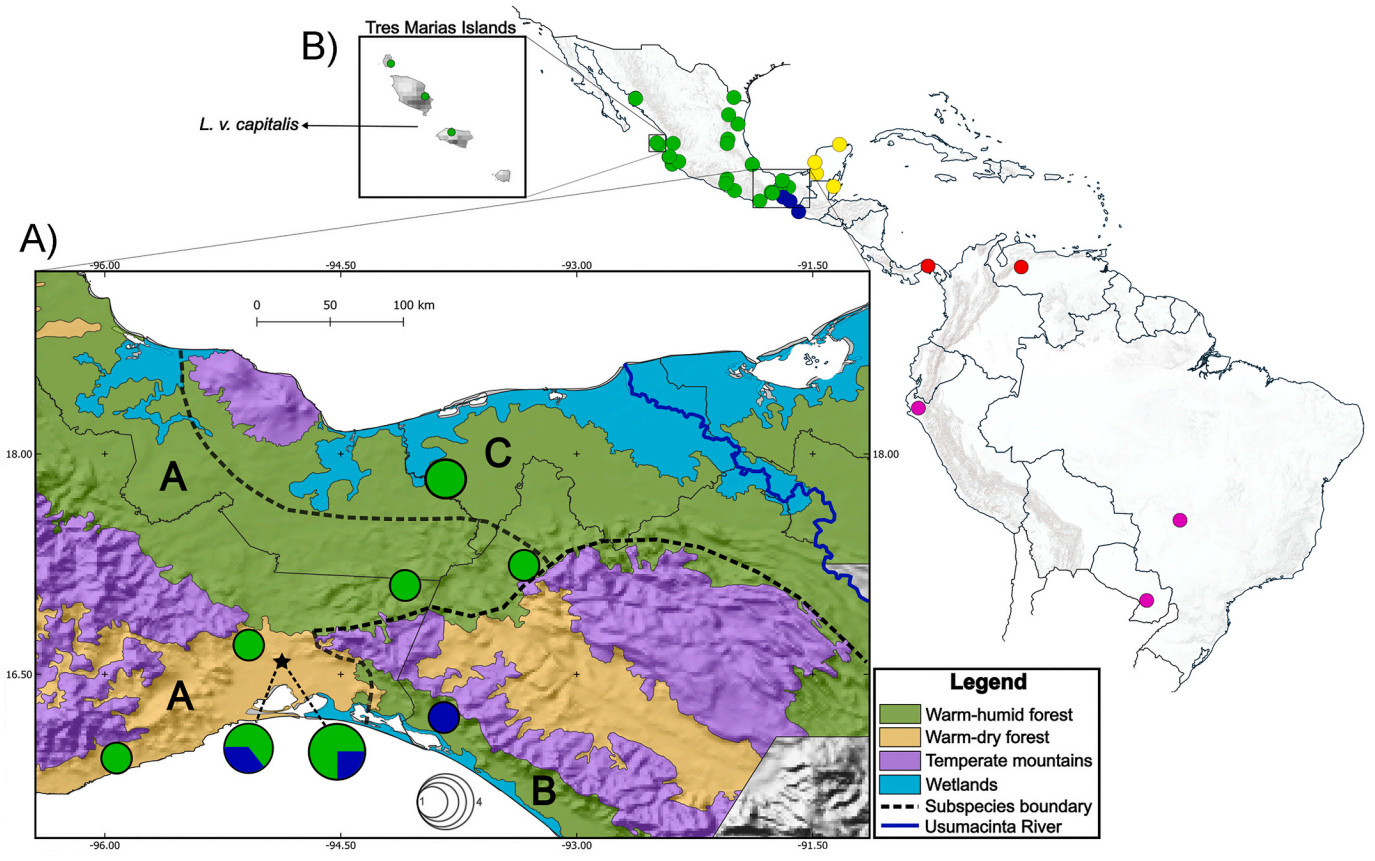
The White-tipped Dove (Leptotila verreauxi) is a widely distributed polytypic species mainly distributed in tropical lowlands from extreme southern USA (the Lower Rio Grande Valley in southern Texas) through Mexico and Central America to northern Argentina (Friedmann et al., 1950). Currently, 13 subspecies are recognized (Gill et al., 2021), four of which are distributed in Mexico (Fig. 1): capitalis, endemic to the Tres Marias Islands; angelica, from southern Texas in the Gulf slope, and southern Sonora in the Pacific slope south to the IT; fulviventris, from the IT on the Gulf slope to the Yucatan Peninsula; and bangsi, from the southern IT and Chiapas (Friedmann et al., 1950) to Honduras and western Nicaragua (Hogan, 1999; Gill et al., 2021). The ranges of the three Mexican mainland L. verreauxi subspecies abut at the IT (Friedmann et al., 1950), although precise boundaries between these are unclear, suggesting a complex biogeographic history in the region. As currently described, the main differentiation occurs in a west-east axis (angelica – bangsi, fulviventris). Such west to east differentiation, apparently follows a geographic pattern opposite to what may be expected given the environmental gradient. A previous study on the biogeography of New World doves supported a similar pattern of genetic differentiation, however details on geographical/ecological limits for this pattern are unclear (Johnson and Weckstein, 2011).
Figure
1.
Geographical representation of the samples used in this study. Color of the circles correspond to detected clades. Green, NA clade; Blue, NCA clade; Yellow, YUC clade. Red and pink: South American clades. (A) Inset 1 shows the distribution of the haplogroups and the number of individuals in each locality in the Isthmus of Tehuantepec (IT). The black star (subdivided in the two-colored pie charts) at the southern IT depicts the secondary contact zone between the NA and NCA clades. Colors depict vegetation types at the IT. Dashed line shows putative boundaries between currently recognized subspecies: A = L. v. angelica, B = L. v. bangsi, C = L. v. fulviventris. (B) Inset 2 depicts the Tres Marías Islands, where the endemic L. v. capitalis is found. (For interpretation of the references to color in this figure legend, the reader is referred to the Web version of this article.)
Here, we described genetic differentiation patterns at the IT using L. verreauxi as a model. Based on the distribution of three subspecies, which abut at the region (Fig. 1), as a starting framework, we expected: a) that genetic differentiation corresponds to the ecological structure, in which main differentiation would occur in a north to south axis across the environmental gradient. A west-east pattern of differentiation would not be expected due to the ecological continuity of the lowland forests in the region which has promoted the recognition of mainly phenotypically-based bird subspecies across a north to south ecological gradient (e.g., Howell and Webb, 1995); b) ecological niche differentiation, which would support the recognized differentiation in current taxonomic treatments; and c) that contact zones between differentiated taxa will be maintained by local environmental differences across the ecological gradient. We performed phylogenetic and population genetics analyses using two mitochondrial and one nuclear markers, and estimated divergence times between lineages to explore genetic variation and historical population dynamics, focusing particularly on the populations at the IT. In addition, we used correlative ecological niche models (ENM) to estimate paleodistributions of lineages and test hypotheses of niche conservatism, as well as evaluate the role of ecological differences as a biogeographic limit in these populations. All of these tests allowed us to establish if these distribution patterns may be the result of secondary contact, which would suggest a vicariant event at the IT. We also evaluated if there are differences in the ecological niche that could be contributing to the maintenance of differentiation.
2.
Materials and methods
2.1
Taxon sampling and laboratory protocols
We obtained 48 tissue samples from the collection of the Museum of Zoology “Alfonso L. Herrera” (MZFC), representing all Mexican subspecies (Appendix Table S1). We supplemented our samples with 20 sequences available in GenBank (Benson et al., 2013; http://www.ncbi.nlm.nih.gov; Appendix Table S1). Outgroups were selected based on a previous phylogenetic hypothesis (Johnson and Weckstein, 2011) and included six species: L. jamaicensis, L. cassini, L. megalura, L. rufaxilla, L. plumbeiceps and Leptotrygon veraguensis. In total, we included 68 individual genetic sequences, considering samples deposited in GenBank.
DNA was extracted using both a Qiagen DNeasy Blood and Tissue Kit following the manufacturer’s protocol, as well as a phenol-chloroform extraction protocol (Sambrook and Russell, 2006). We amplified and sequenced two mitochondrial DNA markers [NADH, dehydrogenase subunit 2 (ND2) and the cytochrome C oxidase subunit 1 (COI)]; and one nuclear marker [the β-fibrinogen intron 7 (β-fibint 7)] via the polymerase chain reaction (PCR) following standardized protocols (Lorenz, 2012). We used primers L5215-H5766 and 487L-H6313 (Sorenson et al., 1999) for ND2, L6626-H7005 (Hafner et al., 1994) for COI, and B17L-B17U (Prychitko and Moore, 1997) for β-fibint 7. These molecular markers provide good resolution when analyzing phylogenetic relationships and biogeographic patterns in Columbiformes, in addition to show high phylogenetic consistency between mtDNA and nDNA in some studies at the supraspecific level (Johnson and Clayton, 2000; Pereira et al., 2007; Johnson and Weckstein, 2011; Sweet and Johnson, 2015; Sweet et al., 2017; Sangster et al., 2018). PCR products were visualized in agarose gels (1.3%) stained with ethidium bromide (0.5 μL/mL). Purification and sequencing processes were performed at Macrogen Inc., South Korea. Chromatograms were edited using Geneious Prime 2019.0.4 (Kearse et al., 2012) and multiple alignments were performed using MAFFT (Katoh and Standley, 2013) with default parameters.
2.2
Model selection and phylogenetic analyses
Partition schemes and sequence evolution models for Bayesian Inference were selected using PartitionFinder v2.1.1 (Lanfear et al., 2017). Molecular evolution models selected for each of the partition schemes are shown in Appendix Table S2. Phylogenies were generated using Maximum Likelihood (ML) and Bayesian Inference (BI). For ML, we used RAxMLGUI (Silvestro and Michalak, 2012), with the selected partition scheme, the GTR substitution model and the algorithm “ML + rapid bootstrap” (Stamatakis et al., 2008), and 10,000 iterations. We used MrBayes for estimating BI trees, which were obtained using the partition schemes and selected models as previously described (Huelsenbeck and Ronquist, 2001; Ronquist and Huelsenbeck, 2003). We ran 10,000,000 generations in four parallel runs and eight Markov Chain Monte Carlo (MCMC) sampling every 1000 generations. We used Tracer 1.7 (Rambaut et al., 2018) to determine a stationary phase and the burn-in, and used FigTree v1.4.3 (Rambaut, 2009) to visualize the consensus tree.
2.3
Divergence time estimation
Divergence times were estimated in BEAST v.1.10.4 (Suchard et al., 2018) using the partition schemes and substitution models previously selected. We applied a strict molecular clock with a Yule speciation process (Steel and McKenzie, 2001). Since we were analyzing genetic patterns at intraspecific level, we opted for a strict molecular clock, which assumes a single rate of constant evolution throughout the phylogeny (Pybus, 2006). We applied a divergence rate of 1.96% (0.0098 ± 0.0005 substitutions/site/Myr) for the mitochondrial markers (Sweet and Johnson, 2015), and a divergence rate of 0.53% (0.00265 ± 0.0005 substitutions/site/Myr) for β-fibint 7 (Johnson and Clayton, 2000). Two independent runs of 20,000,000 generations were generated starting from different random points, corroborating the −lnL values and values of the effective sample sizes (ESSs) > 200 for all of the parameters in Tracer 1.7 (Rambaut et al., 2018). We used LogCombiner for combining the output files and TreeAnnotator (Drummond and Rambaut, 2015) for obtaining a maximum credibility tree (MCCT) with a burn-in of 25% and a posterior probability limit of 0.5%.
2.4
Phylogeography
As a measure of genetic differentiation between populations, we calculated genetic fixation from the FST estimator, and interpreted its values based on Hartl and Clark (1997). From this index, the rate of gene flow between populations or Nm can be estimated, the higher this value the higher the gene flow (Nei, 1987). Genetic distances were measured using the Nei corrected distance parameter DXY (Nei, 1987). Populations were identified according to the phylogeny and haplotype networks. Historical demography analyses for each clade were calculated using the R2 test, which has been shown to have a superior statistical power in small sample sizes (Ramos-Onsins and Rozas, 2002). The significance of the R2 test was estimated through 1000 coalescent simulations for each clade. All phylogeographic tests and genetic diversity estimates were obtained in DnaSP v.6.12.01 (Rozas et al., 2017). Given that ND2 and COI have different sample size numbers, we built different haplotype networks in Network 10.1 using a Median Joining Network algorithm (Bandelt et al., 1999). We assessed genetic variation in L. verreauxi via an Analysis of Molecular Variance (AMOVA) in Arlequin 3.5.2.2 (Excoffier et al., 2005). Significance was estimated via two independent analyses with 16,000 permutations based on pairwise differences: one included all populations, while another included only populations present in the IT, to test whether the levels of variation were consistent when only these populations are considered.
2.5
Ecological niche models
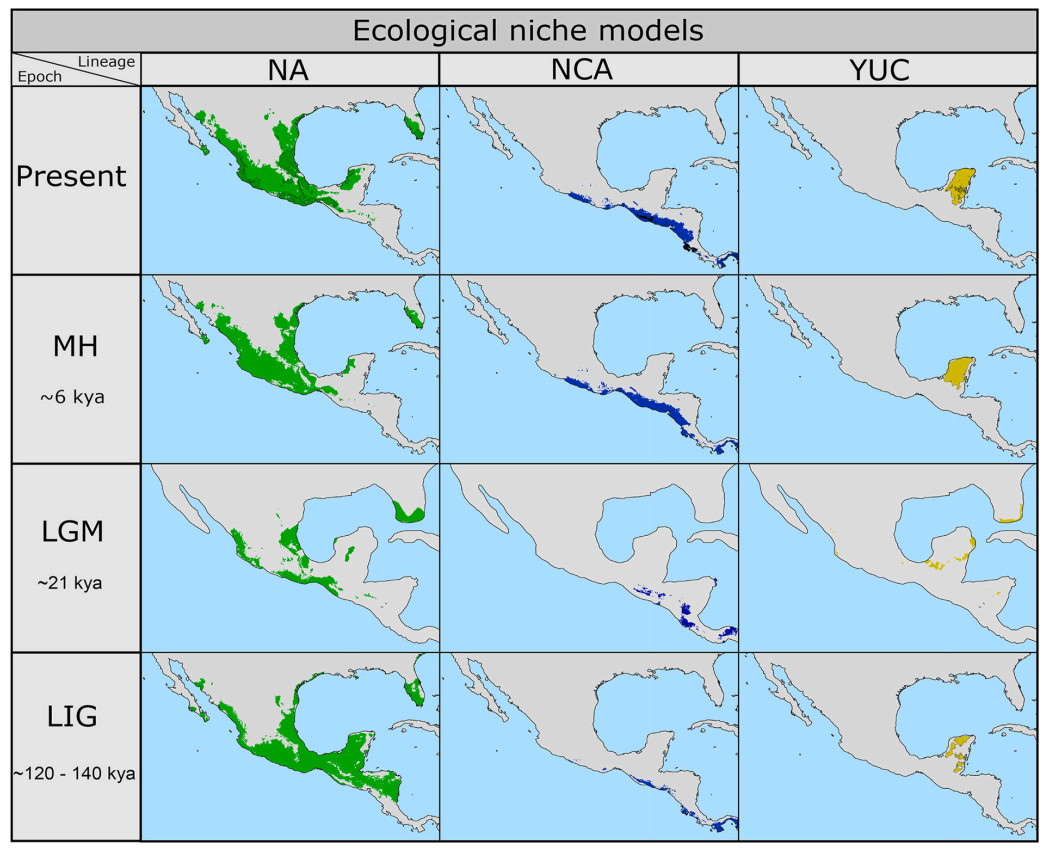
Since Pleistocene climatic changes have significantly influenced the evolution and biogeography of lowland taxa in the IT (Castillo-Chora et al., 2021; Sánchez-González et al., 2023), we estimated paleodistribution models for populations of L. verreauxi during the Middle Holocene (MH, ~6000 years ago), Last Glacial Maximum (LGM, ~21,000 years ago), and Last Interglacial (LIG, ~120,000–140,000 years ago), as well as for the Present. For model building, we used the data corresponding to occurrence records of L. verreauxi that we used in molecular analyses, supplemented with those downloaded from the Global Biodiversity Information Facility (GBIF; https://doi.org/10.15468/dl.f7wwag). Duplicated and erroneously georeferenced records were filtered and eliminated for analyses, and we performed a randomized spatial thinning with the R package “spThin” (Aiello-Lammens et al., 2015), which allowed us to build highly accurate models by reducing biases associated to data concentration in some geographic areas. Based on the genetic structure, we divided the total data into three datasets corresponding to each lineage present in the IT. Given that geographic boundaries for each lineage in this lowland taxon are not clear, we generated polygons from occurrence data corresponding to unequivocally assigned genetic samples; this procedure allowed us to reduce identification bias for records from biological collections identified below the species level (Appendix Fig. S1).
We downloaded environmental variables for the present and for past scenarios corresponding to the MH, LGM, and LIG from WorldClim 1.4 (Hijmans et al., 2005) with a resolution of 2.5 min. For the MH and the LGM models, we used layers from three different Atmosphere-Ocean General Circulation Models: CCSM4 (Community Climate System Model) (Gent et al., 2011), MIROC-ESM (Model for Interdisciplinary Research on Climate) (Hasumi and Emori, 2004), and MPI-ESM-P (Max Planck Institute) (Baehr et al., 2015); layers corresponding to the present and the LIG were downloaded from the CCSM4 model. We retained environmental variables with a greater contribution to the present distribution ranges, while variables with high collinearity were eliminated via the variance inflation factor (VIF), with a VIF >10 as implemented in the R package “corrplot” (Wei and Simko, 2021). We therefore selected nine bioclimatic variables: mean diurnal range (BIO2), isothermality (BIO3), max temperature of warmest month (BIO5), mean temperature of wettest quarter (BIO8), precipitation of wettest month (BIO13), precipitation of driest month (BIO14), precipitation seasonality (BIO15), precipitation of warmest quarter (BIO18) and precipitation of coldest quarter (BIO19).
We used the “Grinnell” v.0.0.21 R package (Machado-Stredel et al., 2021) to define an accessibility area (M) for each lineage (Appendix Fig. S2) based on estimates of the historical accessible area derived from simulations considering biological processes such as dispersal, colonization, and information on climate change over time. These M areas were further refined through comparisons with the terrestrial ecoregions (Dinerstein et al., 2017), and biogeographic provinces of the Neotropics layers (Morrone, 2014). All environmental models corresponding to the present and projections to the past were generated using the maximum entropy algorithm in Maxent v3.4.4 (Phillips et al., 2017) as implemented in “KUENM” v 1.1.9 package (Cobos et al., 2019), that is designed to strengthen the model calibration and creation process, via the generation of a set of candidate models to select one or several optimal models from certain parameterizations. Finally, to explore potential regions with low reliability for model transference to the past, we performed extrapolation risk analyses via the Mobility-oriented parity (MOP) test in “NicheToolbox” (Osorio-Olvera et al., 2020). The final models were edited in QGIS v3.18 (QGIS Development Team, 2022; http://www.qgis.org/)
2.6
Niche conservatism and range-breaking tests
Due to the absence of conspicuous geographic barriers across the lowland distributional range of L. verreauxi, we explored if genetic structure has been maintained through ecological niche differentiation in the different lineages detected in Mesoamerica. We compared the ecological niches through paired tests of niche conservatism between each lineage; additionally, we tested whether environmental differences across the IT may act as an ecological barrier separating these lineages. All these analyses were performed using “ENMTools” (Warren et al., 2021).
Niche conservatism models were generated with Maxent models (Phillips et al., 2017) to perform pairwise comparisons between the observed lineages. These analyses compare the overlapping of empirical models with a null distribution constructed from a set of pseudo-replicates using Monte Carlo methods. Empirical and pseudoreplicated values were calculated from measures of niche overlap (Schoener’s D) via 100 replicates to generate the null distribution across all tests. We test whether niches differ from what is expected by chance via a niche equivalence test (or identity test) and the symmetric background similarity test (Warren et al., 2021). Niche equivalence and similarity tests were conducted using model-based techniques test as implemented in ENMTools (Warren et al., 2021). To assess the role of environmental differences as a barrier for dispersal of the lineages across the IT, we used blob and ribbon range-breaking tests (Glor and Warren, 2011). Blob range-breaking test evaluates whether regions occupied by each lineage are more environmentally different than expected by chance; if so, the environmental differences would represent an abrupt biogeographical barrier. On the other hand, ribbon range-breaking test assesses whether unsuitable habitat divides areas of suitable habitat for each of the lineages which may function as a biogeographical boundary (Warren et al., 2021). We selected two areas that may functioning as a barrier for dispersal (the “ribbon”) in this lowland taxon: 1) the Sierra del Tolistoque, in the southern IT, and 2) the wetland region in the southern Gulf of Mexico. These two areas may serve as barriers due to apparent environmental differences on each side, maintaining lineage divergence despite confirmed overlap between the NA and NCA lineages in the southern IT. To optimize the ribbon range-breaking test, we generated a set of random points within the two selected areas due to the small number of occurrence records.
3.
Results
We obtained 48 sequences corresponding to ND2 (1041 base pairs, bp), 26 to COI (379 bp) and 16 to β-fibint 7 sequences (1136 bp). mtDNA topologies obtained from BI and ML analyses were highly similar. The tree showed two highly supported monophyletic groups for L. verreauxi (Fig. 1), separated by the IT. One group included the North American (NA) clade, distributed west of the IT, and a few from northwestern Chiapas (geographically east of the IT); the other main group, distributed east of the IT, is subdivided in two groups, each of which present further well-supported groupings. Samples from the Soconusco region in the Pacific slope in southeastern Mexico were grouped in a Northern Central American Clade (NCA), which is sister to the Yucatán Peninsula clade (YUC), while samples from Southern Central America and northern South America (SCA) formed a clade sister to west and central South America samples (SA).
Our mtDNA phylogeographic analyses showed two sympatric lineages in the southern IT region (Fig. 1). The NA lineage is distributed across the region in both the Pacific and Gulf slopes, while the NCA lineage is apparently restricted to the dry forests south of the IT in the Pacific slope. The nDNA tree (Appendix Fig. S3) did not show a clear geographic structure. Most of the samples of Leptotila species used as outgroup were included in a group sister to several L. verreauxi samples. The other group included most of samples distributed west of the IT (angelica and capitalis), two samples from NCA (bangsi), and an outgroup species, L. jamaicensis. These groups shared indels that coincide in position and length, with low nodal support (PP > 0.76 and BS > 70).
3.1
Divergence times
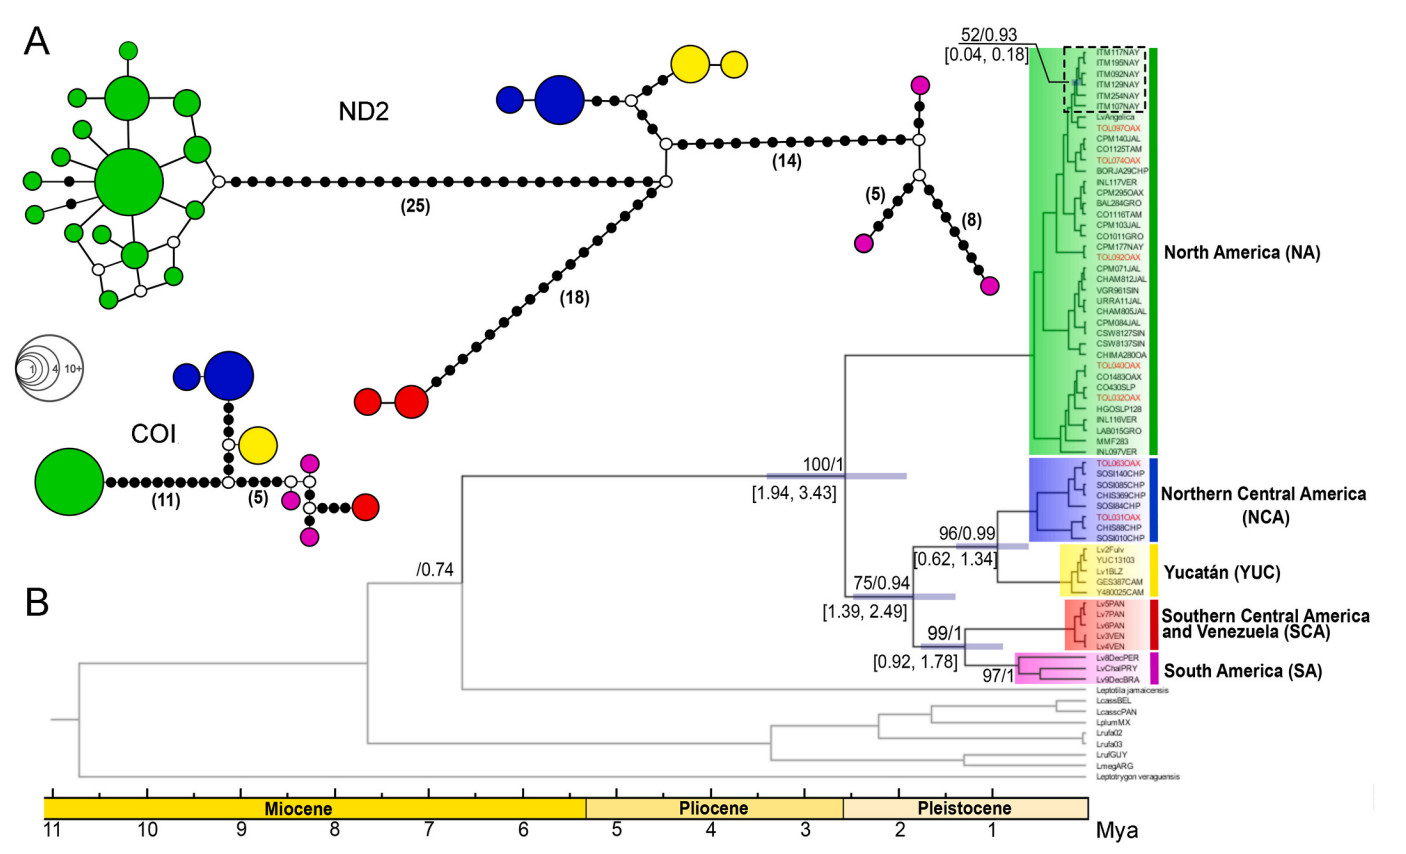
Our data suggest a divergence event during the Late Pliocene – Lower Pleistocene transition at approximately 2.5 Mya [1.94–3.43 Mya, 95% Height Posterior Density (HPD)] between the group west of the IT (the NA clade) and the group east of the IT. Further divergence events in the group east of the IT occurred between the clades SCA–SA and the clades NCA and YUC during the Lower Pleistocene around 1.89 Mya (1.39–2.49, HPD). The most recent divergences occurred between NCA and Yucatan at 0.9 Mya (0.62–1.34, HPD) and between SCA and SA at 0.92–1.78 Mya. A recent differentiation event between populations of the Tres Marías islands (L. v. capitalis) and rest of NA clade occurred around 100 kya (0.04–0.18, HDP).
3.2
Phylogeography
The haplotype network for the mDNA markers showed the same structure as the phylogeographic tree (Fig. 2). We found 25 haplotypes in ND2 and 8 haplotypes in COI. In both haplotype networks, we found a relatively large number of mutational steps separating two main clades roughly divided at the IT (25 in ND2 and 11 in COI), while NCA and Yucatán clades are separated by a smaller number of mutational steps (14 in ND2 and 5 in COI). We detected a star-like pattern in the NA clade; shapes are unclear for the other clades. The demographic R2 test showed population expansion for the NA clade (P < 0.05); however, R2 values for NCA and YUC were not statistically significant (P > 0.05 for both).
Figure
2.
Phylogenetics of Leptotila verreauxi. (A) mtDNA haplotype network. Black dots represent mutational steps, while circles indicate possible extinct or unsampled haplotypes. Circle size represent the frequency of haplotypes. (B) mtDNA tree. Numbers above nodes correspond to Bootstrap/posterior probability values; numbers below nodes indicate 95% HPD (High Posterior Density) ranges for divergence dates (in Mya). The dotted black box groups samples from the Tres Marías Islands. Red labels in the terminals correspond to sympatric samples from the Sierra del Tolistoque in the southern IT. (For interpretation of the references to color in this figure legend, the reader is referred to the Web version of this article.)
The FST, Nm, and DXY indices showed a strong differentiation in most of the populations (Table 1). All the FST values are close to 1.0, signifying high genetic fixation and nearly complete haplotypic separation, in all lineages, as expected in genetically structured populations. Nm in the other hand, indicated less than one migrant every four generations. Genetic distances, as measured by the Nei corrected distance parameter DXY revealed high levels of genetic differentiation (>2%) for all paired comparisons, except for NCA-YUC with 0.00748 (0.7%).
Table
1.FST values (below the diagonal) and DXY values (above the diagonal) for the different L. verreauxi lineages. Values in the parentheses represent the number of migrants (Nm) per generation.
The AMOVA analysis (Table 2) including all populations showed that 95.9% of the genetic variation is found between populations, while only 4.06% is found within populations. The results are similar when the NA-NCA lineages are included.
Table
2.
Results of AMOVA of the L. verreauxi populations.
Distribution models for the present and projections to the past showed high performance in each of the lineages (Table 3), with models that are significantly better than expected by chance (AUC ratio >1) and p-values <0.001. For the NA clade, environmental variables with highest contribution were precipitation seasonality and precipitation of wettest month (BIO 15 = 28.1%, BIO 13 = 22.3%, respectively); while for NCA were isothermality and mean diurnal range (BIO 3 = 48.3%, BIO 2 = 30.4%, respectively). In the case of YUC, precipitation of wettest month and precipitation of warmest quarter (BIO 13 = 48.4%, BIO 18 = 8.9%, respectively).
Table
3.
Summary of model performance statistics per lineage.
The areas of high environmental suitability for the three Mesoamerican lineages showed clear geographic changes in comparison to present (Fig. 3). During the LIG, NCA and YUC showed a smaller geographic distribution in small and isolated habitat patches. NA showed an increase in the geographic extension of the environmental suitability in southeastern Mexico and northern Central America. During the LGM, NA experienced a reduction in suitable areas, being restricted to three main lowland areas in both slopes and an almost complete disappearance of suitability areas south of the IT. Regions such as YUC exhibited a decrease in environmental suitability, while NCA lineage showed an increase of the suitable conditions towards the MH. It is important to observe that all the three lineages experienced an increase in the environmental suitable areas; these areas have been apparently maintained towards the Present. According to environmental suitability maps, current contact zones across IT may have not been formed until recently (at least since LGM), as most of suitable areas appear as allopatric through time intervals for which ecological modeling was conducted.
Figure
3.
Ecological niche models of each lineage during the Present, Middle Holocene, Last Glacial Maximum and Last Interglacial. Dark areas in each map in the Present correspond to areas of climatic stability.
Because results of D were similar and I tend to express greater variability, for niche comparisons we focused on the Schoener’s D. The niche identity tests revealed that the niches of each of the three lineages are not identical (i.e, equivalent; empirical Schoener D values lower than the pseudoreplicated values; P < 0.01; Table 4; Appendix Fig. S4). On the other hand, the background similarity tests did not reject the null hypothesis for the NA-NCA comparison, while in the other two comparisons, the null hypothesis was rejected, indicating niche divergence (i.e., the ecological niches of these clades are less similar than expected based on their background environments).
Table
4.
Schoener’s D values of the niche comparison tests (Identity, Similarity and Blob rangebreak).
Lineages
Identity test
Similarity test
Blob rangebreak
NA–NCA
0.297**
0.271ns
0.282ns
NA–YUC
0.169**
0.148*
0.159ns
YUC–NCA
0.090**
0.103*
0.099ns
The significance of the test is shown ns, non-significant; P < 0.05; **P < 0.01.
Range-breaking blob tests did not show empirical values with a significant deviation from the null hypothesis (P > 0.05; Table 4; Appendix Fig. S4), suggesting that no biogeographical barrier is associated with environmental differences across the IT ecological gradient. However, the ribbon range-breaking test for the NA and NCA lineages suggested the presence of a region with less suitable conditions for the NCA lineage in the contact zone (D value, P < 0.01 for the comparison of the NCA lineage vs. the ribbon; Table 5; Appendix Fig. S5). Similarly, the comparison between the NA and YUC lineages suggests the presence of a region of less suitable conditions for the YUC lineage (D value, P < 0.05 for YUC vs. the ribbon; Table 5; Appendix Fig. S6).
Table
5.
Schoener’s D values from the ribbon-rangebreak tests.
L1
L2
L1 vs. L2
L1 vs. Ribbon
L2 vs. Ribbon
Outside vs Ribbon
NA
NCA
0.297ns
0.184ns
0.049**
0.154**
NA
YUC
0.086**
0.253ns
0.263*
0.326ns
The significance of the test is shown ns, non-significant; *, P < 0.05; **, P < 0.01.
Our study illustrates both emergent patterns found in different taxa across the study region, as well as discrepancies between phenotypically-based and molecular-based taxonomies in L. verreauxi.
4.1
Phylogeography
Our phylogenetic tree (Fig. 2) agrees with divergence events described in other studies along the Mexican Pacific slope and the IT in which previously unexpected evolutionary patterns are being revealed (Arcangeli et al., 2018; Castillo-Chora et al., 2021; Sánchez-González et al., 2021, 2023; Llanes-Quevedo et al., 2022). On the other hand, our analyses also show that traditional phenotypically-based taxonomy (Fig. 1) may either fail to correspond with evolutionary patterns as differentiation may lie further east from the IT, perhaps up to the Usumacinta River delta, as in other taxa (Howell and Webb, 1995; Bradley et al., 2008; Ramírez-Díaz et al., 2023); or partially support them, as differentiation between NA and NCA corresponds to the ecological gradient, but for which sympatry in the southern IT (southern Oaxaca) between these same lineages may be (theoretically) unexpected.
Our phylogeographic tree showed further differentiation events within each group divided by the IT (Fig. 1). In the group west of the IT, within the NA clade, all individuals from Tres Marías islands (currently in subspecies capitalis) were grouped, showing a genetic structure consistent with simple paraphyly (Omland et al., 2006), in which lineage sorting seems to be incomplete. Simple paraphyly in this case may be the result of a small number of founders that likely dispersed to the islands (180–40 kya), which is consistent with islands emergence (McCloy et al., 1988) and with dispersal times in other insular bird species (Ortiz-Ramírez et al., 2018). In the group east of IT, genetic differentiation between sister clades YUC and NCA is relatively low (0.7%), also suggesting a recent divergence event. Genetic divergence between east and west Mesoamerican clades in L. verreauxi is very deep, underlying the role of the IT as a significant barrier for differentiation in lowland taxa. Values above traditional species thresholds for species recognition (Seutin et al., 1995; Hebert et al., 2004; Fuchs et al., 2021) were found between NA–NCA (3.8%), as well as between NA and YUC (3.6%). Our analyses also found deep differentiation in the SCA and the SA despite having a small number of samples.
4.2
Biogeography
Previous research in mid-sized New World doves (Leptotila, Geotrygon and Zenaida) suggested that Leptotila dispersed to North America from South America after the closure of the Isthmus of Panama about 3.4 Mya (1.9–5.8 Mya). According to Johnson and Weckstein (2011), this dispersal event allowed for both, the evolution of a northern clade (including all L. verreauxi taxa), and its radiation following a stepping-stone fashion back into South America. However, our results (Fig. 2) suggest two main differentiation events: the first involves North America and Central America + South America, while in the second one the earliest differentiation occurred in South America, thus suggesting that the Central American taxa (NCA and YUC) are the most recent diverged lineages. Our differentiation scenario differs from the stepping-stone biogeographic scenario suggested in Johnson and Weckstein (2011).
Based on our results, lineage differentiation in Mesoamerican L. verreauxi occurred during the Late Pliocene-Pleistocene (Fig. 2) at about 2.6 Mya (1.9–3.4 Mya) with the split of lineages west (NA) and east of the IT (NCA-YUC). This divergence event is consistent with climatic changes that led to vegetation changes across the region, likely severing connections between formerly continuous ecosystems and therefore, allowing persistence of suitable conditions within small patches (Fig. 3, see also Castillo-Chora et al., 2021), which reduced gene flow between lowland populations (e.g., Sánchez-González et al., 2021, 2023). Both The star-like pattern in the haplotype network and R2 statistic for the NA clade support the biogeographic pattern described above, suggesting recent population growth probably due to the expansion of suitable conditions across the region. Demographic patterns in the other clades are unclear from our data.
Divergence date for the west and east groups is also consistent with proposed geographic processes in the region, such as formation of a seaway crossing the IT at approximately 2–3 Mya during the late Pliocene (Barrier et al., 1998), which has been frequently invoked as the main promoter of vicariant events in the region for the differentiation in unrelated lowland taxa, such as mammals (Whitmore and Stewart, 1965), geckos (Butler et al., 2023), and montane birds (Ornelas et al., 2013). The seaway hypothesis, however, has been challenged (Wyatt Durham et al., 1955; Mulcahy et al., 2006), and alternative hypothesis have been proposed, such as the ecological niche divergence (see Sánchez-González et al., 2023). Although the hypothesis related to a seaway across the IT may explain west-east divergence pattern, further differentiation events across the north to south ecological gradient have been described in other vertebrates, such as reptiles (Parkinson et al., 2000; Zarza et al., 2008; Gray et al., 2019; Butler et al., 2023).
4.3
Secondary contact
Our analyses revealed a secondary contact zone for the NA and NCA lineages south of the IT (Fig. 1), in which genetically divergent individuals are syntopic in the seasonally dry forests foothills of the Pacific slope of the Sierra del Tolistoque, Oaxaca. Sympatric lineages with a deep genetic divergence, such as these in L. verreauxi, have been rarely reported in birds (Hogner et al., 2012; Benham and Cheviron, 2019; Pons et al., 2019), but also in other groups (Tominaga et al., 2009; Xiao et al., 2012).
Different causes may result in the establishment of a secondary contact zone (Benham and Cheviron, 2019). Sympatric overlap of distinct lineages is typically interpreted as the result of formerly isolated divergent populations that resumed secondary contact (Hogner et al., 2012; Benham and Cheviron, 2019). Pleistocene climatic fluctuations may have promoted the divergence of the west and east groups across the IT, which may have been restricted to allopatric stable climatic areas (Fig. 3). After the disappearance of the barrier (either geographical or ecological), populations are expected to expand to ecologically suitable areas. However, environmental differences in the landscape and biological interactions (e.g., competitive exclusion) between taxa with similar niches may slow down the recolonization process (Anderson et al., 2002), acting as a reinforcement that may help in maintaining differentiation over time.
4.4
Ecological niche differentiation
Estimating ecological niches using intraspecific lineages or subspecies as units can represent their niche more accurately, without ignoring local adaptive responses as would occur when estimating models at the species level (Smith et al., 2019). Our comparisons showed that the ecological niches of the three L. verreauxi lineages are non-equivalent. However, our analyses detected niche similarity in the NA-NCA comparison, but niches were not similar for the clades found to the east of the IT. In the case of NA–NCA, both lineages are occupying different environments and climatic conditions, but ecological niches are similar, and therefore may evolve slowly (Peterson et al., 1999).
The similarity in the ecological niches of the NA and NCA may explain, in part, their sympatric distribution in the southern IT. For the clades eastern of the IT, comparisons in NA-YUC and YUC-NCA indicated that niches are not equivalent nor similar, suggesting niche divergence.
According to range-breaking tests, environmental differences across the north to south ecological gradient in the IT do not represent an abrupt environmental barrier for dispersal of the populations of L. verreauxi between habitats. Thus, our results suggest that the secondary contact zone in southern IT may have less suitable conditions for dispersal of NCA, than for NA. Thus, NCA populations are seemingly less tolerant to dry forest climatic conditions on Pacific slope of the IT, which likely prevents its dispersal further west. NA populations, however, seem to be tolerant to both humid and dry conditions, suggesting that other factors, such as the role of biological interactions at local scales (e.g., competition) between both lineages should be considered in maintaining this limited secondary contact zone. A further possibility is related to the seasonal differences in the precipitation between the dry forests of the southern IT and the mesic forests of the Soconusco region in coastal Chiapas (Binford, 1989): the seasonal increase of humidity would allow the dispersal of the mesic-adapted NCA further north to be in contact with NA in the southern IT. We suggest that this secondary contact zone, has been maintained through limited ecological suitability for NCA to the west of the IT, while to the east, divergence may have been maintained via ecological interactions or seasonal movements. We lack data on lineages north of the IT, where NA and YUC may overlap due to the absence of conspicuous barriers; a shallow genetic divergence however between these two lineages, suggests a corridor across the Usumacinta River drainage.
The Isthmus of Tehuantepec is an area long-recognized as a geographic limit for several North American bird families (Navarro-Sigüenza et al., 2014), as well as a promoter of speciation and ecological differentiation, particularly for montane bird taxa, which have different species divided by the Tehuantepec Valley (Barber and Klicka, 2010). However, its role as a barrier for lowland bird taxa is still poorly understood (see Binford, 1989). Patterns of divergence in lowland populations in the Isthmus region should be viewed with caution due to a dynamic biotic history, which due to changes in ecological conditions has likely promoted ecological niche differentiation, as suggested in several bird taxa (Castillo-Chora et al. 2021; Sánchez-González et al, 2021, 2023; Llanes-Quevedo et al., 2022).
Declaration of competing interest
The authors declare no conflict of interest.
Ethics statement
Specimens and tissues used in this project were collected under permits granted by the Secretaría del Medio Ambiente y Recursos Naturales (SEMARNAT) of the Mexican Government.
CRediT authorship contribution statement
Orlando J. Espinosa-Chávez: Writing – original draft, Resources, Project administration, Methodology, Investigation, Funding acquisition, Formal analysis, Data curation, Conceptualization. Adolfo G. Navarro-Sigüenza: Writing – review & editing, Supervision, Data curation. Hernando Rodríguez-Correa: Writing – review & editing, Supervision. Luis A. Sánchez-González: Writing – review & editing, Writing – original draft, Supervision, Project administration, Methodology, Investigation, Funding acquisition, Formal analysis, Data curation, Conceptualization.
Acknowledgments
This paper is part of the fulfillments of OJE-C master’s degree project in the Posgrado en Ciencias Biológicas, UNAM, who also had a CGEP Scholarship for UNAM postgraduate studies. Many thanks to the financial support for this study by PAPIIT- UNAM grant (IN222817) to LAS-G, and the François Vuilleumier Fund for Neotropical Bird Research from the Neotropical Ornithological Society (NOS) awarded to OJE-C. Special tanks to Uri O. García-Vázquez and David A. Prieto-Torres for comments to early drafts. We appreciate comments by two anonymous reviewers, which greatly improved our paper.
Aiello-Lammens, M.E., Boria, R.A., Radosavljevic, A., Vilela, B., Anderson, R.P., 2015. spThin: An R package for spatial thinning of species occurrence records for use in ecological niche models. Ecography 38, 541-545. .
Anderson, R.P., Peterson, A.T., Gómez-Laverde, M., 2002. Using niche-based GIS modeling to test geographic predictions of competitive exclusion and competitive release in South American pocket mice. Oikos 98, 3–16.
Arcangeli, J., Light, J.E., Cervantes, F.A., 2018. Molecular and morphological evidence of the diversification in the gray mouse opossum, Tlacuatzin canescens (Didelphimorphia), with description of a new species. J. Mammal. 99, 138-158. .
Baehr, J., Fröhlich, K., Botzet, M., Domeisen, D.I.V., Kornblueh, L., Notz, D., et al., 2015. The prediction of surface temperature in the new seasonal prediction system based on the MPI-ESM coupled climate model. Clim. Dyn. 44, 2723-2735. https://doi.org/10.1007/s00382-014-2399–7.
Bandelt, H-J., Forster, P., Rohl, A., 1999. Median-joining networks for inferring intraspecic phylogenies. Mol. Biol. 16, 37-48. .
Barber, B.R., Klicka, J., 2010. Two pulses of diversification across the Isthmus of Tehuantepec in a montane Mexican bird fauna. Proc. R. Soc. A B 277, 2675-2681. .
Barrier, E., Velasquillo, L., Chavez, M., Gaulon, R., 1998. Neotectonic evolution of the Isthmus of Tehuantepec (southeastern Mexico). Tectonophysics 287, 77-96. https://doi.org/10.1016/S0040-1951(98)80062–0.
Benham, P.M., Cheviron, Z.A., 2019. Divergent mitochondrial lineages arose within a large, panmictic population of the Savannah sparrow (Passerculus sandwichensis). Mol. Ecol. 28, 1765-1783. .
Benson, D.A., Cavanaugh, M., Clark, K., Karsch-Mizrachi, I., Lipman, D.J., Ostell, J., et al., 2013. GenBank. Nucleic Acids Res. 41, D36-42. .
Binford, L.C., 1989. A distributional survey of the birds of the Mexican state of Oaxaca. American Ornithologists’ Union.
Bradley, R.D., Henson, D.D., Durish, N.D., 2008. Re-evaluation of the geographic distribution and phylogeography of the Sigmodon hispidus complex based on mitochondrial DNA sequences. Southwestern Nat. 53, 301.
Butler, B.O., Smith, L.L., Flores-Villela, O., 2023. Phylogeography and taxonomy of Coleonyx elegans Gray 1845 (Squamata: Eublepharidae) in Mesoamerica: The Isthmus of Tehuantepec as an environmental barrier. Mol. Phylogenet. Evol. 178, 107632. .
Castillo-Chora, V.D.J., Sánchez-González, L.A., Mastretta-Yanes, A., Prieto-Torres, D.A., Navarro-Sigüenza, A.G., 2021. Insights into the importance of areas of climatic stability in the evolution and maintenance of avian diversity in the Mesoamerican dry forests. Biol. J. Linn. Soc. 132, 741-758. .
Cobos, M.E., Townsend Peterson, A., Barve, N., Osorio-Olvera, L., 2019. Kuenm: An R package for detailed development of ecological niche models using Maxent. PeerJ 7, e6281. .
Dinerstein, E., Olson, D., Joshi, A., Vynne, C., Burgess, N.D., Wikramanayake, E., et al., 2017. An ecoregion-based approach to protecting half the terrestrial realm. BioScience 67, 534-545. .
Drummond, A.J., Rambaut, A., 2015. Bayesian evolutionary analysis by sampling trees.
In: Bayesian Evolutionary Analysis with BEAST, pp. 79–96.
Edwards, E.P., Lea, R.B., 1955. Birds of the Monserrate area, Chiapas, Mexico. Condor 57, 31-54. .
Excoffier, L., Laval, G., Schneider, S., 2005. Arlequin (version 3.0): An integrated software package for population genetics data analysis. Evol. Bioinforma. 1, 47-50. .
Ferrusquia-Villafranca, I., 1993. Geology of Mexico: a synopsis. Biological Diversity of Mexico: Origins and Distribution.
Friedmann, H., Griscom, L., Moore, R.T., 1950. Distributional Check-List of the Birds of Mexico, Part I. Pacific Coast Avifauna Number 29. Cooper Ornithological Club, Berkeley.
Fuchs, J., Bowie, R.C.K., Melo, M., Boano, G., Pavia, M., Fjeldsa, J., 2021. Phylogeographical history of the Olive Woodpecker Dendropicos griseocephalus, a species widely distributed across Africa. Ibis 163, 417-428. .
García-Moreno, J., Navarro-Sigüenza, A.G., Peterson, A.T., Sánchez-González, L.A., 2004. Genetic variation coincides with geographic structure in the common bush-tanager (Chlorospingus ophthalmicus) complex from Mexico. Mol. Phylogenet. Evol. 33, 186-196. .
Gent, P.R., Danabasoglu, G., Donner, L.J., Holland, M.M., Hunke, E.C., Jayne, S.R., et al., 2011. The community climate system model version 4. J. Clim. 24, 4973-4991. .
Gill, F., Donsker, D., Rasmussen, P., 2021. IOC World Bird List, 13.1. .
Glor, R.E., Warren, D., 2011. Testing ecological explanations for biogeographic boundaries. Evolution 65, 673-683. .
Gray, L.N., Barley, A.J., Poe, S., Thomson, R.C., Nieto-Montes de Oca, A., Wang, I.J., 2019. Phylogeography of a widespread lizard complex reflects patterns of both geographic and ecological isolation. Mol. Ecol. 28, 644-657. .
Hafner, M.S., Sudman, P.D., Villablanca, F.X., Spradling, T.A., Demastes, J.W., Nadler, S.A., 1994. Disparate rates of molecular evolution in cospeciating hosts and parasites. Science 265, 1087-1090. .
Hartl, D.L., Clark, A.G., 1997. Principles of population genetics. Sinauer associates Sunderland.
Hebert, P.D.N., Stoeckle, M.Y., Zemlak, T.S., Francis, C.M., 2004. Identification of birds through DNA barcodes. PLoS Biol. 2, e312. .
Hijmans, R.J., Cameron, S.E., Parra, J.L., Jones, P.G., Jarvis, A., 2005. Very high-resolution interpolated climate surfaces for global land areas. Int. J. Climatol. 25, 1965-1978. .
Hogan, K.M., 1999. White-tipped dove (Leptotila verreauxi). In: Poole, A., Gill, F. (Eds.), The Birds of North America, No. 436. The Birds of North America, Inc., Philadelphia, P A.
Hogner, S., Laskemoen, T., Lifjeld, J.T., Porkert, J., Kleven, O., Albayrak, T., et al., 2012. Deep sympatric mitochondrial divergence without reproductive isolation in the common redstart Phoenicurus phoenicurus. Ecol. Evol. 2, 2974-2988. .
Howell, S.N.G., Webb, S., 1995. A Guide to the Birds of Mexico and Northern Central America. Oxford University Press, Oxford.
Johnson, K.P., Clayton, D.H., 2000. Nuclear and mitochondrial genes contain similar phylogenetic signal for pigeons and doves (Aves: Columbiformes). Mol. Phylogenet. Evol. 14, 141-151. .
Johnson, K.P., Weckstein, J.D., 2011. The Central American land bridge as an engine of diversification in New World doves. J. Biogeogr. 38, 1069-1076. .
Katoh, K., Standley, D.M., 2013. MAFFT multiple sequence alignment software version 7: Improvements in performance and usability. Mol. Biol. Evol. 30, 772-780. .
Kearse, M., Moir, R., Wilson, A., Stones-Havas, S., Cheung, M., Sturrock, S., et al., 2012. Geneious Basic: An integrated and extendable desktop software platform for the organization and analysis of sequence data. Bioinformatics 28, 1647-1649. .
Lanfear, R., Frandsen, P.B., Wright, A.M., Senfeld, T., Calcott, B., 2017. Partitionfinder 2: New methods for selecting partitioned models of evolution for molecular and morphological phylogenetic analyses. Mol. Biol. Evol. 34, 772-773. .
Llanes-Quevedo, A., Mastretta-Yanes, A., Sánchez-González, L.A., Castillo-Chora, V.J., Navarro-Sigüenza, A.G., 2022. The tangled evolutionary history of a long-debated Mesoamerican taxon: The Velazquez Woodpecker (Melanerpes santacruzi, Aves: Picidae). Mol. Phylogenet. Evol. 170, 107445. .
Lorenz, T.C., 2012. Polymerase chain reaction: Basic protocol plus troubleshooting and optimization strategies. J. Vis. Exp. 63, e3998. .
Machado-Stredel, F., Cobos, M.E., Peterson, A.T., 2021. A simulation-based method for selecting calibration areas for ecological niche models and species distribution models. Front. Biogeogr. 13, e48814. .
McCloy, C., Ingle, J.C., Barron, J.A., 1988. Neogene stratigraphy, foraminifera, diatoms, and depositional history of Maria Madre Island, Mexico: Evidence of early Neogene marine conditions in the southern Gulf of California. Mar. Micropaleontol. 13, 193-212. https://doi.org/10.1016/0377-8398(88)90003–5.
Morrone, J.J., 2010. Fundamental biogeographic patterns across the Mexican Transition Zone: an evolutionary approach. Ecography 33, 355-361. .
Morrone, J.J., 2014. Biogeographical regionalisation of the Neotropical region. Zootaxa 3782, 1-110. .
Mulcahy, D.G., Morrill, B.H., Mendelson III, J.R., 2006. Historical biogeography of lowland species of toads (Bufo) across the Trans-Mexican Neovolcanic Belt and the Isthmus of Tehuantepec. J. Biogeogr. 33, 1889–1904.
Navarro-Sigüenza, A.G., Townsend Peterson, A., Nyari, A., García-Deras, G.M., García-Moreno, J., 2008. Phylogeography of the Buarremon brush-finch complex (Aves, Emberizidae) in Mesoamerica. Mol. Phylogenet. Evol. 47, 21-35. .
Navarro-Sigüenza, A.G., Rebon-Gallardo, M.F., Gordillo-Martinez, A., Peterson, A.T., Berlanga-García, H., Sánchez-González, L.A., 2014. Biodiversidad de aves en Mexico. Rev. Mex. Biodivers. 85, 476-495. .
Nei, M., 1987. Molecular Evolutionary Genetics. Columbia University Press, New York.
Omland, K.E., Baker, J.M., Peters, J.L., 2006. Genetic signatures of intermediate divergence: population history of Old and New World Holarctic ravens (Corvus corax). Mol. Ecol. 15, 795-808. .
Ornelas, J.F., Sosa, V., Soltis, D.E., Daza, J.M., González, C., Soltis, P.S., et al., 2013. Comparative phylogeographic analyses illustrate the complex evolutionary history of threatened cloud forests of northern Mesoamerica. PLoS One 8, 56283. .
Ortiz-Ramírez, M.F., Andersen, M.J., Zaldívar-Riverón, A., Ornelas, J.F., Navarro-Sigüenza, A.G., 2016. Geographic isolation drives divergence of uncorrelated genetic and song variation in the Ruddy-capped Nightingale-Thrush (Catharus frantzii; Aves: Turdidae). Mol. Phylogenet. Evol. 94, 74-86. .
Ortiz-Ramírez, M.F., Sánchez-González, L.A., Castellanos-Morales, G., Ornelas, J.F., Navarro-Sigüenza, A.G., 2018. Concerted Pleistocene dispersal and genetic differentiation in passerine birds from the Tres Marias Archipelago, Mexico. Auk 135, 716-732. .
Osorio-Olvera, L., Lira-Noriega, A., Soberón, J., Peterson, A.T., Falconi, M., Contreras-Díaz, R.G., et al., 2020. ntbox: An r package with graphical user interface for modelling and evaluating multidimensional ecological niches. Methods Ecol. Evol. 11, 1199-1206. .
Pereira, S.L., Johnson, K.P., Clayton, D.H., Baker, A.J., 2007. Mitochondrial and nuclear DNA sequences support a Cretaceous origin of Columbiformes and a dispersal-driven radiation in the Paleogene. Syst. Biol. 56, 656-672. .
Peterson, A.T., Soberón, J., Sánchez-Cordero, V., 1999. Conservatism of ecological niches in evolutionary time. Science 285, 1265-1267. .
Phillips, S.J., Anderson, R.P., Dudik, M., Schapire, R.E., Blair, M.E., 2017. Opening the black box: an open-source release of Maxent. Ecography 40, 887-893. .
Pons, J-M., Masson, C., Olioso, G., Fuchs, J., 2019. Gene flow and genetic admixture across a secondary contact zone between two divergent lineages of the Eurasian Green Woodpecker Picus viridis. J. Ornithol. 160, 935-945. https://doi.org/10.1007/s10336-019-01675–6.
Prychitko, T.M., Moore, W.S., 1997. The utility of DNA sequences of an intron from the β-Fibrinogen gene in phylogenetic analysis of woodpeckers (Aves: Picidae). Mol. Phylogenet. Evol. 8, 193-204. .
Pybus, O.G., 2006. Model selection and the molecular clock. PLoS Biol. 4, 686-688. .
QGIS Development Team, 2022. QGIS Geographic Information System.
Rambaut, A., 2009. FigTree v1.4.3. , 4.22.23.
Rambaut, A., Drummond, A.J., Xie, D., Baele, G., Suchard, M.A., 2018. Posterior summarization in Bayesian phylogenetics using Tracer 1.7. Syst. Biol. 67, 901-904. .
Ramírez-Díaz, C.J., Ramírez-Morillo, I.M., Cortés-Flores, J., de-Nova, J.A., Duno de Stefano, R., Fernández-Concha, G.C., 2023. Biogeographical History of the Yucatan Peninsula Endemic Flora (Spermatophyta) from a Phylogenetic Perspective. Harvard Pap. Bot. 28, 99-120, .
Ramos-Onsins, S.E., Rozas, J., 2002. Statistical properties of new neutrality tests against population growth. Mol. Biol. Evol. 19, 2092-2100. .
Rodríguez-Correa, H., González-Rodríguez, A., Oyama, K., 2017. Perspectivas de la ecologia molecular en un pais megadiverso. Rev. Mex. Biodivers. 88, 3-13. .
Rozas, J., Ferrer-Mata, A., Sánchez-Del Barrio, J.C., Guirao-Rico, S., Librado, P., Ramos-Onsins, S.E., et al., 2017. DnaSP 6: DNA sequence polymorphism analysis of large data sets. Mol. Biol. Evol. 34, 3299-3302. .
Sambrook, J., Russell, D.W., 2006. Purification of Nucleic Acids by Extraction with Phenol: chloroform. CSH Protoc. , 2006, pdb.prot4455.
Sánchez-González, L.A., Castillo-Chora, V.J., Arbeláez-Cortés, E., Navarro-Sigüenza, A.G., 2021. Diversification and secondary contact in the magpie-jays (Calocitta) throughout the pacific lowlands of Mesoamerica. J. Zool. Syst. Evol. Res. 59, 2371-2386. .
Sánchez-González, L.A., Cayetano, H., Prieto-Torres, D.A., Rojas-Soto, O.R., Navarro-Sigüenza, A.G., 2023. The role of ecological and geographical drivers of lineage diversification in the Squirrel cuckoo Piaya cayana in Mexico: a mitochondrial DNA perspective. J. Ornithol. 164, 37-53. .
Sangster, G., Sweet, A.D., Johnson, K.P., 2018. Paraclaravis, a new genus for the Purple-winged and Maroon-chested Ground-doves (Aves: Columbidae). Zootaxa 4461, 134. .
Seutin, G., Ratcliffe, L.M., Boag, P.T., 1995. Mitochondrial DNA homogeneity in the phenotypically diverse redpoll finch complex (Aves: Carduelinae: Carduelis flammea-hornemanni). Evolution 49, 962-973. .
Shackleton, N.J., 2000. The 100,000-year Ice-age cycle identified and found to lag temperature, carbon dioxide, and orbital eccentricity. Science 289, 1897–1902.
Silvestro, D., Michalak, I., 2012. RaxmlGUI: A graphical front-end for RAxML. Org. Divers. Evol. 12, 335-337. https://doi.org/10.1007/s13127-011-0056–0.
Smith, A.B., Godsoe, W., Rodríguez-Sánchez, F., Wang, H.H., Warren, D., 2019. Niche estimation above and below the species level. Trends Ecol. Evol. 34, 260-273. .
Sorenson, M.D., Ast, J.C., Dimcheff, D.E., Yuri, T., Mindell, D.P., 1999. Primers for a PCR-based approach to mitochondrial genome sequencing in birds and other vertebrates. Mol. Phylogenet. Evol. 12, 105-114. .
Sosa-López, J.R., González, C., Navarro-Sigüenza, A.G., 2013. Vocal geographic variation in Mesoamerican Common Bush Tanagers (Chlorospingus ophthalmicus). Wilson J. Ornithol. 125, 24-33. .
Stamatakis, A., Hoover, P., Rougemont, J., 2008. A rapid bootstrap algorithm for the RAxML Web Servers. Syst. Biol. 57, 758-771. .
Steel, M., McKenzie, A., 2001. Properties of phylogenetic trees generated by Yule-type speciation models. Math. Biosci. 170, 91-112. https://doi.org/10.1016/S0025-5564(00)00061–4.
Stull, G.W., 2023. Evolutionary origins of the eastern North American-Mesoamerican floristic disjunction: Current status and future prospects. Am. J. Bot. 110, e16142. .
Suchard, M.A., Lemey, P., Baele, G., Ayres, D.L., Drummond, A.J., Rambaut, A., 2018. Bayesian phylogenetic and phylodynamic data integration using BEAST 1.10. Virus Evol. 4. .
Sweet, A.D., Johnson, K.P., 2015. Patterns of diversification in small New World ground doves are consistent with major geologic events. Auk 132, 300-312. .
Sweet, A.D., Maddox, J.D., Johnson, K.P., 2017. A complete molecular phylogeny of Claravis confirms its paraphyly within small New World ground-doves (Aves: Peristerinae) and implies multiple plumage state transitions. J. Avian Biol. 48, 459-464. .
Tominaga, K., Watanabe, K., Kakioka, R., Mori, S., Jeon, S.R., 2009. Two highly divergent mitochondrial DNA lineages within Pseudogobio esocinus populations in central Honshu, Japan. Ichthyol. Res. 56, 195-199. https://doi.org/10.1007/s10228-008-0071–0.
Tsai, W.L.E., Mota-Vargas, C., Rojas-Soto, O., Bhowmik, R., Liang, E.Y., Maley, J.M., et al., 2019. Museum genomics reveals the speciation history of Dendrortyx wood-partridges in the Mesoamerican highlands. Mol. Phylogenet. Evol. 136, 29-34. .
Vázquez-Miranda, H., Navarro-Sigüenza, A.G., Omland, K.E., 2009. Phylogeography of the Rufous-naped Wren (Campylorhynchus rufinucha): speciation and hybridization in Mesoamerica. Auk 126, 765-778. .
Warren, D.L., Matzke, N.J., Cardillo, M., Baumgartner, J.B., Beaumont, L.J., Turelli, M., et al., 2021. ENMTools 1.0: an R package for comparative ecological biogeography. Ecography 44, 504-511. .
Wei, T., Simko, V., 2021. R Package “Corrplot”: Visualization of a Correlation Matrix.
Whitmore, F.C., Stewart, R.H., 1965. Miocene mammals and Central American seaways. Science 148, 180-185. .
Wogau, K.H., Arz, H.W., Bohnel, H.N., Nowaczyk, N.R., Park, J., 2019. High resolution paleoclimate and paleoenvironmental reconstruction in the northern Mesoamerican frontier for prehistory to historical times. Quat. Sci. Rev. 226, 106001. .
Wyatt Durham, J., Arellano, A.R.V., Peck JR. J.H., 1955. Evidence for no Cenozoic Isthmus of Tehuantepec seaways. GSA Bull. 66, 977-992. .
Xiao, J.H., Wang, N.X., Murphy, R.W., Cook, J., Jia, L.Y., Huang, D.W., 2012. Wolbachia infection and dramatic intraspecific mitochondrial DNA divergence in a fig wasp. Evolution 66, 1907-1916. .
Zarza, E., Reynoso, V.H., Emerson, B.C., 2008. Diversification in the northern neotropics: mitochondrial and nuclear DNA phylogeography of the iguana Ctenosaura pectinata and related species. Mol. Ecol. 17, 3259-3275. .
Table
1.FST values (below the diagonal) and DXY values (above the diagonal) for the different L. verreauxi lineages. Values in the parentheses represent the number of migrants (Nm) per generation.

 DownLoad:


 Email Alerts
 RSS Feeds