The outbreak of the COVID-19 pandemic has brought massive shifts in human activities through a global blockade, directly affecting wildlife survival. However, the indirect impacts of changes in human activities are often easily overlooked. We conducted surveys of Reeves’s Pheasant (Syrmaticus reevesii) and its sympatric species by camera traps in forest-type nature reserves in three different scenarios: pre-lockdown, lockdown and post-lockdown. An increase in livestock activities observed during the lockdown and post-lockdown period in our study area provided us an opportunity to investigate the indirect impact of the lockdown on wildlife. The pre-lockdown period was used as a baseline to compare any changes in trends of relative abundance index, activity patterns and temporal spacing of targeted species and livestock. During the lockdown period, the relative abundance index of livestock increased by 50% and there was an increase in daytime activity. Reeves's Pheasant showed avoidance responses to almost all sympatric species and livestock in three different periods, and the livestock avoidance level of Reeves's Pheasant during the lockdown period was significantly and positively correlated with the relative abundance index of livestock. Species-specific changes in activity patterns of study species were observed, with reduced daytime activities of Hog Badger and Raccoon Dog during and after the confinement periods. This study highlights the effect of the COVID-19 lockdown on the responses of wildlife by considering the changes in their temporal and spatial use before, during and after lockdown. The knowledge gained on wildlife during reduced human mobility because of the pandemic aids in understanding the effect of human disturbances and developing future conservation strategies in the shared space, to manage both wildlife and livestock.
Almost every country in the world is being or going to be challenged by the pandemic zoonosis identified as Coronavirus disease (commonly known as COVID-19; Manenti et al., 2020). To control the spread of the pandemic, authorities worldwide responded by implementing lockdowns, curfews, travel restrictions and quarantines (Arora et al., 2020; Behera et al., 2022). The COVID-19 pandemic has abruptly halted the Anthropocene’s ever-expanding reign for the time being (Chowdhury et al., 2021). The resulting global human confinement has been dubbed as the Anthropause (Cooke et al., 2021; Corradini et al., 2021). Besides effectively suppressing the virus for the sake of human health, the lockdown revealed another side effect: large-scale shifts in human activities (Kraemer et al., 2020; Muche et al., 2022). Human presence and activities considerably influence the distribution, abundance, and behavior of wildlife (Geldmann et al., 2014; Jones et al., 2018). The large-scale human confinement can be seen as a global experiment in human confinement and provides us an unprecedented opportunity to assess the impact of large-scale changes in human activity on wildlife (Bates et al., 2020; Chowdhury et al., 2021).
Human-driven changes in atmospheric conditions, elemental cycles, and biodiversity have been widely observed (Jiménez-Valverde, 2012; Dormann et al., 2013). Negative impacts of human activities include a much warmer earth state, marked expansion of urbanization, and accelerating species extinctions (Hughes, 2000; Walther et al., 2002). Human activities are a major source of threats to species and ecosystems (Dirzo et al., 2014; Tucker et al., 2018). Based on this perspective, we predict that a global human embargo implemented to mitigate COVID-19 health risks may mitigate human impacts, resulting in a positive environmental response (Rutz et al., 2020; Derryberry et al., 2021). Indeed, early reports have indicated that the restrictions could immediately lead to a reduction in human activities in ocean, land and sky, along with similar declines in industry, commercial exploitation of natural resources and manufacturing (Bar, 2021; Lecchini et al., 2021; Liu et al., 2021). Vessel stoppages have caused dolphin and fish to experience an immediate increase in their communication ranges by approximately 65% in the Hauraki Gulf Marine Park in New Zealand (Pine et al., 2021). Reports have showed that because of the reduction in human activities, 275 species have occupied an unusual area (distribution change), or shifted in number (abundance change; Bates et al., 2021). Due to the restriction of human mobility, air pollution has been reduced by up to 44%, and daily global CO2 emissions have abruptly decreased by 17% in the initial months of the lockdown (Arora et al., 2020; Bates et al., 2020). However, COVID-19 lockdown has also had a negative impact on conservation and wildlife. Because of lockdown, some park officials are unable to perform conservation, restoration and enforcement tasks, leading to an increase in illegal activities such as hunting and logging (Bates et al., 2021). Overall, COVID-19 lockdown has complex positive and negative impacts on nature, which can potentially induce chain reactions that in turn affect wildlife and nature conservation (McGinlay et al., 2020; Neupane, 2020; Smith et al., 2021).
China was one of the first countries to be affected by COVID-19. From late January to early April 2020, Chinese people were locked in their urban gated communities and “re-enforced” in the countryside, first in Wuhan and Hubei Province and then in the entire country (Kupferschmidt and Cohen, 2020; Li, 2021). At that time, China had the longest and strictest embargo in the world (Kraemer et al., 2020). The spread of COVID-19 has been successfully curtailed by massive travel restrictions that rendered more than 900 million people housebound for more than two months since the lockdown of Wuhan, and elsewhere, on 23 January 2020 (Chen and Fu, 2022). Those lockdown policies to prevent further spreading of the COVID-19 epidemic in China included reducing human interaction, strictly restricting industrial activities, restricting private and public transportation, prohibiting private and public gatherings, and such massive travel restrictions have caused a dramatic reduction in travel volume, not only for the outflow from the epicenter Wuhan (Hubei Province) but also nationwide (Sun et al., 2020). Cities and provinces around epicenter Wuhan have also adopted strict lockdown measures (such as Henan Province; Chen and Fu, 2022).
Understanding the effects of disruptions in normal human activities on wildlife requires an investigation of the effects of anthropogenic-related habitat determinants on the distribution and behavior of wildlife, which provides space for understanding the ecological effects of wildlife species distributions. To explore the extent and scale of the impact of lockdown on wildlife, we conducted terrestrial fauna surveys in a forest-type nature reserve under anthropogenic pressure using a camera trapping framework. No illegal activities were observed in the study area, but livestock grazing increased rapidly during the COVID-19 lockdown period compared to the pre-lockdown period and post-lockdown period. Species surveyed by camera traps included Reeves’s Pheasant (Syrmaticus reevesii) and its sympatric species including Raccoon Dog (Nyctereutes procyonoides), Masked Palm Civet (Paguma larvata), Hog Badger (Arctonyx collaris), Reeves’s Muntjac (Muntiacus reevesi), and Wild Boar (Sus scrofa). The six local species were chosen for the study because of their different daily activity patterns (Reeves’s Pheasant diurnal, Raccoon Dog mostly nocturnal, Masked Palm Civet nocturnal, Hog Badger crepuscular, Reeves’s Muntjac cathemeral, Wild Boar cathemeral) and relatively large body size (Gomez et al., 2005; Smith et al., 2010). Wild Boar, Reeves’s Muntjac and livestock may indirectly affect the spatiotemporal distribution of Reeves's Pheasant by changing vegetation (Wang et al., 2016; Zhang et al., 2017). Raccoon Dog, Hog Badger and Masked Palm Civet are potential nest predators of Reeves's Pheasant (Wang et al., 2016). We predict that the pheasant will actively avoid sympatric species and livestock on a spatiotemporal scale. Considering that livestock are primarily active during daylight hours (Pudyatmoko, 2017; Di Bitetti et al., 2020), we predict that diurnal wildlife will change their activity patterns, and livestock presence may alter the avoidance level of Reeves's Pheasant in response to sympatric species.
2.
Methods
2.1
Study area
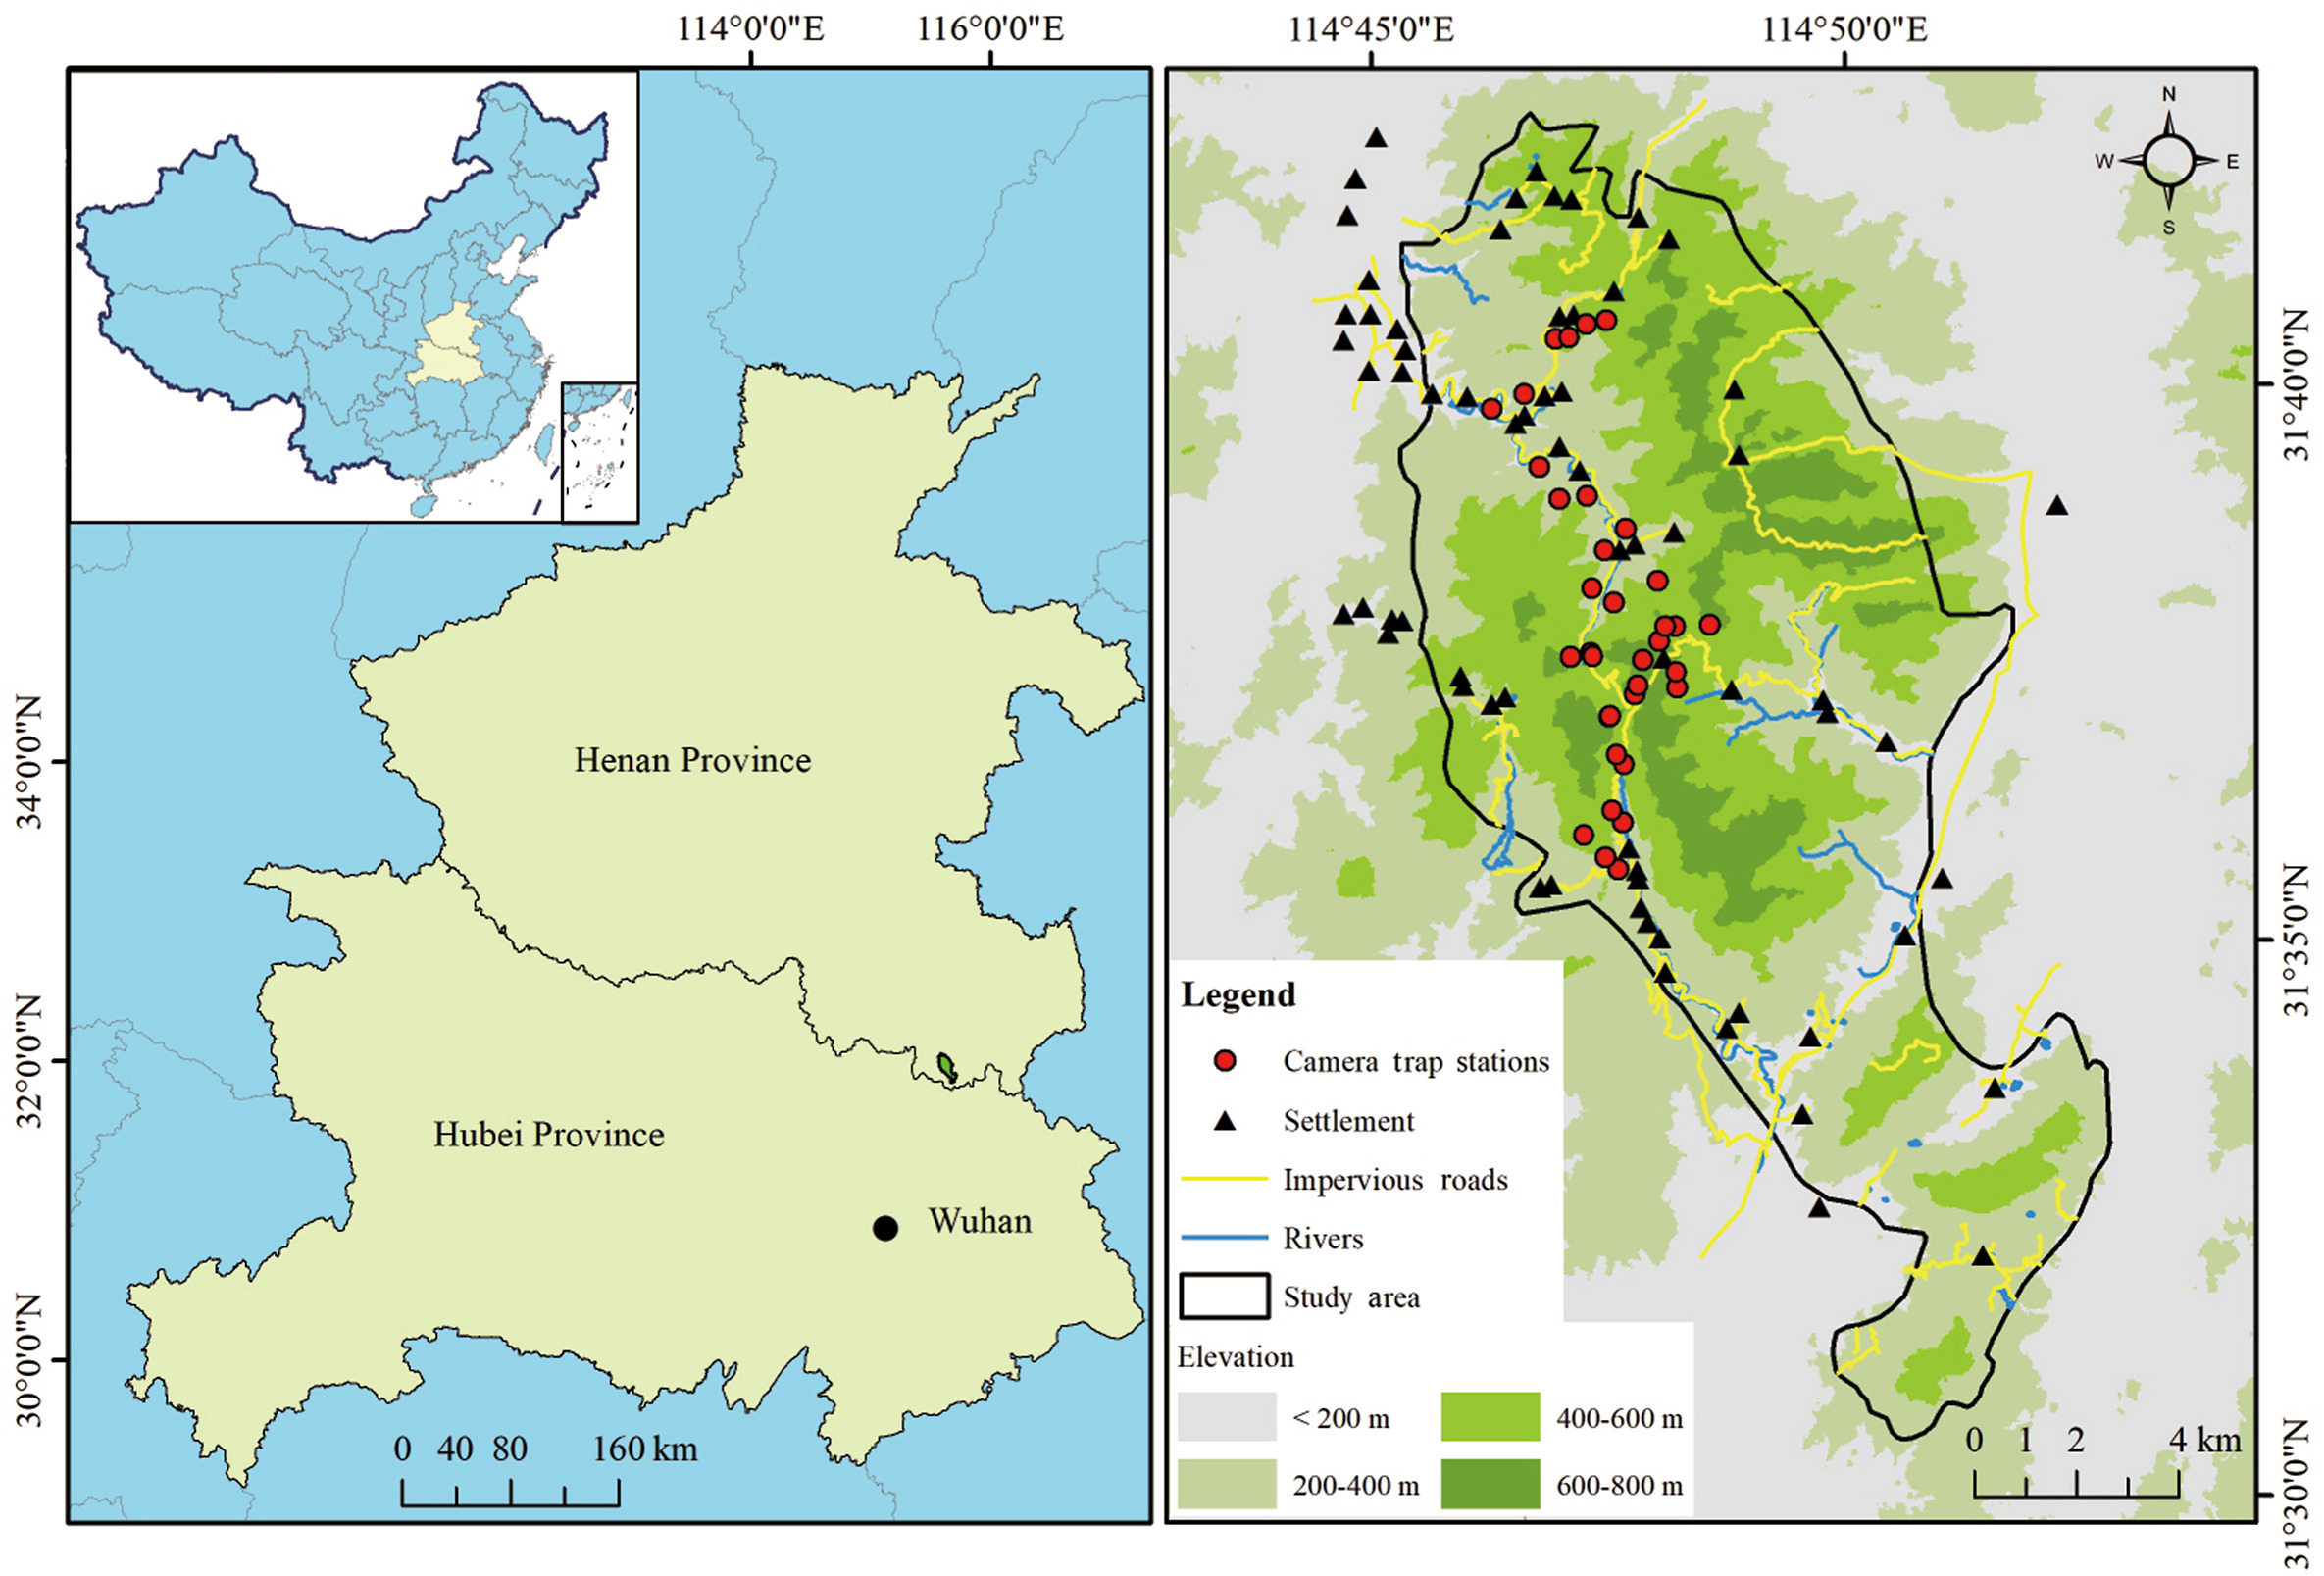
The Liankangshan National Nature Reserve (114°45′–114°52′ E, 31°30′–31°42′ N, hereafter ‘LKS’) is located in Xin County, Henan Province, with an area of 105.80 km2. This reserve is at a distance of about 120 km from Wuhan City, Hubei Province (Fig. 1). We have conducted wildlife surveys here since early 2019 using camera trapping. The general elevation of the study area is between 100 m and 700 m a.s.l. LKS contains broadleaved forests and coniferous mixed forests. LKS has a northern subtropical monsoon climate, receiving an average annual precipitation of 1280.5 mm, mostly during the summer months. Air temperature varies between −10.0 ℃ and 36.3 ℃ (China Meteorological Administration, 2020). The study area is protected, and hunting, mining and illegal collection of forest resources are strictly prohibited. Indigenous people in the study area continue to graze and collect in the nature reserve to sustain their livelihoods. With respect to livestock, residents raise cattle and goats for meat. To our knowledge, cattle and goats have unrestricted access to the reserve, with herders visiting their herds and flocks from time to time, and cattle and goats returning to their cages from time to time for salt replenishment. China went into complete lockdown in 2020 and local herders’ interactions with livestock were interrupted, which may be the main reason for more frequent livestock movements in wildlife habitats.
Figure
1.
Camera trap stations in the Liankangshan National Nature Reserve, inset showing the locations of the study areas in China.
We deployed camera traps (Ltl Acorn 6310 WMC, Zhuhai, China) at 35 stations in LKS from July 2019 to July 2021 (Fig. 1). Our study was part of a population monitoring project on Reeves’s Pheasant, and infrared cameras were deployed according to the home range of this pheasant. The distance between any two camera traps was greater than 0.4 km (Xu et al., 2009). The camera traps were placed at a height of 30 cm, and latitude and longitude coordinates, vegetation, and altitude of each camera trap station were recorded. Cameras were set to operate 24 h per day, and they were programmed to take up to 3 photos once triggered, followed by a 10-s video, with a 30-s interval to trigger the next photograph. Batteries and memory cards were replaced every three months. Due to COVID-19 lockdown, we did not conduct the field work as planned, but received approval to enter the study area. Location (No. of camera), date and time were recorded for each photo and video taken by camera traps. We identified and recorded each captured entity as animal species, human, or livestock. Image records were screened to identify ‘independent photograph’ according to a standard temporal separation criterion of more than 0.5 h between consecutive images of the same species to avoid repeated counting of a single individual during a transitory stay close to the camera trap (O'Brien et al., 2003; Sollmann, 2018). We considered three sampling periods: “pre-lockdown”, “lockdown” and “post-lockdown” as explained earlier. Lockdown referred to the time of the strictest lockdown, from February to April 2020, pre-lockdown was the same time period in 2019 and post-lockdown was the same time period in 2021. Accordingly, independent photographs were segregated for further analyses.
To determine the functional relationship between habitat features and wildlife occupancy, we measured several anthropogenic and habitat covariates that could potentially affect wildlife activity, including vegetation type, elevation, distance from the nearest river, distance from the nearest road, distance from the nearest settlement, distance from the nearest cultivated land, livestock relative abundacne index, and human relative abundance index.
2.2.2
Habitat use and detection probability
Each camera trap station and sampling occasion was considered as an independent station and a temporal repeat of the survey, respectively. In our analysis, individual species habitat use was assumed to be independent of other species. We assigned 1, 0 or NA to each observation, where 1 indicated one or multiple events within the particular 3-days period, 0 indicated no detections, and NA indicated malfunction of the camera trap. We surveyed six species for three months during the pre-lockdown, lockdown and post-lockdown periods. We developed detection history matrixes for six species in rows consisting of camera numbers and columns consisting of 30 sampling occasions. The occupancy modelling framework allowed us to estimate the probability of a species occurring at a sampled station, while exploring hypotheses about relevant habitat characteristics that influence species occurrence. It has also been developed to account for imperfect detection (Royle and Link, 2006). Single-season occupancy model was used to estimate site occupancy (ψ) and detection probability (p) of the study species. We used the program R (R Core Team, 2021) using package “unmarked” (Fiske and Chandler, 2011) to model site occupancy and detection probability with its covariates as a measure of six species activities. All the continuous site covariates were standardized to Z scores prior to modelling. We treated the term "occupancy" as habitat use because the home range of study species was larger than the size of the sampling grid used, and because multiple sampling units could be used by the same individual in a short period of time. Therefore, we inferred the result as the station of use of each sampling unit (i.e., habitat use) rather than the area occupied (occupancy). Camera trap data were used to determine species’ occupancy as a function of the various variables associated with human disturbance predicted to influence its probability of occupancy (habitat use) and detection in the study area during the pre-lockdown, lockdown and post-lockdown periods. We followed stepwise model selection procedures and the goodness of fit for model selection as described in Wagenmakers (2003). Models with the lowest AIC values (ΔAIC ≤ 2) were considered as best descriptors of species habitat use and detection probability among candidate models (Wagenmakers, 2003).
2.2.3
Activity pattern overlap
We used kernel density estimates to analyze temporal overlap patterns of species activity in different scenarios and calculate overlap coefficients (Ridout and Linkie, 2009). We conducted temporal overlap analysis in Program R using package overlap (Meredith and Ridout, 2021). p-values for estimated coefficients were derived using an approximation of the Wald statistic, defined as the coefficient estimate divided by its standard error (Cusack et al., 2017). For all statistical tests, p < 0.05 was considered significant.
2.2.4
Temporal spacing of detections at shared camera station
For each camera trap station where at least two occurrences of the same species were observed, we determined the number of days between a species’ detection (hereinafter, reference detection) and its closest detection (hereinafter, proximal detection). For each species (Reeves’s Pheasant, Raccoon Dog, Masked Palm Civet, Hog Badger, Reeves’s Muntjac or Wild Boar), the number of days between reference detection and proximal detection was divided into two categories based on the presence or absence of livestock. We compared the average temporal spacing of detections of six species detection during the pre-lockdown, lockdown and post-lockdown periods using two-tailed unpaired two-sample Wilcoxon tests.
2.2.5
Spatio-temporal avoidance
We used camera trap data from three sampling periods on Reeves's Pheasant and sympatric species with large enough sample sizes (n > 10) across the 195 arrays to test the relative attraction and/or avoidance of a camera trap station by sympatric species or livestock after a visitation by Reeves's Pheasant, and the relative attraction and/or avoidance of a camera trap station by Reeves's Pheasant after previous visitation by sympatric species or livestock (Parsons et al., 2016). This approach estimates spatio-temporal avoidance, or the extent to which sites visited by one species are influenced by visits of another (Niedballa et al., 2019). We used time series of detections from a given camera to test the relative avoidance or attraction of a site by Reeves's Pheasant after a visit of sympatric species or livestock. T1 is the time interval between Reeves's Pheasant detections and sympatric species or livestock detections, and T2 is the time interval between sympatric species or livestock detections and Reeves's Pheasant detections. T3 is the average time interval between Reeves's Pheasant detections without sympatric species and livestock, while T4 is the same measure with sympatric species or/and livestock between. We call these measures Avoidance-Attraction Ratios (AAR), and they can be created either by comparing the time interval after/before sympatric species or livestock pass by (T2/T1) or with/without the visit of sympatric species or livestock (T4/T3). The T2/T1 ratio measures the net effects of both attraction and avoidance between Reeves's Pheasant and sympatric species or livestock, where a log-transformed value >1 can indicate either avoidance or attraction of Reeves's Pheasant by sympatric species or livestock. A high T4/T3 indicates avoidance by Reeves's Pheasant, while a low value (log-transformed < 1) indicates the attraction or no relationship. Thus, the two ratios can be used to discern the direction and nature of potential species interactions. Following AAR calculations, we performed two analyses using log-transformed ratios: (1) We used T4/T3 ratios to run two-tailed t-tests to determine whether Reeves's Pheasant avoided or were attracted to a site after visit from another species, and vice versa. A mean ratio greater than zero indicates species avoidance, whereas a mean less than 0 indicates species attraction (Parsons et al., 2016). (2) Using General Linear Mixed Models (GLMMs), we investigated whether several human disturbance and habitat covariates altered how Reeves's Pheasant responded to sympatric species and livestock based on the T2/T1 ratios.
3.
Results
3.1
Relative abundance index
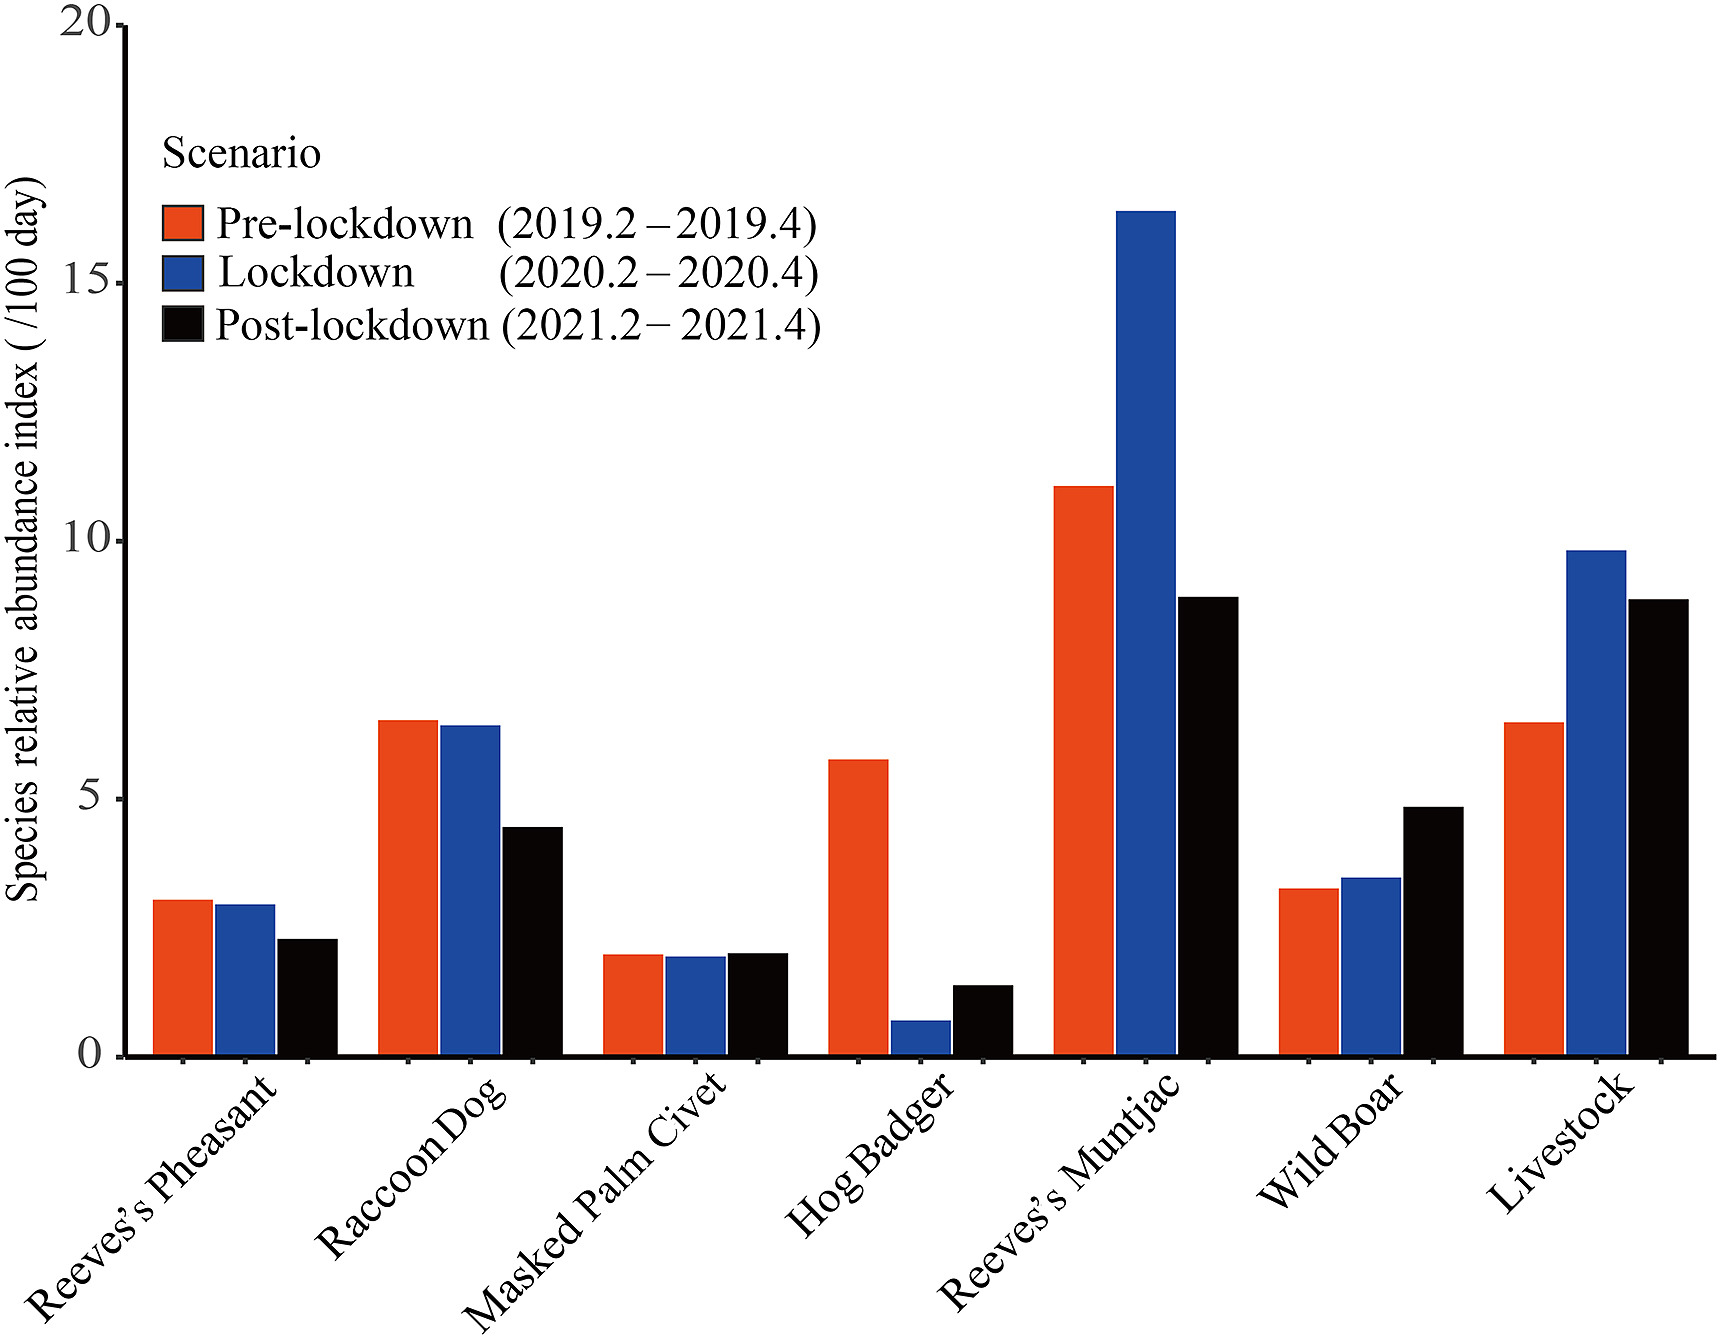
The results showed that there was a rapid increase in livestock grazing due to lockdown during field data collection. The relative abundance index of livestock increased by 51.31% year on year during lockdown compared to the pre-lockdown period (Fig. 2). Although the relative abundance index of livestock decreased during the post-lockdown period, it was higher than that during the pre-lockdown period. The relative abundance index of Reeves’s Pheasant and Raccoon Dog decreased. The relative abundance index of Masked Palm Civet remained almost unchanged. The relative abundance index of Hog Badger declined sharply during and after lockdown. It dropped abruptly to 0.71 during the lockdown, which was equivalent to one-eighth of the value before lockdown and was the lowest among the six wildlife species. The relative abundance index of Reeves’s Muntjac reached the highest value of 16.40 during the closure period. However, it was almost halved during the post-lockdown period and was lower than that during the pre-lockdown period. In contrast, Wild Boar did not appear to be affected by increased livestock grazing, and its relative abundance index continuously increased.
Figure
2.
Relative abundance indices of six wildlife species and livestock in the Liankangshan National Nature Reserve during the pre-lockdown, lockdown and post-lockdown periods. The relative abundance index ranges from 0.71 to 16.40. Species are arranged in order of body size from small to large.
Contrary to expectations, the naïve occupancy of the other four relatively small-bodied species decreased to varying degrees during the lockdown and post-lockdown periods. The naïve occupancy of Wild Boar was 0.59, 0.65 and 0.91 during the pre-lockdown, lockdown and post-lockdown periods, respectively. Similarly, we observed a gradual increase in the naïve occupancy of Reeves’s Muntjacs (0.81, 0.89 and 0.91). Detection probability of Wild Boar and Reeves’s Pheasant continuously increased during the survey, while that of Hog Badger continuously decreased. Trends in detection probability of Reeves’s Muntjac, Raccoon Dog and Masked Palm Civet were consistent with trends in livestock relative abundance indices (Table 1).
Table
1.
Naïve occupancy probability and detection probability of six species in three scenarios, from camera traps observation data.
Model averages showed that the detection rate of Reeves’s Pheasant was positively correlated with the relative abundance of livestock during the pre-lockdown period (βEstimates = 0.33, p < 0.001), but it showed an opposite trend during the post-lockdown period (βEstimates = −1.37, p < 0.001), and Reeves’s Pheasants preferred to move around in areas close to settlements (βEstimates = −0.61, p < 0.05). During the pre-lockdown period, Raccoon Dog was more likely to be photographed close to water sources and camera points with high livestock activity. Detection probability of raccoons was not related to livestock during the lockdown and post-lockdown period. Masked Palm Civet detection probability was positively correlated with the relative abundance index of livestock and negatively correlated with the relative abundance index of people in the pre-lockdown period. During the post-lockdown period, Raccoon detection probability was only related to the relative abundance index of people. Hog Badger detection probability was negatively correlated with elevation and livestock relative abundance index during the pre-lockdown and lockdown periods, and was significantly positively correlated with distance from the nearest settlement during the post-lockdown period. Distance from the nearest settlement was an important factor for the detection probability of Reeves’s Muntjac during the pre-lockdown (βEstimates = −0.40, p < 0.001) and lockdown periods (βEstimates = −0.51, p < 0.001), while livestock activity significantly reduced the detection probability of Reeves’s Muntjacs during the post-lockdown period. Wild Boar tended to move in areas far from water sources during lockdown (βEstimates = 0.63, p < 0.001), and elevation may be an important factor for Wild Boar detection probability during the post-lockdown period (βEstimates = 0.38, p < 0.01). The model average results did not report covariates that significantly affected wildlife occupancy probability (Table 2).
Table
2.
Log-transformed parameter estimates of explanatory variables from the model average during the pre-lockdown, lockdown and post-lockdown periods.
Species
Scenario
Occupancy
Detection
Covariates
βEstimates
SE
Covariates
βEstimates
SE
Reeves’s Pheasant
Pre-lockdown
DNR
2.95
1.82
DNR
0.16
0.15
Ele
−0.82
0.87
DNW
−0.17
0.17
LRAI
0.33***
0.12
Lockdown
NA
NA
NA
NA
NA
NA
Post-Lockdown
Ele
−2.64
2.56
DNS
−0.61*
0.33
PRAI
−2.22
4.42
Ele
1.95
0.58
PRAI
−1.37***
0.30
Raccoon Dog
Pre-lockdown
DNS
2.79
2.43
DNW
−0.64***
0.18
PRAI
−44.83
57.60
LRAI
0.54***
0.16
Vegetation
−44.83
57.60
Lockdown
LRAI
−0.36
0.49
DNR
0.21*
0.10
Vegetation
−1.52
0.98
DNS
−0.33*
0.13
Vegetation
−0.21
0.10
Post-lockdown
DNR
−1.01
0.57
DNR
0.87***
0.21
Vegetation
0.14
1.10
LRAI
−0.22
0.19
Vegetation
−1.21***
0.41
Masked Palm Civet
Pre-lockdown
DNS
93.28
92.34
Ele
0.03
0.22
DNW
−48.93
49.47
LRAI
1.26***
0.28
PRAI
−4.64**
1.56
Lockdown
NA
NA
NA
NA
NA
NA
Post-lockdown
PRAI
8.73
43.97
LRAI
0.07
0.26
Vegetation
0.35
0.35
PRAI
−3.29*
1.60
Vegetation
−1.54*
0.68
Hog Badger
Pre-lockdown
Ele
−0.17
0.49
Ele
−0.51*
0.21
LRAI
0.36
0.49
LRAI
−0.15*
0.09
PRAI
4.65
3.86
Lockdown
Ele
2.13
1.43
Ele
−1.83**
0.61
PRAI
−0.88
2.93
LRAI
−0.82
0.87
Vegetation
0.42
0.88
Post-lockdown
DNW
0.71
0.74
DNR
−0.36
0.42
PRAI
0.76
0.87
DNS
0.98**
0.34
Reeves’s Muntjac
Pre-lockdown
DNS
1.30
1.72
DNS
0.40***
0.11
Ele
2.20
1.29
LRAI
0.16*
0.08
LRAI
−0.17
0.72
PRAI
0.11
0.08
Lockdown
DNW
10.22
13.77
DNS
−0.51***
0.10
Ele
6.49
7.99
PRAI
0.06
0.08
Vegetation
12.38
63.91
Vegetation
0.26
0.18
Post-lockdown
DNR
−12.89
16.30
DNR
0.17
0.13
LRAI
13.63
18.43
Ele
0.09
0.12
LRAI
−0.15*
0.09
Wild Boar
Pre-lockdown
DNS
0.09
0.41
DNR
0.004
0.06
DNW
9.85
5.22
DNS
−0.15
0.19
LRAI
−2.84
1.72
DNW
0.008
0.07
Lockdown
DNS
−0.19
0.67
DNS
−0.47
0.23
LRAI
0.66
0.88
DNW
0.63***
0.16
PRAI
1.39
3.30
Vegetation
1.04***
0.31
Post-lockdown
Ele
−4.48
5.63
DNR
0.08
0.15
LRAI
−1.87
11.42
Ele
0.38**
0.16
DNR = distance from the nearest road, DNS = distance from the nearest settlement, DNW = distance from the nearest water, Ele = elevation, LRAI = livestock relative abundance index, PRAI = people relative abundance index. Significance codes: p < 0.001***, p < 0.01**,p < 0.05*.
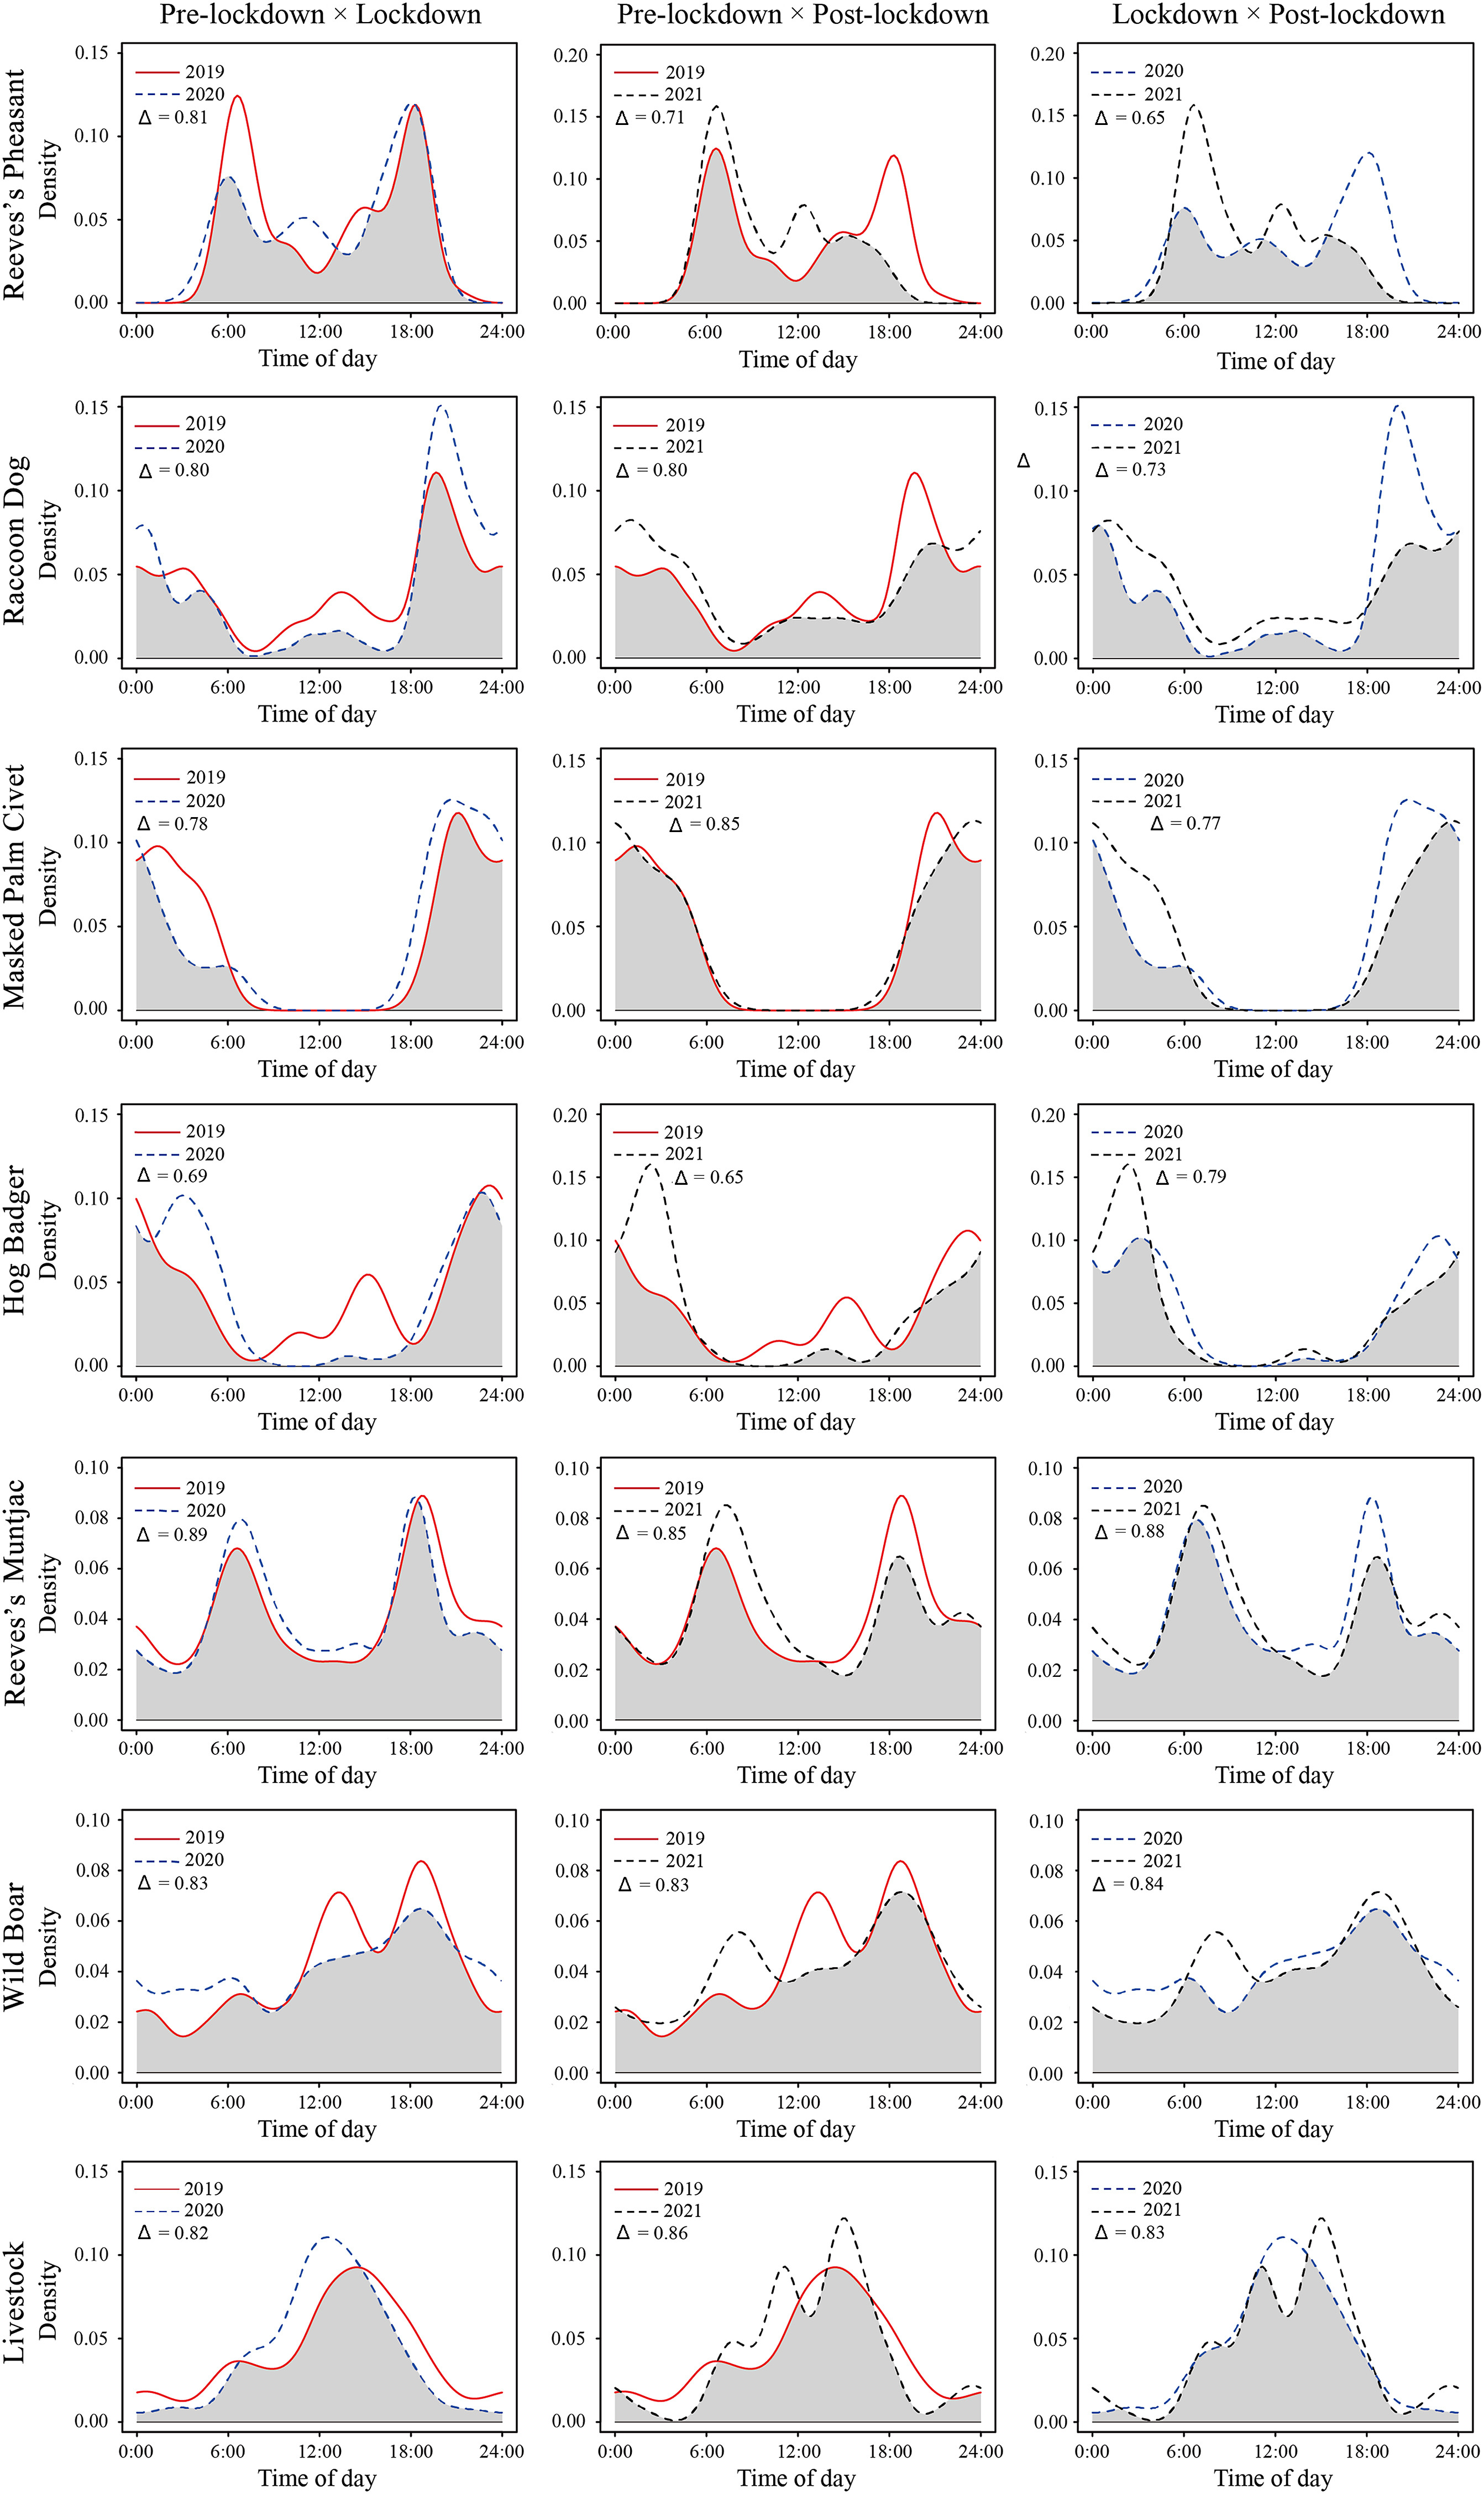
Reeves’s Pheasant is a large ground-dwelling bird that is active mainly at dawn and dusk. However, it tended to be active at dawn during the lockdown period and at dusk during the post-lockdown period, respectively, and there were significant differences in its daily activity patterns between the two phases (p < 0.01). It is important to emphasize that Raccoon Dog and Hog Badger are mainly nocturnal, and during the pre-lockdown period Raccoon Dog and Hog Badger spent about 26.47% and 24.52% of their time in the daytime, respectively. However, during the lockdown and post-lockdown periods, they were hardly active during the daytime hours. The activity pattern of Raccoon Dog also changed significantly over three years (pre-lockdown × lockdown p < 0.008, pre-lockdown × post-lockdown p > 0.15, lockdown × post-lockdown p < 0.001). As expected, Masked Palm Civet was almost exclusively nocturnal, and its activity pattern did not change over three years. Reeves’s Muntjac is an herbivore and its activity peaks occurred at dawn (6:00) and dusk (18:00) with no difference in activity patterns among three years. The activity pattern of Wild Boars was cathemeral and did not differ significantly at different times. Livestock temporal activity differed somewhat with respect to year (pre-lockdown × lockdown p < 0.003, pre-lockdown × post-lockdown p < 0.006, lockdown × post-lockdown p < 0.02), and nearly 80% of their temporal activity occurred during daytime hours. Livestock temporal activity peaked at 15:00 during the pre-lockdown period, and peaked at 13:00 during the lockdown period (Fig. 3). The difference was that during the post-lockdown period, livestock activity was in a twin-peak mode.
Figure
3.
Activity patterns of livestock and six wild species during the pre-lockdown (red solid line), lockdown (blue dashed line) and post-lockdown (black dashed line) periods in the Liankangshan National Nature Reserve. The estimate of temporal overlap, Δ [from 0 (no overlap) to 1 (complete overlap)], is indicated by the grey area, and is shown in each panel. Average time of sunrise was 6:00 and average time of sunset was 18:00 during the study. (For interpretation of the references to colour in this figure legend, the reader is referred to the Web version of this article.)
3.4
Temporal spacing of livestock and wildlife detections at shared camera sites
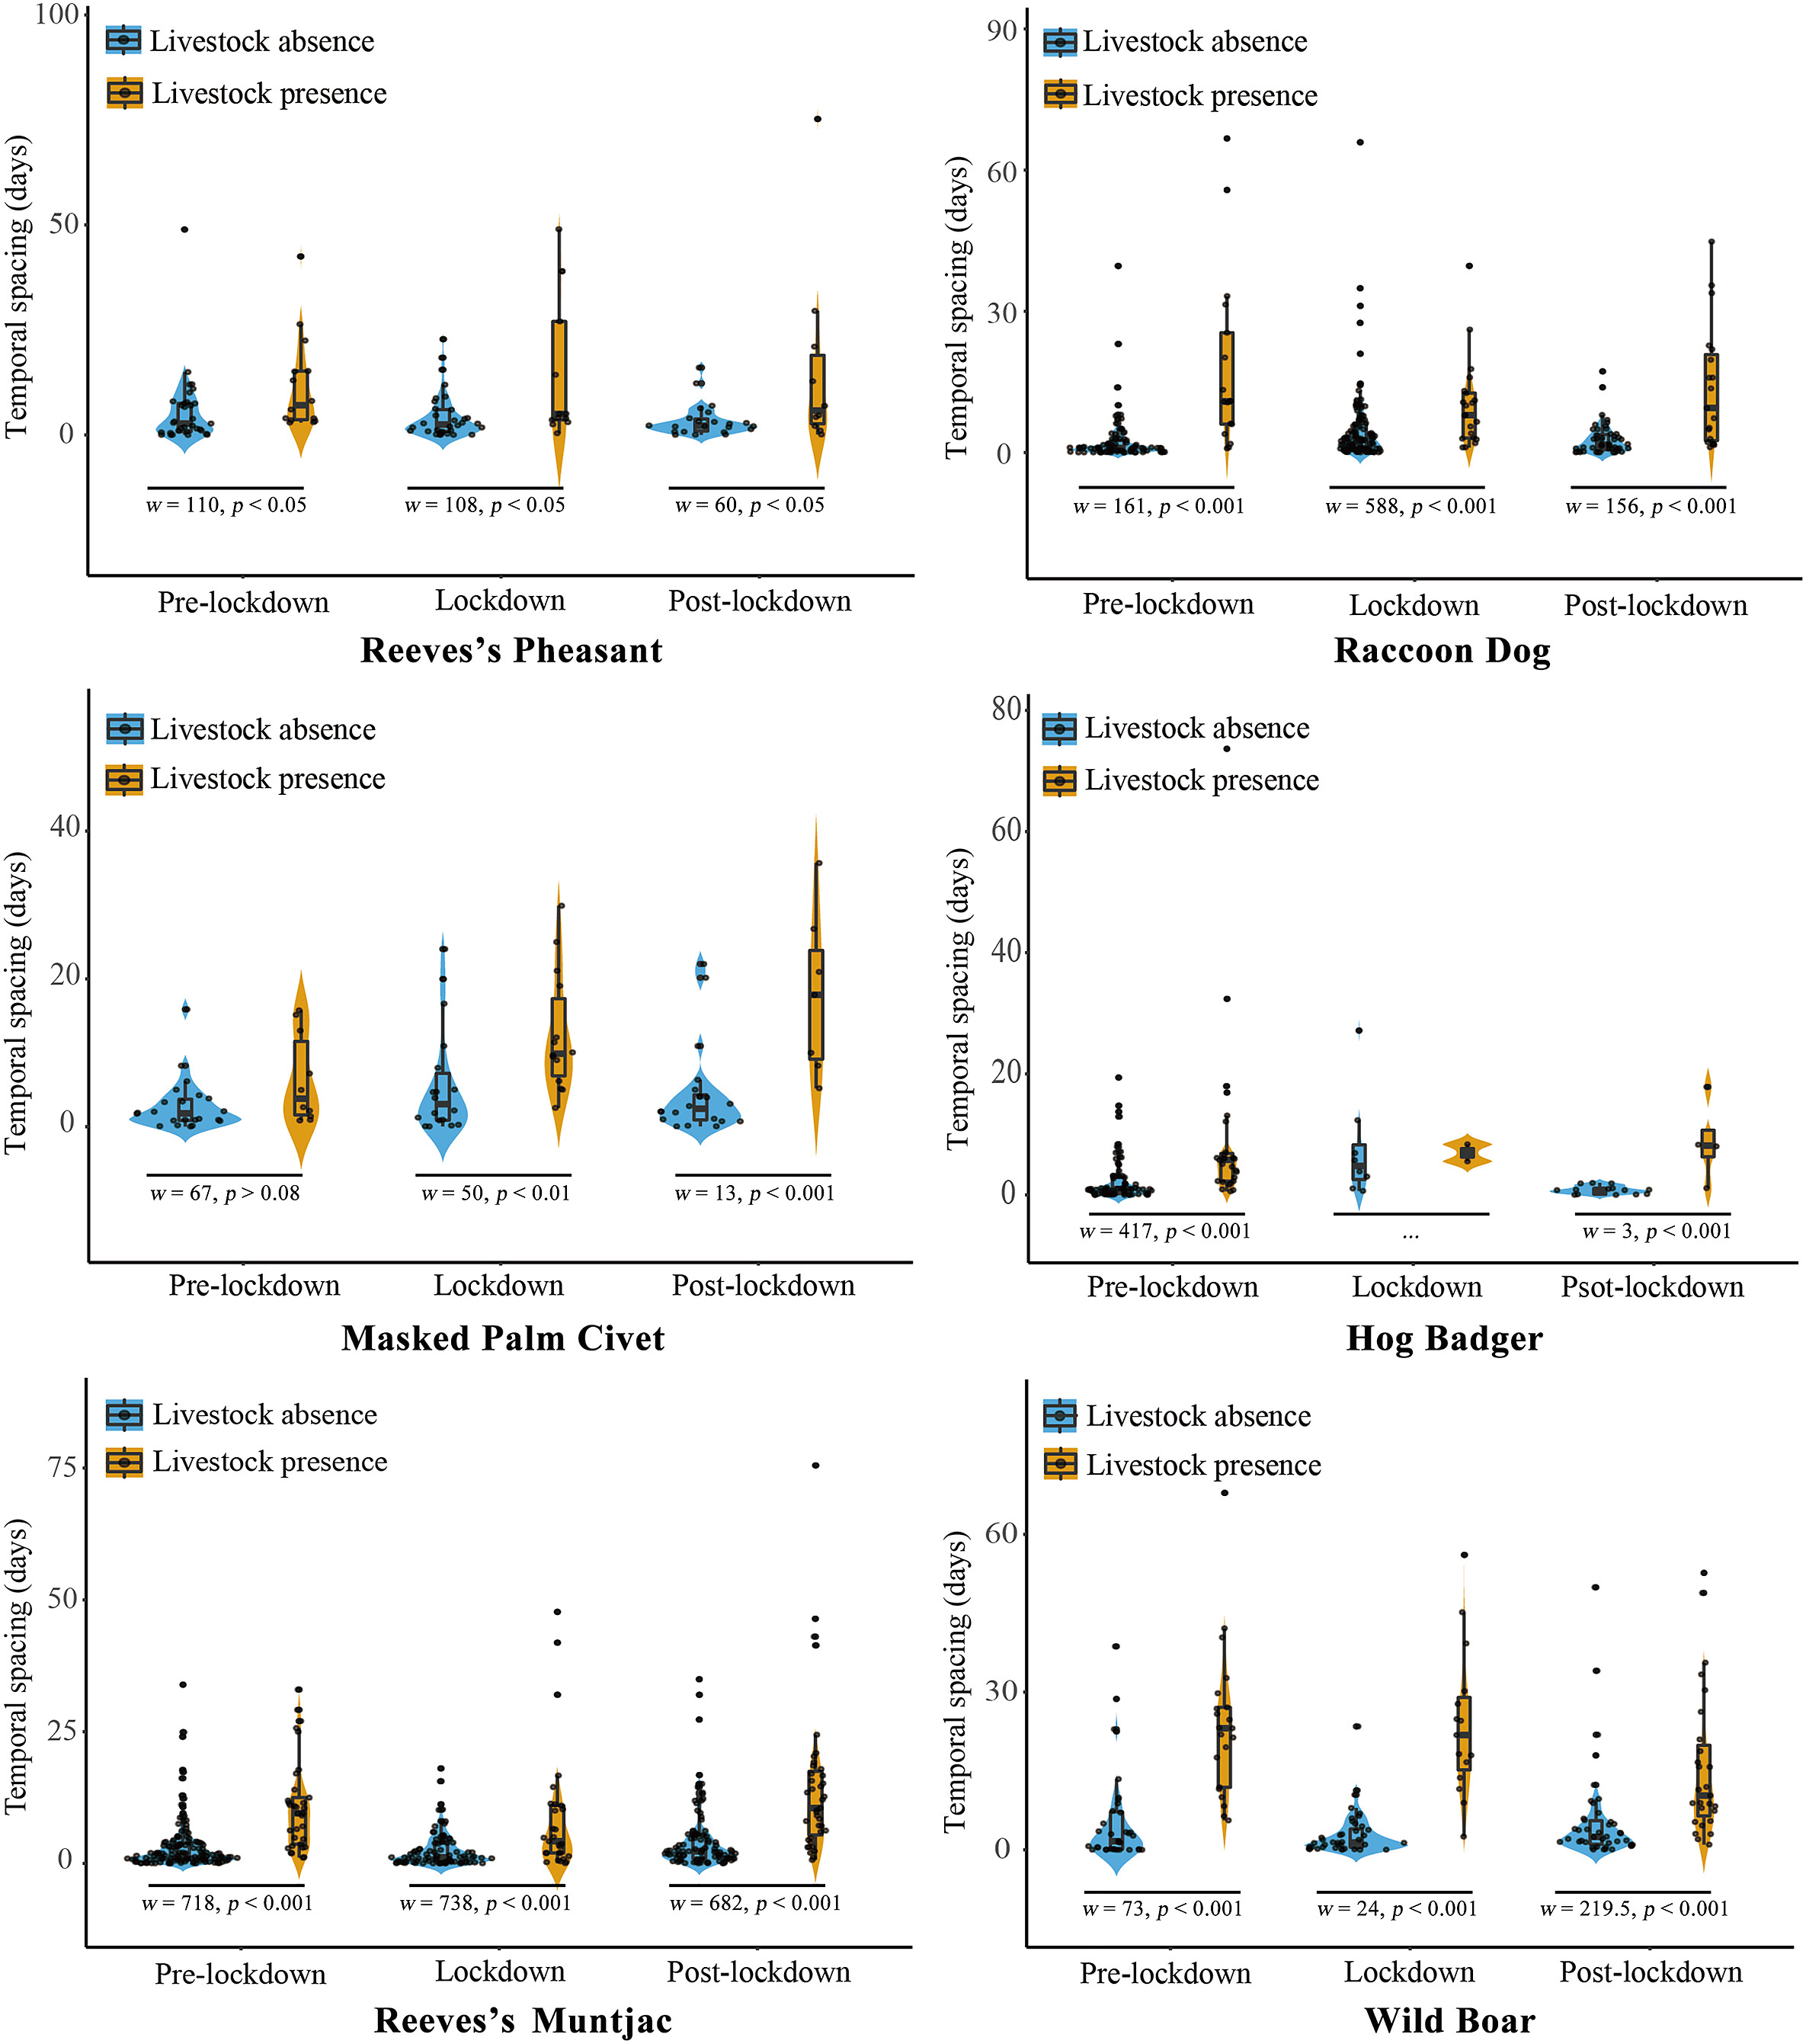
We found that livestock grazing increased substantially during the lockdown period, and temporal spacing at the same camera trap station did not change significantly compared to the pre-lockdown period (Fig. 4). We observed highly significant differences in the temporal spacing of Reeves’s Pheasant and Raccoon Dog between the cases of livestock presence and absence during the study period, but this difference became smaller during the lockdown and post-lockdown periods, in contrast to Reeves’s Pheasants (Fig. 4). During the pre-lockdown period, the activity interval of Hog Badger was significantly larger in the presence of livestock than in its absence. During the study period, there was a highly significant difference in the temporal spacing of Reeves’s Muntjac between the cases of livestock presence and absence at the same camera trap station (all p-values <0.001). This difference was relatively small during the lockdown period and relatively large during the post-lockdown period (Fig. 4). The temporal spacing during the post-lockdown period was significantly larger than that during two previous periods (pre-lockdown × lockdown: w = 13,570, p > 0.45, pre-lockdown × post-lockdown: w = 8888.5, p < 0.009 and lockdown × post-lockdown: w = 11,789, p < 0.04). Whenever livestock were present Wild Boars were almost never continuously photographed by the same camera trap (all p-values <0.001), but during the post-lockdown period the temporal spacing of Wild Boar tended to decrease at the camera trap station where livestock were present (Fig. 4).
Figure
4.
Violin diagrams showing the temporal spacing of wildlife detections at shared camera stations where livestock were present (yellow) or absent (blue) during the pre-lockdown, lockdown and post-lockdown periods. (For interpretation of the references to colour in this figure legend, the reader is referred to the Web version of this article.)
We did not estimate the temporal spacing of Hog Badger during the lockdown and post-lockdown periods, as sample sizes during both periods were too small to construct reliable temporal spacing distributions (Fig. 4). As with other species of wildlife, the temporal spacing of Masked Palm Civet detections at shared camera sites increased during the lockdown and post-lockdown periods when livestock were present, but it should be emphasized that the presence or absence of livestock did not affect the temporal spacing of Masked Palm Civet during the pre-lockdown period (Fig. 4).
3.5
Spatiotemporal avoidance
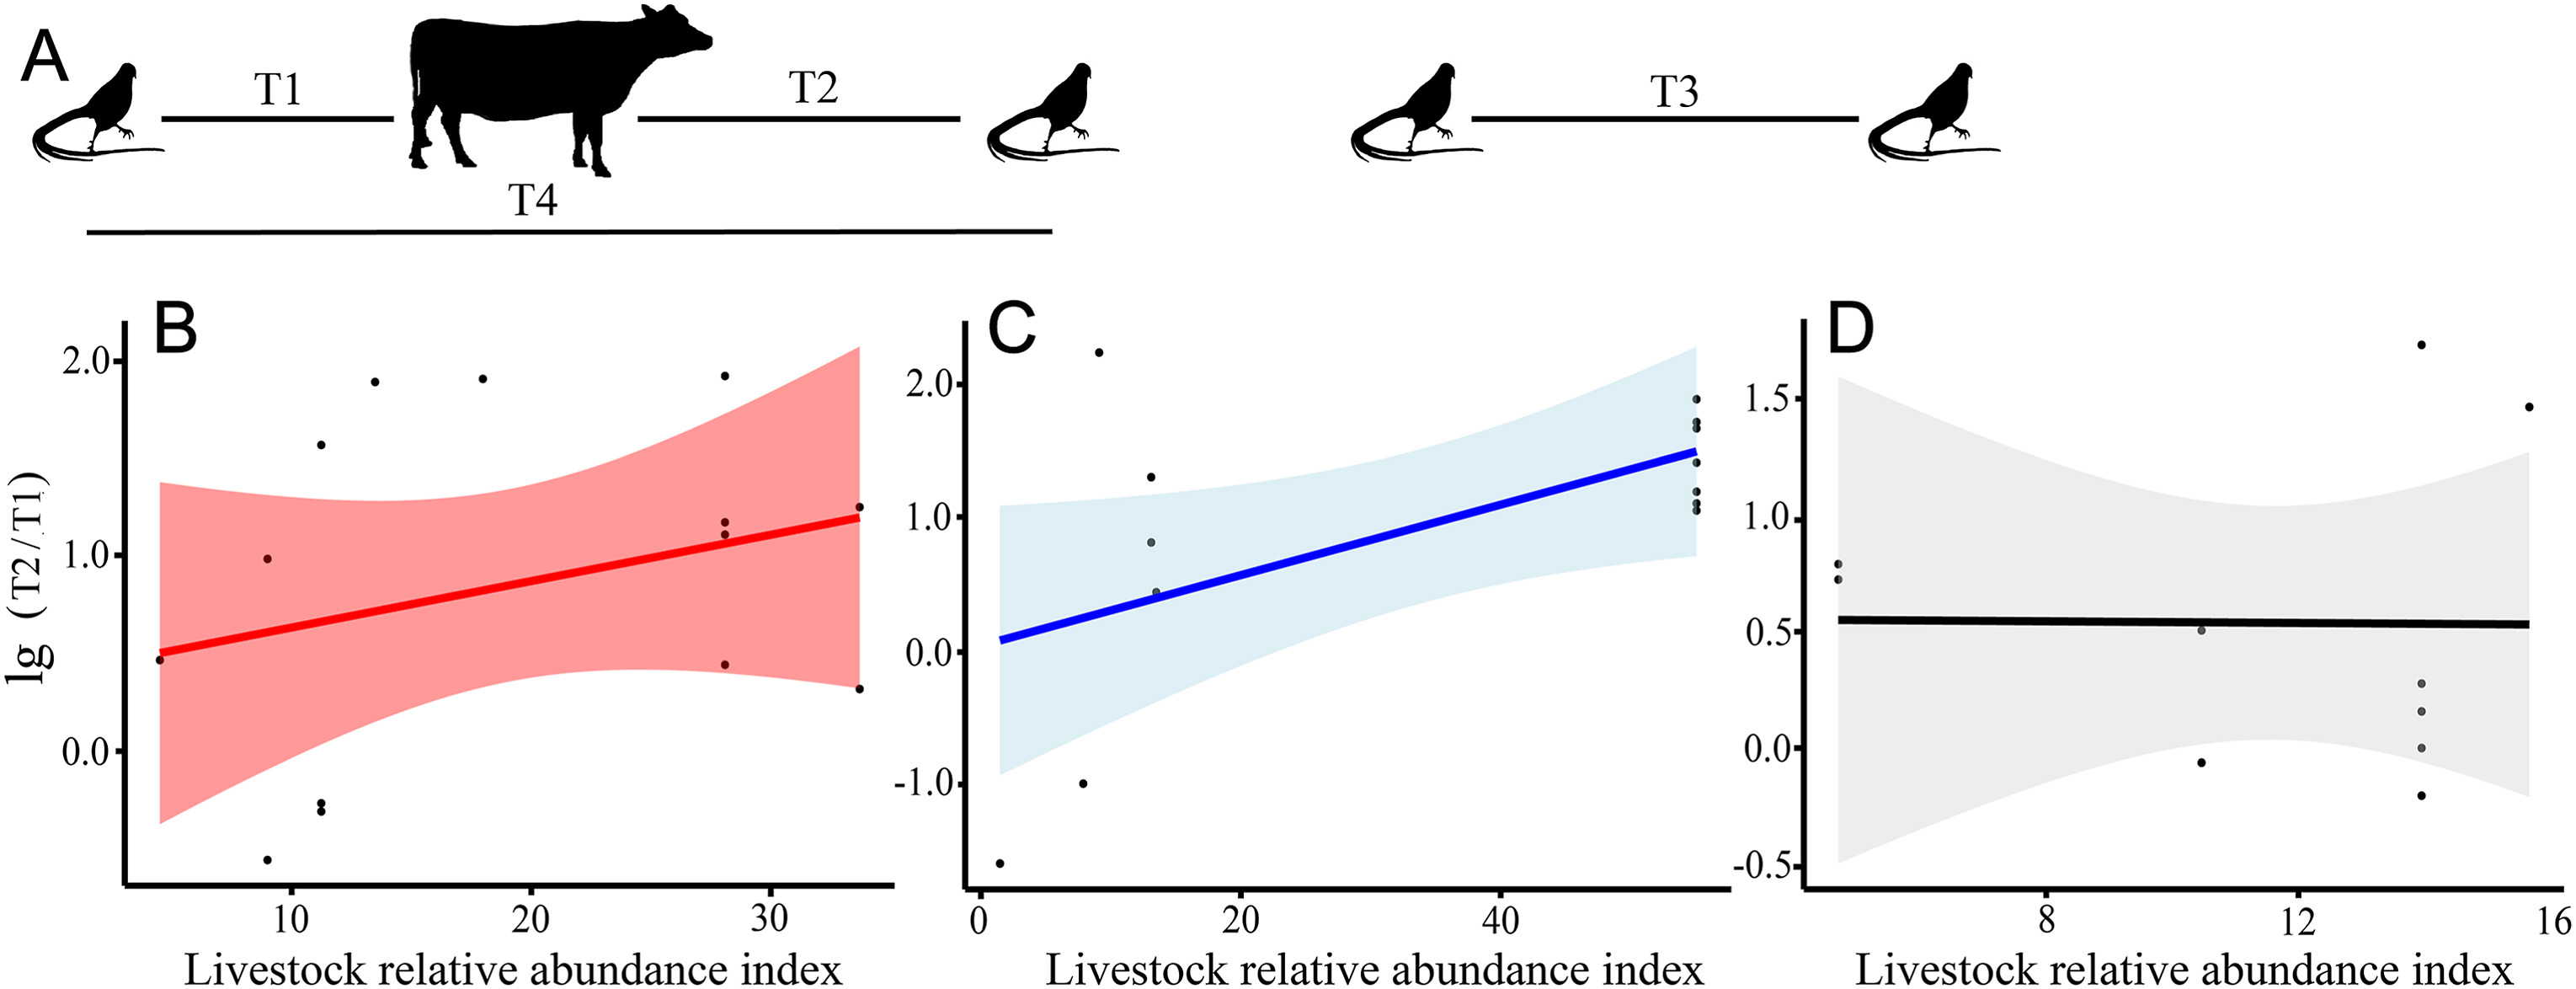
Due to sample size limitations, the AARs analysis did not consider Masked Palm Civet, Hog Badger during the lockdown and post-lockdown periods and Raccoon Dog during the post-lockdown period when performing t-tests. Except for Wild Boar in the post-lockdown period, Reeves's Pheasant showed marked avoidance responses to other sympatric species and livestock (Table 3). Results of the general linear model analysis showed that anthropogenic and habitat covariates did not change the avoidance response of Reeves's Pheasant to sympatric species, but the livestock avoidance level of Reeves's Pheasant was highly significantly and positively correlated with livestock relative abundance index during the lockdown period (F = 8.58, p < 0.01), while the effect of livestock was not significant in the pre-lockdown (F = 0.98, p > 0.35) and post-lockdown periods (F = 1.42, p > 0.28) (Fig. 5).
Table
3.
Comparison of spatiotemporal avoidance responses of Reeves's Pheasant to sympatric species and livestock in 195 arrays. NA indicates a small sample size and is not included in the analysis.
Figure
5.
Effects of livestock relative abundance index on avoidance responses of Reeves's Pheasant to livestock. (A) Array of Reeves's Pheasant with livestock (Parsons et al., 2016). Black silhouettes with long tails refer to Reeves's Pheasant, and another to livestock. (B–D) Relationship between livestock relative abundance and lg(T2/T1) ratio for avoidance responses of Reeves's Pheasant to livestock. Red indicates pre-lockdown period (B), blue indicates lockdown period (C) and black indicates post-lockdown period (D). Bands represent 95% confidence intervals. (For interpretation of the references to colour in this figure legend, the reader is referred to the Web version of this article.)
To contain the spread of COVID-19, nearly two-thirds of the global population is simultaneously under unprecedented confinement (Bates et al., 2020). Initially, the great global embargo is perceived to bring beneficial consequences to the environment as there is a reduction in greenhouse gas emission and air and water pollution (Arora et al., 2020; Liu et al., 2021; Muche et al., 2022). On the other hand, wildlife occupies an unusual area (change in distribution) or moves in numbers (change in abundance) due to a decrease in human activity (Paital, 2020; Rutz et al., 2020; Bates et al., 2021). Social media worldwide have suggested this as an indication that wild animals are exploiting the new favorable environment (Zellmer et al., 2020; Derryberry et al., 2021). Concurrently, a reduction in law enforcement and human presence has potentially exposed wild animals to increased risks of poaching (Koju et al., 2021; Behera et al., 2022). Additional studies have reported potential negative ecological consequences of human absence, particularly in coastal ecosystems and tourist areas (Hentati-Sundberg et al., 2021; Loh et al., 2021). The environmental impact of changes in the activity patterns of domesticated animals as a result of embargo cannot be ignored either (Vimal, 2022). Thus, lockdown has complex positive and negative effects on the natural environment. Our study aimed to reveal the indirect negative effects of COVID-19 lockdown on wildlife and confirm previous studies on the negative effects of COVID-19 lockdown on wildlife (Manenti et al., 2020; Rutz et al., 2020; Budiman and Kusumaratna, 2021). We found species-specific changes in the activity and relative abundance index of study species, as well as decreased diurnal activities of study species during the lockdown and post-lockdown periods. The relative abundance index of Hog Badger declined sharply after the lockdown began. Hog Badger and Raccoon Dog shifted their activity patterns from an all-day pattern to an almost exclusively nocturnal pattern, and the livestock avoidance level of Reeves's Pheasant was significantly positively correlated with the relative abundance of livestock, probably because lockdown reduced human-livestock interactions. The results of this study will provide a better understanding of the complexity of the effect of COVID-19 lockdown on wildlife behaviors that would help in wildlife conservation planning to improve human-wildlife coexistence.
In this study, livestock may have the most detrimental effect on Hog Badger. On the one hand, the relative abundance index of Hog Badger dropped rapidly to its lowest level during the lockdown period and recovered slowly during the post-lockdown period. On the other hand, Hog Badgers were hardly active during daytime during this period. As expected, civets that are active only at night seemed to be least affected. Its relative abundance index and daily activity pattern remained almost unchanged. Increased livestock grazing did not result in significant decreases in the relative abundance indices of Reeves’s Pheasant and Raccoon Dog. However, it is important to emphasize that their activity patterns changed. Reeves’s Pheasant’s daily activity rhythms changed from bimodal to unimodal, and Raccoon Dog’s activity time during the day decreased. We observed a consistent increase in the relative abundance index of Wild Boar during the lockdown and post-lockdown periods, which may not imply that the increase in livestock activity had a positive impact on Wild Boar and may indirectly suggest that Wild Boars adapted well to environmental changes (Markov et al., 2019). Reeves’s Muntjac is associated with livestock originating from wild herbivore ancestry, and they are similar in terms of resource requirements (Madhusudan, 2004). Livestock are often buffered against resource depletion and fluctuation through supplemental feeding, and they have a competitive edge over wild herbivore species. When livestock species are introduced into a co-evolved assemblage of native wild herbivore species, they may therefore compete with, and even exclude, native wild herbivores (Mishra et al., 2002). We observed that Reeves’s Muntjac relative abundance index peaked during the lockdown period and declined to a lower level compared to the pre-lockdown period during the post-lockdown period. One possible explanation is that there is a hysteresis effect when the presence of livestock exerts negative impacts on some wildlife species (Gil et al., 2020). Wild Boars are distributed almost all over the earth, and they are considered as pests in many areas (Massei and Genov, 2004; Markov et al., 2019), probably due to their high degree of adaptability and behavioral plasticity (Tomasz et al., 2013; Johann et al., 2020). Consequently, our findings support the hypothesis that species active during daylight hours are more likely to suffer adverse effects from livestock grazing. Our study did not demonstrate the relationship between wildlife body size and disturbance degree, but body size is also an important factor influencing disturbance intensity (Whitworth et al., 2019). There is a need to study the significance of this effect and its impact on individual fitness and species interactions. A systematic approach to understanding and managing temporal interactions between human and wildlife may shed new insight into wildlife conservation (Behera et al., 2022).
The presence of livestock instills a strong sense of fear in wildlife and creates a landscape of fear, which may force wildlife to adjust their activities to avoid contact with livestock (Gaynor et al., 2019). All species are unequally affected by livestock activity, and functional traits such as extensive habitat tolerance and nocturnal activity promote behavioral flexibility in response to livestock activity (Mishra et al., 2004; Di Bitetti et al., 2020). The increased presence and activity of livestock during the COVID-19 lockdown changed the livestock-induced fear. Our results showed species-specific changes in activity patterns, reduced daytime activities of Hog Badger and Raccoon Dog, and avoidance responses of targeted species to livestock presence on a temporal scale, thus supporting previous studies on the effects of livestock disturbance on wildlife (Di Bitetti et al., 2020; Behera et al., 2022). Previous studies have also shown that the vigilance level of Reeves's pheasant is significantly positively correlated with livestock abundance index, which indirectly suggests that livestock presence may have infused fear in Reeves's Pheasant and forced it to adjust its activities to avoid contact with livestock (Hua et al., 2022).
A number of factors influence the spatio-temporal distribution patterns of wildlife (Bogdan et al., 2016; Karanth et al., 2017). We did not observe a unique pattern of environmental factors other than an effect of livestock disturbance on the spatio-temporal distribution of the six species in this study. Here are two possible reasons. The possible reason is that our study was characterized by relatively high naïve occupancy values of most species, indicating the homogeneous use of the study landscape by these species, which in addition to a limited number of camera traps may have limited the information available to characterize the habitat use patterns of species. Reliable depiction of fine-scale spatial correlations may require higher camera densities than those implemented in this study (Waddle et al., 2010; Bischof et al., 2014). Second, interspecific interactions among the six species were not considered in this study.
Our assessment of the spatial avoidance response of Reeves's Pheasant showed a number of significant effects, which is in line with our expectations. Previous studies have shown direct adverse effects of Raccoon Dog, Masked Palm Civet and Hog Badger as well as indirect adverse effects of wild boars, Reeves’s Muntjac and livestock on Reeves's Pheasant (Wang et al., 2016; Zhang et al., 2017; Hua et al., 2022). Camera traps have also captured pictures of raccoon dogs catching Reeves's Pheasant chicks. The relationship between Reeves's Pheasant and livestock is unique among all species investigated. We found that the livestock avoidance level of Reeves's Pheasant was positively correlated with livestock relative abundance index during the lockdown period. Specifically, Reeves's Pheasant have been recorded at almost every location where livestock were captured, and livestock relative abundance increased the avoidance level of Reeves's Pheasant. Given high spatiotemporal similarities between Reeves's Pheasant and livestock, we speculate that Reeves's Pheasant may have adapted itself to livestock presence by adjusting behavior and pace of activity, rather than by simply adjusting temporal or spatial activity patterns (Hua et al., 2022; Lu et al., 2022). High-resolution tracking data on both Reeves's Pheasant and its sympatric species can advance our understanding of species coexistence.
Our study sheds important insight into the effects of livestock grazing on wildlife by quantifying the responses of six forest-associated ground-dwelling wildlife species. The relative abundance indices and temporal distribution patterns of study species in response to large-scale changes in livestock activity outline the potential effects of blockades on wildlife. Further, our study considers three periods: pre-lockdown, lockdown and post-lockdown, and also quantifies the direct consequences of increased livestock grazing activity. However, our study only focuses on the areas with relatively small sample sizes because the COVID-19 lockdown limits further sampling. Field biologists consider the COVID-19 lockdown period to be a once-in-a-lifetime opportunity for observation and data collection in a world free of human disturbance (Bates et al., 2020, 2021; Behera et al., 2022). Thus, the results of this study provide important information for understanding wildlife responses to this global crisis. Our findings will also help in planning rapid conservation actions for proactive and reactive wildlife management interventions during the pandemic.
During the closure, rural residents were confined to their homes, resulting in a reduction in human-livestock interactions and an increase in the intensity of livestock activity in wildlife habitats, which had an indirect effect on local wildlife, especially on those active during daylight hours. As a result, during and after the closure, some wildlife species reduced their activity time during daylight hours. The COVID-19 crisis has exposed existing potential threats to forests wildlife, as well as gaps in existing systems, thus opening up areas for improvement. As many ecosystems and wildlife populations are near critical points, the current crisis may lead to population declines, local extinctions of species, and increased disruption of ecological processes (Lindsey et al., 2020). The crisis highlighted the connections between nature, climate change, and human, and called for a restructuring of existing systems to reduce the risk of future crises. The scientific knowledge gained during this crisis will enable us to develop innovative strategies for wildlife and human coexistence on this planet.
Authors’ contributions
JH analyzed the data and led efforts to draft the manuscript. ST, JL and JX improved the manuscript and directed the research. JH, ST, SL, ZZ, XH and JT completed the data collection. All authors read and approved the final manuscript.
Ethics statement
The data collected for analyses in this study were based on camera traps, and all fieldwork abided by the current laws of China.
Competing interest
The authors declare that they have no known competing financial interests or personal relationships that could have appeared to influence the work reported in this paper.
Arora, S., Bhaukhandi, K.D., Mishra, P.K., 2020. Coronavirus lockdown helped the environment to bounce back. Sci. Total Environ. 742, 140573. .
Bar, H., 2021. COVID-19 lockdown: animal life, ecosystem and atmospheric environment. Environ. Dev. Sustain. 23, 8161-8178. .
Bates, A.E., Primack, R.B., Moraga, P., Duarte, C.M., 2020. COVID-19 pandemic and associated lockdown as a "Global Human Confinement Experiment" to investigate biodiversity conservation. Biol. Conserv. 248, 6. .
Bates, A.E., Primack, R.B., Biggar, B.S., Bird, T.J., Clinton, M.E., Command, R.J., et al., 2021. Global COVID-19 lockdown highlights humans as both threats and custodians of the environment. Biol. Conserv. 263, 109175. .
Behera, A.K., Kumar, P.R., Priya, M.M., Ramesh, T., Kalle, R., 2022. The impacts of COVID-19 lockdown on wildlife in Deccan Plateau, India. Sci. Total Environ. 822, 153268. .
Bischof, R., Ali, H., Kabir, M., Hameed, S., Nawaz, M.A., 2014. Being the underdog: an elusive small carnivore uses space with prey and time without enemies. J. Zool. 293, 40-48. .
Bogdan, V., Junek, T., Vymyslicka, P.J., 2016. Temporal overlaps of feral cats with prey and competitors in primary and human-altered habitats on Bohol Island, Philippines. PeerJ 4, e2288. .
Budiman, I., Kusumaratna, R.K., 2021. Human-nature interactions through the lens of global pandemics: a review. Hum. Ecol. 28, 15-24. .
Chen, X., Fu, F., 2022. Highly coordinated nationwide massive travel restrictions are central to effective mitigation and control of COVID-19 outbreaks in China. Proc. R. Soc. A 478, 20220040. .
China Meteorological Administration, 2020. China Meteorological Administration Land Surface Data Assimilation System (CLDAS-V2.0) real-time product dataset. .
Chowdhury, R.B., Khan, A., Mahiat, T., Dutta, H., Tasmeea, T., Arman, A.B.B., et al., 2021. Environmental externalities of the COVID-19 lockdown: Insights for sustainability planning in the Anthropocene. Sci. Total Environ. 783, 147015. .
Cooke, S.J., Cramp, R.L., Madliger, C.L., Bergman, J.N., Reeve, C., Rummer, J.L., et al., 2021. Conservation physiology and the COVID-19 pandemic. Conserv. Physiol. 9, coaa139. .
Corradini, A., Peters, W., Pedrotti, L., Hebblewhite, M., Bragalanti, N., Tattoni, C., et al., 2021. Animal movements occurring during COVID-19 lockdown were predicted by connectivity models. Glob. Ecol. Conserv. 32, e01895. .
Cusack, J.J., Dickman, A.J., Kalyahe, M., Rowcliffe, J.M., Carbone, C., MacDonald, D.W., et al., 2017. Revealing kleptoparasitic and predatory tendencies in an African mammal community using camera traps: a comparison of spatiotemporal approaches. Oikos 126, 812-822. .
Derryberry, E.P., Phillips, J.N., Derryberry, G.E., Blum, M.J., Luther, D., 2021. Singing in a silent spring: birds respond to a half-century soundscape reversion during the COVID-19 shutdown. Integer. Comp. Biol. 61, E197-E198.
Di Bitetti, M.S., Iezzi, M.E., Cruz, P., Varela, D., De Angelo, C., 2020. Effects of cattle on habitat use and diel activity of large native herbivores in a South American rangeland. J. Nat. Conserv. 58, 125900. .
Dirzo, R., Young, H.S., Galetti, M., Ceballos, G., Isaac, N.J.B., Collen, B., 2014. Defaunation in the Anthropocene. Science 345, 401-406. .
Dormann, C.F., Elith, J., Bacher, S., Buchmann, C., Carl, G., Carre, G., et al., 2013. Collinearity: a review of methods to deal with it and a simulation study evaluating their performance. Ecography 36, 27-46. .
.
Gaynor, K.M., Brown, J.S., Middleton, A.D., Power, M.E., Brashares, J.S., 2019. Landscapes of fear: spatial patterns of risk perception and response. Trends Ecol. Evol. 34, 355-368. .
Geldmann, J., Joppa, L.N., Burgess, N.D., 2014. Mapping change in human pressure globally on land and within protected areas. Conserv. Biol. 28, 1604-1616. .
Gil, M.A., Baskett, M.L., Munch, S.B., Hein, A.M., 2020. Fast behavioral feedbacks make ecosystems sensitive to pace and not just magnitude of anthropogenic environmental change. P. Natl. Acad. Sci. USA 117, 25580-25589. .
Gomez, H., Wallace, R.B., Ayala, G., Tejada, R., 2005. Dry season activity periods of some Amazonian mammals. Stud. Neotrop. Fauna Environ. 40, 91-95. .
Hua, J.Q., Lu, S., Song, K., Wang, J.Y., Wang, J.F., Xu, J.L., 2022. Effects of livestock grazing on spatio-temporal patterns and behaviour of Reeves’s Pheasant Syrmaticus reevesii. Animals 12, 2968. .
Hughes, I., 2000. Biological consequences of global warming: is the signal already apparent? Trends Ecol. Evol. 15, 56-61. .
Jiménez-Valverde, A., 2012. Insights into the area under the receiver operating characteristic curve (AUC) as a discrimination measure in species distribution modelling. Global Ecol. Biogeogr. 21, 498-507. .
Johann, F., Handschuh, M., Linderoth, P., Dormann, C.F., Arnold, J., 2020. Adaptation of wild boar (Sus scrofa) activity in a human-dominated landscape. BMC Ecol. 20, 4. .
Jones, K.R., Venter, O., Fuller, R.A., Allan, J.R., Maxwell, S.L., Negret, P.J., et al., 2018. One-third of global protected land is under intense human pressure. Science 360, 788-791. .
Karanth, K.U., Srivathsa, A., Vasudev, D., Puri, M., Parameshwaran, R., Kumar, N.S., 2017. Spatio-temporal interactions facilitate large carnivore sympatry across a resource gradient. Proc. R. Soc. B 284, 20161860. .
Koju, N.P., Kandel, R.C., Acharya, H.B., Dhakal, B.K., Bhuju, D.R., 2021. COVID-19 lockdown frees wildlife to roam but increases poaching threats in Nepal. Ecol. Evol. 11, 9198-9205. .
Kraemer, M.U.G., Yang, C.H., Gutierrez, B., Wu, C.H., Klein, B., Pigott, D.M., et al., 2020. The effect of human mobility and control measures on the COVID-19 epidemic in China. Science 368, 493-497. .
Kupferschmidt, K., Cohen, J., 2020. China's aggressive measures have slowed the coronavirus. They may not work in other countries. Science 2. .
Lecchini, D., Brooker, R.M., Waqalevu, V., Gairin, E., Minier, L., Berthe, C., et al., 2021. Effects of COVID-19 pandemic restrictions on coral reef fishes at eco-tourism sites in Bora-Bora, French Polynesia. Mar. Environ. Res. 170, 105451. .
Li, P., 2021. Conceptualizing China's spatial lockdown during the COVID-19 pandemic: a neo-liberal society or a pre-liberal one? Soc. Transf. Chin. Soc. 17, 101-108. .
Lindsey, P., Allan, J., Brehony, P., Dickman, A., Robson, A., Begg, C., et al., 2020. Conserving Africa's wildlife and wildlands through the COVID-19 crisis and beyond. Nat. Ecol. Evol. 4, 1300-1310. .
Liu, L., Lin, Q.H., Liang, Z.R., Du, R.G., Zhang, G.Z., Zhu, Y.H., et al., 2021. Variations in concentration and solubility of iron in atmospheric fine particles during the COVID-19 pandemic: An example from China. Gondwana Res. 97, 138-144. .
Loh, H.C., Looi, I., Ch'ng, A.S.H., Goh, K.W., Ming, L.C., Ang, K.H., 2021. Positive global environmental impacts of the COVID-19 pandemic lockdown: a review. GeoJournal 87, 4425-4437. .
Lu, S., Liu, Z.X., Tian, S., Song, K., Hu, Q., Xu, J.L., 2022. Sex-specific movement responses of Reeves’s Pheasant to human disturbance: Importance of body characteristics and reproductive behavior. Animals 12, 1619. .
Madhusudan, M.D., 2004. Recovery of wild large herbivores following livestock decline in a tropical Indian wildlife reserve. J. Appl. Ecol. 41, 858-869. .
Manenti, R., Mori, E., Di Canio, V., Mercurio, S., Picone, M., Caffi, M., et al., 2020. The good, the bad and the ugly of COVID-19 lockdown effects on wildlife conservation: Insights from the first European locked down country. Biol. Conserv. 249, 108728. .
Markov, N., Pankova, N., Morelle, K., 2019. Where winter rules: Modeling wild boar distribution in its north-eastern range. Sci. Total Environ. 687, 1055-1064. .
Massei, G., Genov, P.V., 2004. The environmental impact of wild boar. Galemys 16, 135-145. .
McGinlay, J., Gkoumas, V., Holtvoeth, J., Fuertes, R.F.A., Bazhenova, E., Benzoni, A., et al., 2020. The impact of COVID-19 on the management of European protected areas and policy implications. Forests 11, 1214. .
Mishra, C., Wieren, S., Heitkonig, I., Prins, H., 2002. A theoretical analysis of competitive exclusion in a Trans-Himalayan large-herbivore assemblage. Anim. Conserv. 5, 251-258. .
Meredith, M., Ridout, M., 2021. Overlap: Estimates of coefficient of overlapping for animal activity patterns. R package version 0.3.4. .
Mishra, C., Van Wieren, S.E., Ketner, P., Heitkonig, I.M.A., Prins, H.H.T., 2004. Competition between domestic livestock and wild bharal Pseudois nayaur in the Indian Trans-Himalaya. J. Appl. Ecol. 41, 344-354. .
Muche, M., Yemata, G., Molla, E., Muasya, A.M., Tsegay, B.A., 2022. COVID-19 lockdown and natural resources: a global assessment on the challenges, opportunities, and the way forward. Bull. Natl. Res. Cent. 46, 20. .
Neupane, D., 2020. How conservation will be impacted in the COVID-19 pandemic. Wildl. Biol., wlb.00727 , 2020.
Niedballa, J., Wilting, A., Sollmann, R., Hofer, H., Courtiol, A., 2019. Assessing analytical methods for detecting spatiotemporal interactions between species from camera trapping data. Remote Sens. Ecol. Con. 5, 272–285. .
O'Brien, T.G., Kinnaird, M.F., Wibisono, H.T., 2003. Crouching tigers, hidden prey: Sumatran tiger and prey populations in a tropical forest landscape. Anim. Conserv. 6, 131-139. .
Paital, B., 2020. Nurture to nature via COVID-19, a self-regenerating environmental strategy of environment in global context. Sci. Total Environ. 729, 139088. .
Parsons, A.W., Bland, C., Forrester, T., Baker-Whatton, M.C., Schuttler, S.G., McShea, W.J., et al., 2016. The ecological impact of humans and dogs on wildlife in protected areas in eastern North America. Biol. Conserv. 203, 75–88. .
Pine, M.K., Wilson, L., Jeffs, A.G., McWhinnie, L., Juanes, F., Sceuderi, A., et al., 2021. A Gulf in lockdown: How an enforced ban on recreational vessels increased dolphin and fish communication ranges. Global Change Biol. 27, 4839-4848. .
Pudyatmoko, S., 2017. Free-ranging livestock influence species richness, occupancy, and daily behaviour of wild mammalian species in Baluran National Park, Indonesia. Mamm. Biol. 86, 33-41. .
R Core Team, 2021. R: A language and environment for statistical computing. R Foundation for Statistical Computing, Vienna. .
Ridout, M.S., Linkie, M., 2009. Estimating overlap of daily activity patterns from camera trap data. J. Agric. Biol. Environ. Stat. 14, 322-337. .
Royle, J.A., Link, W.A., 2006. Generalized site occupancy models allowing for false positive and false negative errors. Ecology 87, 835-841. .
Rutz, C., Loretto, M.C., Bates, A.E., Davidson, S.C., Duarte, C.M., Jetz, W., et al., 2020. COVID-19 lockdown allows researchers to quantify the effects of human activity on wildlife. Nat. Ecol. Evol. 4, 1156-1159. .
Smith, A.T., Yan, X., Robert, S.H., Darrin, L., John, M., Don, E.W., et al., 2010. A Guide to the Mammals of China. Princeton University Press, Princeton.
Smith, M.K.S., Smit, I.P.J., Swemmer, L.K., Mokhatla, M.M., Freitag, S., Roux, D.J., et al., 2021. Sustainability of protected areas: Vulnerabilities and opportunities as revealed by COVID-19 in a national park management agency. Biol. Conserv. 255. 108985, .
Sollmann, R., 2018. A gentle introduction to camera-trap data analysis. Afr. J. Ecol. 56, 740-749. .
Sun, Z.B., Zhang, H., Yang, Y.F., Wan, H., Wang, Y.X., 2020. Impacts of geographic factors and population density on the COVID-19 spreading under the lockdown policies of China. Sci. Total Environ. 746, 141347. .
Tomasz, P., Grzegorz, B., Bogumila, J., Leif, S., Stanislaw, Ś., Włodzimierz, J., et al., 2013. Spatiotemporal behavioral plasticity of wild boar (Sus scrofa) under contrasting conditions of human pressure: primeval forest and metropolitan area. J. Mammal. 94, 109-119. .
Tucker, M.A., Bohning-Gaese, K., Fagan, W.F., Fryxell, J.M., Van Moorter, B., Alberts, S.C., et al., 2018. Moving in the Anthropocene: Global reductions in terrestrial mammalian movements. Science 359, 466-469. .
Vimal, R., 2022. The impact of the Covid-19 lockdown on the human experience of nature. Sci. Total Environ. 803, 149571. .
Waddle, J.H., Dorazio, R.M., Walls, S.C., Rice, K.G., Beauchamp, J., Schuman, M.J., et al., 2010. A new parameterization for estimating co-occurrence of interacting species. Ecol. Appl. 20, 1467-1475. .
Wagenmakers, E.J., 2003. Model selection and multimodel inference: a practical information-theoretic approach. J. Math Psychol. .
Walther, G-R., Post, E., Convey, P., Menzel, A., Parmesan, C., Beebee, T.J.C., et al., 2002. Ecological responses to recent climate change. Nature 416, 389-395. .
Wang, Q.Y., Zhao, Y.Z., Luo X., Hua, J.Q., Xu, J.L., 2016. Potential nest predators of Syrmaticus reevesii based on camera traps and artificial nests. Chin. J. Appl. Ecol. 27, 1968-1974. . (in Chinese)
Whitworth, A., Beirne, C., Huarcaya, R.P., Whittaker, L., Rojas, S.J.S., Tobler, M.W., et al., 2019. Human disturbance impacts on rainforest mammals are most notable in the canopy, especially for larger-bodied species. Divers. Distrib. 25, 1166-1178. .
Xu, J.L., Zhang, X.H., Sun, Q.H., Zheng, G.M., Wang, Y., Zhang, Z.W., 2009. Home range, daily movements and site fidelity of male Reeves’s Pheasants Syrmaticus reevesii in the Dabie Mountains, central China. Wildlife Biol. 15, 338-344. .
Zellmer, A.J., Wood, E.M., Surasinghe, T., Putman, B.J., Pauly, G.B., Magle, S.B., et al., 2020. What can we learn from wildlife sightings during the COVID-19 global shutdown? Ecosphere 11, e03215. .
Zhang, J.D., Hull, V., Ouyang, Z.Y., Li, R.G., Connor, T., Yang, H.B., et al., 2017. Divergent responses of sympatric species to livestock encroachment at fine spatiotemporal scales. Biol. Conserv. 209, 119–129. .
Table
2.
Log-transformed parameter estimates of explanatory variables from the model average during the pre-lockdown, lockdown and post-lockdown periods.
Species
Scenario
Occupancy
Detection
Covariates
βEstimates
SE
Covariates
βEstimates
SE
Reeves’s Pheasant
Pre-lockdown
DNR
2.95
1.82
DNR
0.16
0.15
Ele
−0.82
0.87
DNW
−0.17
0.17
LRAI
0.33***
0.12
Lockdown
NA
NA
NA
NA
NA
NA
Post-Lockdown
Ele
−2.64
2.56
DNS
−0.61*
0.33
PRAI
−2.22
4.42
Ele
1.95
0.58
PRAI
−1.37***
0.30
Raccoon Dog
Pre-lockdown
DNS
2.79
2.43
DNW
−0.64***
0.18
PRAI
−44.83
57.60
LRAI
0.54***
0.16
Vegetation
−44.83
57.60
Lockdown
LRAI
−0.36
0.49
DNR
0.21*
0.10
Vegetation
−1.52
0.98
DNS
−0.33*
0.13
Vegetation
−0.21
0.10
Post-lockdown
DNR
−1.01
0.57
DNR
0.87***
0.21
Vegetation
0.14
1.10
LRAI
−0.22
0.19
Vegetation
−1.21***
0.41
Masked Palm Civet
Pre-lockdown
DNS
93.28
92.34
Ele
0.03
0.22
DNW
−48.93
49.47
LRAI
1.26***
0.28
PRAI
−4.64**
1.56
Lockdown
NA
NA
NA
NA
NA
NA
Post-lockdown
PRAI
8.73
43.97
LRAI
0.07
0.26
Vegetation
0.35
0.35
PRAI
−3.29*
1.60
Vegetation
−1.54*
0.68
Hog Badger
Pre-lockdown
Ele
−0.17
0.49
Ele
−0.51*
0.21
LRAI
0.36
0.49
LRAI
−0.15*
0.09
PRAI
4.65
3.86
Lockdown
Ele
2.13
1.43
Ele
−1.83**
0.61
PRAI
−0.88
2.93
LRAI
−0.82
0.87
Vegetation
0.42
0.88
Post-lockdown
DNW
0.71
0.74
DNR
−0.36
0.42
PRAI
0.76
0.87
DNS
0.98**
0.34
Reeves’s Muntjac
Pre-lockdown
DNS
1.30
1.72
DNS
0.40***
0.11
Ele
2.20
1.29
LRAI
0.16*
0.08
LRAI
−0.17
0.72
PRAI
0.11
0.08
Lockdown
DNW
10.22
13.77
DNS
−0.51***
0.10
Ele
6.49
7.99
PRAI
0.06
0.08
Vegetation
12.38
63.91
Vegetation
0.26
0.18
Post-lockdown
DNR
−12.89
16.30
DNR
0.17
0.13
LRAI
13.63
18.43
Ele
0.09
0.12
LRAI
−0.15*
0.09
Wild Boar
Pre-lockdown
DNS
0.09
0.41
DNR
0.004
0.06
DNW
9.85
5.22
DNS
−0.15
0.19
LRAI
−2.84
1.72
DNW
0.008
0.07
Lockdown
DNS
−0.19
0.67
DNS
−0.47
0.23
LRAI
0.66
0.88
DNW
0.63***
0.16
PRAI
1.39
3.30
Vegetation
1.04***
0.31
Post-lockdown
Ele
−4.48
5.63
DNR
0.08
0.15
LRAI
−1.87
11.42
Ele
0.38**
0.16
DNR = distance from the nearest road, DNS = distance from the nearest settlement, DNW = distance from the nearest water, Ele = elevation, LRAI = livestock relative abundance index, PRAI = people relative abundance index. Significance codes: p < 0.001***, p < 0.01**,p < 0.05*.
Table
3.
Comparison of spatiotemporal avoidance responses of Reeves's Pheasant to sympatric species and livestock in 195 arrays. NA indicates a small sample size and is not included in the analysis.

 DownLoad:


 Email Alerts
 RSS Feeds