Grzegorz Neubauer, Arkadiusz Sikora. 2023: Heterogeneity in song rates in the Collared Flycatcher (Ficedula albicollis) explained with the availability parameter in generalized N-mixture models: Its importance for abundance estimates in avian aural counts. Avian Research, 14(1): 100080. DOI: 10.1016/j.avrs.2023.100080
Citation:
Grzegorz Neubauer, Arkadiusz Sikora. 2023: Heterogeneity in song rates in the Collared Flycatcher (Ficedula albicollis) explained with the availability parameter in generalized N-mixture models: Its importance for abundance estimates in avian aural counts. Avian Research, 14(1): 100080. DOI: 10.1016/j.avrs.2023.100080
Grzegorz Neubauer, Arkadiusz Sikora. 2023: Heterogeneity in song rates in the Collared Flycatcher (Ficedula albicollis) explained with the availability parameter in generalized N-mixture models: Its importance for abundance estimates in avian aural counts. Avian Research, 14(1): 100080. DOI: 10.1016/j.avrs.2023.100080
Citation:
Grzegorz Neubauer, Arkadiusz Sikora. 2023: Heterogeneity in song rates in the Collared Flycatcher (Ficedula albicollis) explained with the availability parameter in generalized N-mixture models: Its importance for abundance estimates in avian aural counts. Avian Research, 14(1): 100080. DOI: 10.1016/j.avrs.2023.100080
Heterogeneity in song rates in the Collared Flycatcher (Ficedula albicollis) explained with the availability parameter in generalized N-mixture models: Its importance for abundance estimates in avian aural counts
Laboratory of Forest Biology, University of Wrocław, Sienkiewicza 21, 50-335, Wrocław, Poland
b.
Ornithological Station, Museum and Institute of Zoology, Polish Academy of Sciences, Nadwiślańska 108, 80-680, Gdańsk, Poland
Funds: Field work was funded by the General Directorate for Environmental Protection, Poland, within the inventory of birds in the SPA Natura 2000 Napiwodzko-Ramucka Forest
Binomial N-mixture models are commonly applied to estimate abundance unaffected by imperfect detection, but are known to be sensitive to violations of assumptions. One of the model's assumptions, the independence of detections has rarely been tested. It requires that during a survey, detection of one individual does not affect detection of another individual. This assumption can be frequently violated in passerine birds, which exhibit territorial behaviour by singing, since neighbouring individuals are likely to motivate each other to vocalize, leading to non-independence in singing activity and in the following detection rate. Here, we explored this phenomenon with the generalized, binomial version of the N-mixture model, where detection probability is decomposed into availability probability φ – which can be interpreted as per capita song rate or the probability of vocalising – and actual detection probability p, given vocalisations take place. Using repeated counts of the Collared Flycatcher (Ficedula albicollis) as a case study, and treating the maximum observed counts C at a site i as an explanatory covariate for φ, we showed that per capita song rates increased with observed counts at a site. Hence, if song rates vary due to local abundance, including C as an explanatory variable for song rate addressed with φ, helps to explain this variation (which otherwise goes undetected) and improves inferences under the model. This had strong effects on the resulting abundance estimates: if this relationship was ignored in the models, total estimated population sizes were consequently lower by as much as 22–27%, compared to when this effect was included. Since it is likely that song rates may commonly be density-dependent in birds manifesting territorial behaviours by singing, further tests addressing violations of independence assumptions in these models are needed. As suggested by Kéry and Royle (2016), despite some form of circularity likely being involved, modelling heterogeneity in the detection process with the help of C in standard N-mixture models (which, given availability, conflate availability with detection in a single parameter) should be applicable as well.
The ease of obtaining data originating from repeated counts of animals and the possibility to get abundance estimates unaffected by imperfect detection makes N-mixture models (Royle, 2004) increasingly popular (Kéry and Royle, 2016). The paper, which introduced the model (Royle, 2004) has been cited 928 times based on CrossRef accessed via the Biometrics journal website (as of December 7, 2022), which indicates a high importance of this type of model in studies of abundance. However, their sensitivity to violations of assumptions has been repeatedly stressed (Hunt et al., 2012; Warren et al., 2013; Barker et al., 2018; Link et al., 2018) but their validations were reported equally often (Bötsch et al., 2019; Costa et al., 2019, 2021; Kéry, 2018; Neubauer et al., 2022). Among a few important assumptions, these models assume that detections are independent among individuals: detecting one individual at a site is assumed not to affect detecting another one (Royle, 2004). This assumption can be violated when song rates increase with abundance Ni at a site i (Kéry and Royle, 2016), where territorial males motivate each other to vocalize as demonstrated by Warren et al. (2013) and Neubauer et al. (2022). Within N-mixture models, unmodelled heterogeneity among individual birds in detection probability p should lead to underestimating abundance, so if this relationship is present, but unaccounted for, abundance will be biased low and thus, conclusions remain questionable. Simulations by Kéry and Royle (2016, pages 248–250), however, did not support this expectation: both parameters, detection probability p and abundance λ were estimated approximately correctly in the presence of individual heterogeneity in p, even if this was ignored in the model. One of the approaches suggested to overcome this type of heterogeneity in p is to model it as a function of abundance (if available) at a site Ni or a measure of it (like the maximum per-site count), despite some form of circularity probably being involved; few (if any) studies addressed this issue (Kéry and Royle, 2016). In this paper we expand this exercise, by taking advantage of generalized binomial N-mixture models, where detection is decomposed into availability probability and actual detection probability, provided an individual is available (Chandler et al., 2011). Song rates can then be directly captured by the availability parameter φ, which is separate from detection probability p. In contrast, both these processes are involved and summarized in a single 'detection probability' parameter in the simpler, standard binomial N-mixture model (Royle, 2004). We fit generalized binomial N-mixture models to the repeated counts, collected with a robust design protocol, of a forest passerine, the Collared Flycatcher (Ficedula albicollis) (Neubauer and Sikora, 2013). We tested whether (1) song rates increase with observed abundance, (2) adding an explanatory variable for φ in the form of observed count improves model fit and inference and (3) is there any effect on abundance estimates if this heterogeneity is not accounted for (i.e., a misspecified model is fitted). We also fitted a standard, binomial N-mixture model (Royle, 2004), which ignores the multiscale nature of these data to compare abundance estimates when availability is conflated with detection. We then explored the results to strengthen understanding and outline profits resulting from modelling density-dependence in hierarchical models for abundance.
2.
Methods
2.1
Study site and field methods
We used a dataset from Collared Flycatcher repeated counts in Las Warmiński nature reserve (N Poland), originally analysed with dynamic occupancy models (Neubauer and Sikora, 2013), except that binary detection-nondetection data were converted back to the original abundance data (per-site and per-visit number of singing males). The reserve, established in 1982, covers 1803 ha, including 1550 ha of forests (Fig. 1). This forest is mostly coniferous (with Scots Pine Pinus sylvestris dominating over Norway Spruce Picea abies), but isolated patches of deciduous stands, mostly with Pendunculate Oak (Quercus robur) (up to 240 years old), European Hornbeam (up to 180 years old) and Black Alder (Alnus glutinosa) along the waterbodies and rivers provide suitable breeding habitat spots for the Collared Flycatchers. Seventy-eight sites, being State Forests sections, with boundaries frequently drawn along forest roads, streams or lake shores, were highly variable in shape and size (0.5–11 ha). They shared suitable habitat (dominant tree age of 100+ years, deciduous trees prevailing) and were predefined prior to the study. Observers (the authors) surveyed them with standardized effort (6–8 min spent on counting singing birds per hectare) to detect the number of the Collared Flycatcher males present. Four individual visits (hereafter counts) to each site were performed between late April and late May 2012. The robust design approach was followed: counts were repeated close in time to form 'surveys', over which the population is assumed closed. In this study, two counts formed survey 1 (all 78 sites visited with 1–3 day intervals: during 27–30 April and again, during 30 April–3 May), and after ca. two weeks, the next two counts formed survey 2 (all 78 sites visited during 18–20 May and again, during 20–23 May, keeping intervals between visits to the same sites within the range of 1–4 days). Surveys 1 and 2 were separated by longer intervals (ca. two weeks), over which the population was assumed open. Sites were visited to count flycatchers between sunrise (05:00 during survey 1, 04:30 during survey 2) until afternoon, and usually ended around 13:00–14:00. For further details on fieldwork, see Neubauer and Sikora (2013).
Figure
1.
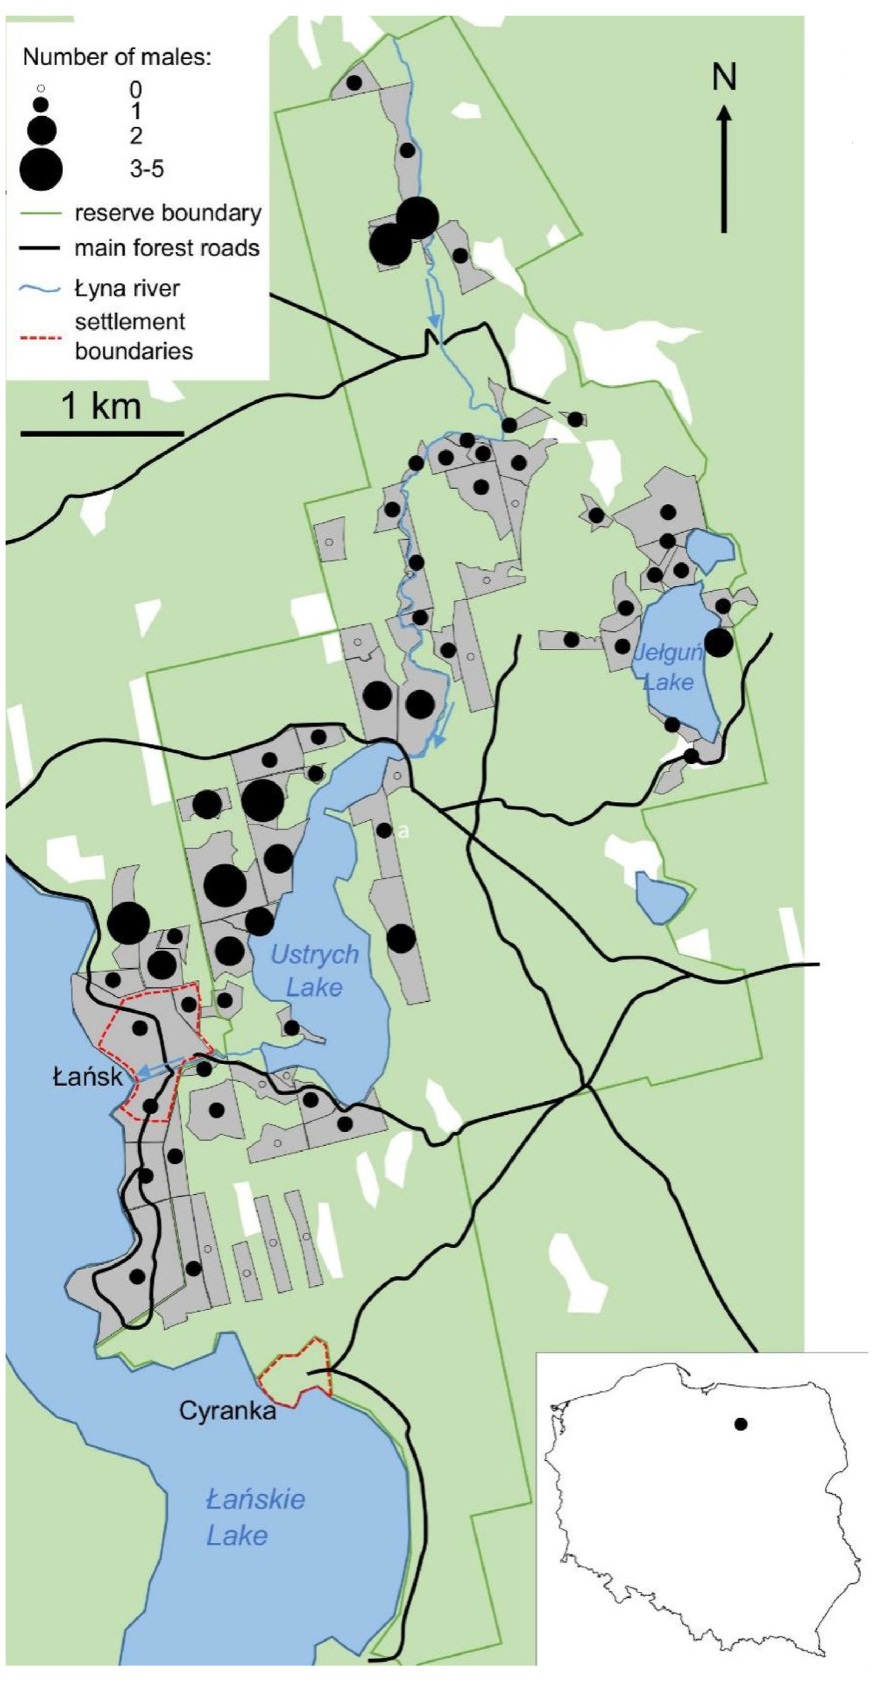
Schematic map of the study area, Las Warmiński nature reserve. Surveyed sites are depicted by grey polygons (their boundaries are approximate), while the distribution and maximum per-site counts over four visits (Cmaxi) of Collared Flycatcher males is shown with circles varying in size for each site. Łańsk (a resort) and Cyranka, marked with dashed, red lines are the only permanent settlements within the reserve. Forests in green, white depicts deforested areas (mainly marshes and meadows). (For interpretation of the references to colour in this figure legend, the reader is referred to the Web version of this article.)
We used the generalized, binomial N-mixture model developed to account for geographical openness by considering temporary emigration and estimating it with a parameter called availability probability φ (φ = 1 – temporary emigration; Chandler et al., 2011) in addition to abundance λ and detection probability p. The temporary emigration can be any process which makes an individual periodically unavailable for detection. The φ parameter emerges from decomposing the processes responsible for detecting an individual into the probability of being available (pa, sensu Nichols et al., 2009) and the "true" probability of detecting an individual (pd) provided it is available, i.e., it sings (so that the probability of detecting an individual is a product pa × pd, see Nichols et al., 2009). The availability parameter can adequately address either of the two types of temporary emigration leading to the individual being unavailable for detection: its movements in space resulting in leaving the site (but not necessarily the territory) physically or being inactive (like staying silent or being hidden) despite being present at a site. These two processes were named "spatial" and "random", respectively, by Kéry and Royle (2016, page 485), and we follow these names here. Despite being relatively intuitive, depending on which of the two processes it addresses in a given case, availability might or might not be incorporated into density estimates, the quantity for which hierarchical models were developed (Kéry and Royle, 2016). If temporary emigration is due to spatial movements, then the density under the model is D = (λ × φ)/area. Not accounting for temporary emigration leads to overestimation of abundance, since entire territories are 'included' into the area surveyed (a 'site'), despite their parts extending (well) beyond the boundaries of sampling sites (see Chandler et al., 2011). This overestimation can be particularly strong with point counts, but including availability or applying distance sampling protocols or both help to solve this problem (Neubauer and Sikora, 2020). With individuals staying silent (like not vocalising in birds, hiding or burrowing in other animal groups), density is D = λ/area, since individuals go undetected due to being unavailable for detection, despite being present. However, if availability is included into density estimations in such cases, the estimated quantity is the number of available individuals (e.g., visible or vocally active, that may potentially be detected). In the simpler binomial N-mixture model (Royle, 2004), a parameter named detection probability summarizes both pa and pd.
Generalized, binomial N-mixture models have a hierarchical structure, composed of three submodels: for estimating abundance, availability probability and detection probability, given an individual is available for detection (Chandler et al., 2011). We fitted 16 such models (see Table 1) to count data of the Collared Flycatcher using the gpcount function. The abundance submodel had its parameter (abundance) constant but included log (site area) as an offset, which makes the model effectively estimating density per area unit (ha). The submodels for availability differed, to make possible direct comparisons of models considering density dependence and ignoring it. We used observed, maximum count Cmax at a site as a covariate for availability, being a factor with four levels: no male observed, a single male observed, two males observed and three to five males observed, with the latter category pooling the very few sites where 3 or 5 males were detected (no sites held 4 males). The availability probability was thus either (1) kept constant (a model which does not account for density-dependent probability of vocalising), (2) modelled as survey-dependent (as above, but survey dependence allows to address within-season variation, i.e., differences in availability between surveys 1 and 2), (3) modelled as a function of maximum count Cmax at a site (a model which addresses density-dependence in the probability of vocalising) or (4) modelled as both survey- and maximum count-dependent (a model which addresses variation from (2) and (3)). The detection probability (pd sensu Nichols et al., 2009, provided that an individual is available) in our models was modelled with another set of covariates, which included observer effect (a factor with two levels: G.N. or A.S.) and time of day (expressed in minutes since sunrise, see above; the latter being a survey-specific covariate and cannot be treated as a covariate for availability). Therefore, the models forming our set could be ranked from the simplest to the most complex, given the structure of submodels for availability and detection. The most complex model (model (4) in Table 1) can be described as:
Mi∼Poisson(λ), with log(λ)=β0+offset(log( area ))
Ni∣Mi∼Binomial(Mi,φ) with logit (φ)=β0+β1×survey+β2×Cmax
Ci∣Ni∼Binomial(Ni,p), with logit (p)=β0+β1× observer +β2× time
Table
1.
Generalized binomial N-mixture models fitted to repeated count data of Collared Flycatcher (Ficedula albicollis) in Las Warmiński nature reserve, N Poland, spring 2012. The three Greek letters denote submodels for abundance (λ), availability probability (φ) and detection probability (p). Heterogeneity in availability probability (i.e., probability of vocalising or song rate) was either unmodelled (with availability probability kept constant across sites and unrelated to abundance, denoted φ) or modelled as a function of maximum count at a site (denoted φCmax) or survey (φsurvey) or both. The remaining submodels were either the same across models (abundance, λ, modelled as constant across sites but with site area included as an offset) or modelled as a function of observer (pobs), time of the day, (ptime) or both (detection probability, p). Models are ranked according to AIC, from top-supported (the lowest AIC value) to least supported. Np is the number of parameters in the model, '+' denotes models with weights < 0.01.
where Mi denotes the super population size, i.e., the total number of individuals potentially to be detected, Ni denotes the number of individuals available for detection given φ and Ci is the number of individuals actually detected, given p. Any simpler model can be obtained by removing the effects to be omitted.
We focused on paired comparisons of fitted models within our setting by comparing two models each time: one with density dependence in availability accounted for and the other one with this form of heterogeneity unmodelled and identical structure of the remaining submodels. This was based on information criteria (AIC). Model fitting and model selection was performed with the R (version 3.6.3, R Core Team, 2021) unmarked package (Fiske and Chandler, 2011) using the gpcount (Chandler et al., 2011) and pcount (for standard, binomial N-mixture model) functions. Models were ranked with the modSel function applied to an unmarked FitList object.
To get the estimates of density (derived quantity, computed as λ × φ) along with its variance, we applied a nonparboot function from the unmarked package. It uses non-parametric bootstrapping for variance estimation under single models. With this technique, the original dataset is resampled with replacement many times, a given model fitted to each resample and parameters then estimated. We repeated bootstrapping 100 times for the three top-supported models to get approximate distributions of parameters; means with SD and confidence intervals (Table 2, Figs. 1 and 2) were computed from these distributions.
Table
2.
Parameter estimates from the generalized N-mixture models fitted to count data of Collared Flycatcher (Ficedula albicollis) in Las Warmiński nature reserve, 2012 (N Poland). Models (1), (2) and (3) are the top-supported models from Table 1. All the values are on a normal scale with their 95% confidence intervals in parentheses. Availability probability is shown for the sites occupied by 1, 2 and 3 to 5 males. Estimates of the total population size (summed abundances across all sites surveyed) for the surveys 1 and 2 are also shown.
a Only the intercept is shown, despite this model including insignificant time effect in detection. b Estimates for both observers (A.S. and G.N.) are shown.
Figure
2.
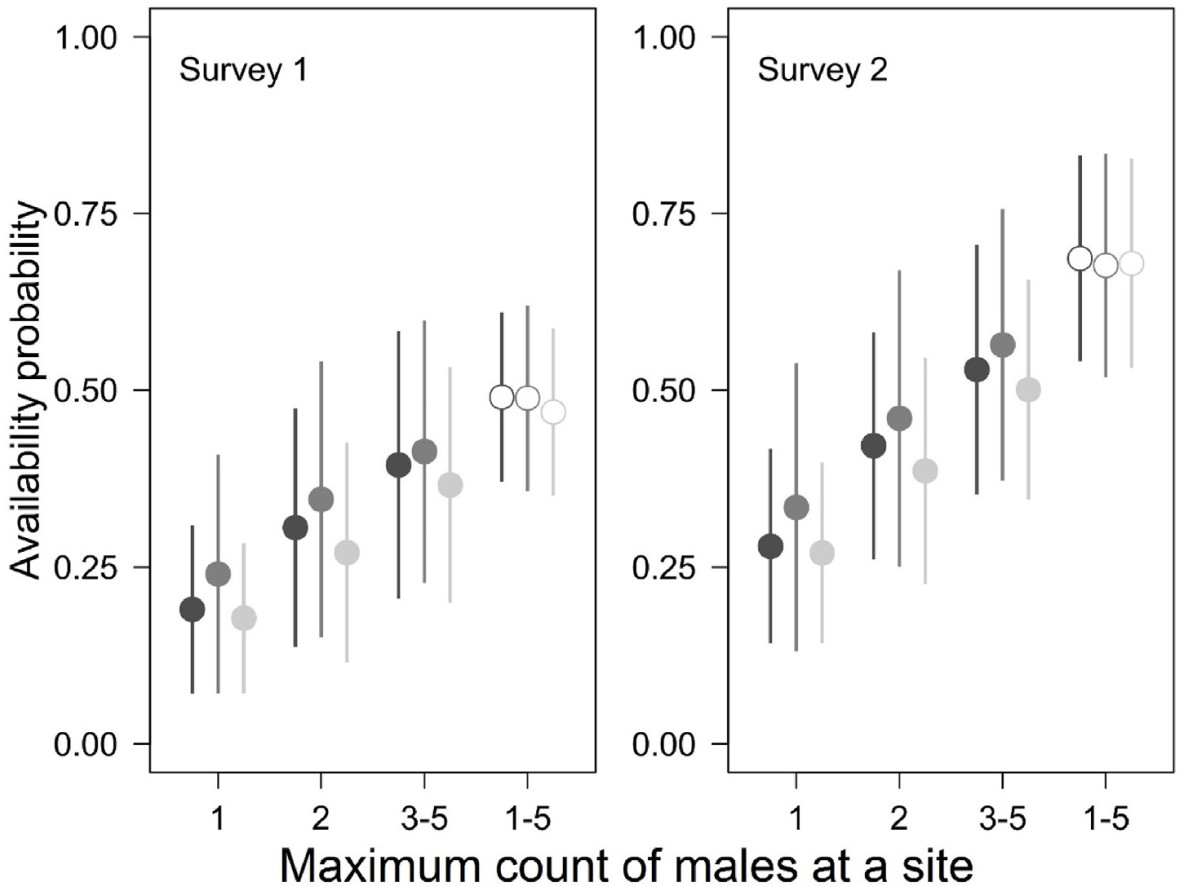
Relationships between the song rate (i.e., probability of vocalising) measured with availability probability in the generalized binomial N-mixture models and maximum count (Cmaxi) at a site for the Collared Flycatcher repeated surveys in the Las Warmiński reserve, N Poland, spring 2012. Means (points) ± 1 SD (whiskers) are shown. The three symbols for each Cmaxi indicate estimates under the three top-supported models in Table 1 (models 1, 2 and 3, with AIC weights of 0.42, drawn with dark grey, 0.17, drawn with medium grey, and 0.16, drawn with pale grey). Estimates of availability probability from the models with identical structure except for ignoring relationships between availability and Cmaxi (thus only a single availability value, equal for all the sites, regardless of maximum count is estimated under these models) are shown on the right with empty symbols. These three models (Table 1: models 9, 10 and 11), had AIC weights of zero.
There was overwhelming evidence that models with availability modelled as a function of observed, maximal per-site abundance Cmax were much better supported than the ones where this heterogeneity was not accounted for. The cumulative AIC weight of the former group of models was 1 (Table 1). Models with identical structure as the three top-supported models, but missing this single effect in φ, were worse in terms of support by at least 50 AIC units. The top-supported models (with ΔAIC ≤ 2) agreed that the availability probability of the Collared Flycatcher males increased with maximum observed count (a measure of local abundance), suggesting that per capita song rates were higher where there were more males at a site. For sites with a single male, two males and 3–5 males, model-averaged estimates from the three top-supported models were 0.20 (95% confidence intervals: 0.13–0.40), 0.31 (0.19–0.56) and 0.40 (0.24–0.64), during survey 1 and 0.30 (0.20–0.52), 0.43 (0.27–0.65) and 0.54 (0.37–0.75) during survey 2, respectively (Fig. 2). If this relationship was ignored in a model, a single availability value for all the sites was estimated higher: mean values were 0.48 for survey 1 and 0.68 for survey 2 (Fig. 2).
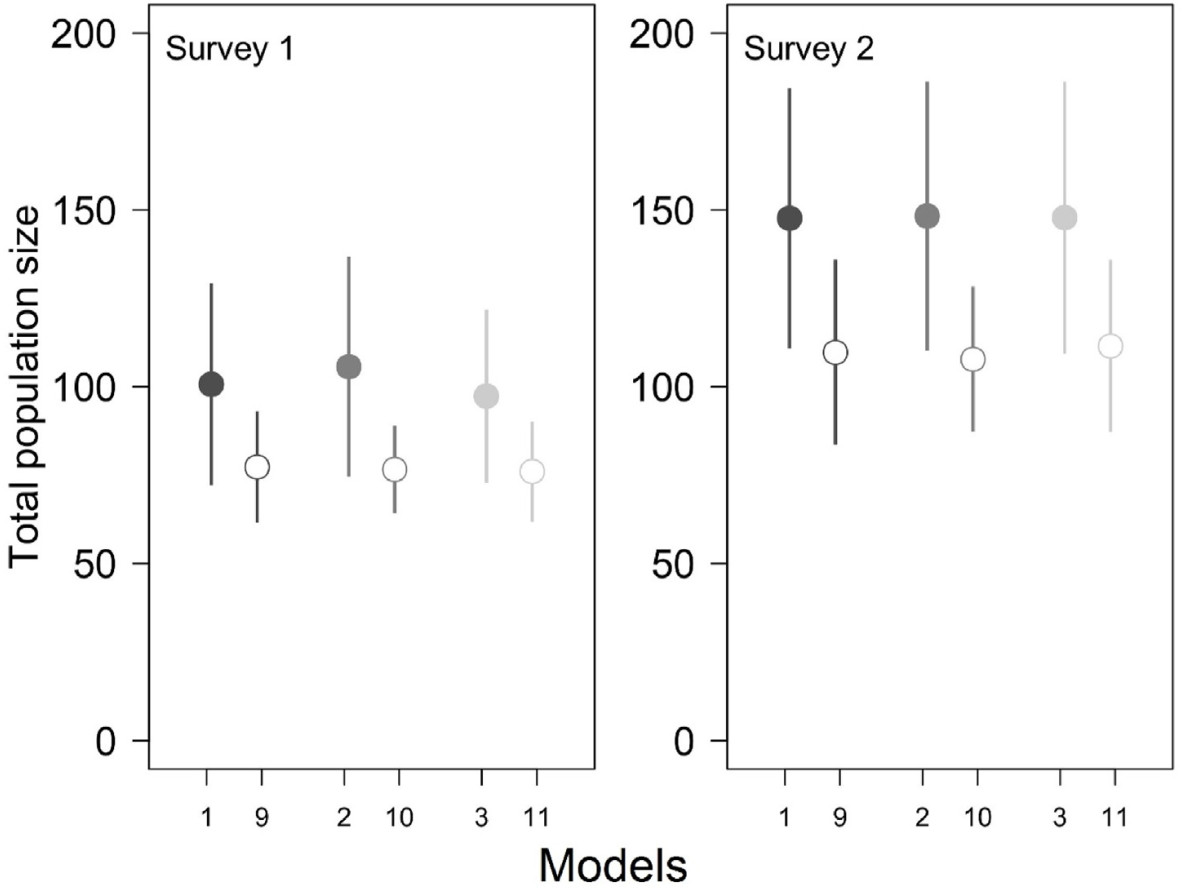
Abundance estimates for the whole studied area (i.e., the total population size for all the sites surveyed) were very similar for surveys 1 and 2 under the three top-supported models (97–106 males during survey and 148 during survey 2), with wide confidence intervals (Table 2). Analoguous estimates from the three identical models, missing the effect of maximum count in φ but with otherwise identical structure were respectably lower, particularly for survey 2 (Fig. 3). This confirms that unmodelled heterogeneity in availability leads to an underestimation of abundance: estimated population sizes were lower by 22–27% under the models ignoring heterogeneity in availability and the total population size was estimated at 76–77 males during survey 1 and at 108–112 males during survey 2 (Fig. 3). The total population size estimated under the standard binomial N-mixture model fitted to all four counts (thus ignoring the multiscale nature of the data and with detection probability kept constant) was 142 (95% CI: 93–227) males, which is very similar to the survey 2 estimates under generalized models (Table 2).
Figure
3.
Total population sizes of the Collared Flycatcher in the Las Warmiński reserve, N Poland, spring 2012, estimated under generalized binomial N-mixture models. Means (points) ± 1 SD (whiskers) are shown. Models (1), (2) and (3) drawn with filled symbols are the top-supported models (Table 1: models 1, 2 and 3) and include the relationship between availability and maximum count at a site (Cmaxi), while 'paired' models (9), (10) and (11) are shown with empty symbols and have identical structure as (1), (2) and (3) except that they ignore this relationship.
Detection probabilities were rather low, ranging between 0.3 and 0.4 under the three top-supported models (Table 2).
4.
Discussion
This study is most likely the first one based on real-world data, which explores the relationship between availability probability and local abundance with generalized, binomial N-mixture models. We show that (1) per capita song rates were dependent on a measure of local abundance – the maximum observed count Cmax and that (2) modelling availability as a function of Cmax helps to explain this heterogeneity and improves inference. Previously, male-male vocal interactions known as counter singing, were found to increase song rates and affect detection probability with structurally simpler, standard binomial N-mixture models for the Marsh Tit (Poecile palustris), another forest passerine (Neubauer et al., 2022). Similarly, Warren et al. (2013) demonstrated that per-capita song rates increased with abundance in Golden-cheeked Warblers (Setophaga chrysoparia), violating the assumption of independence in detection probability in binomial N-mixture models. This resulted in abundance estimates biased low, and the strength of this bias increased with local abundance. However, in standard binomial N-mixture models, detection probability includes availability and is a product of both processes, while in the generalized version we used here, these are separate parameters. It is therefore natural that if availability reflects the probability of vocalising, the independence assumption refers to being vocally active, not to detection itself (unlike in N-mixture models [Royle, 2004], where detection probability summarizes both availability and actual detection). In the present work, we showed that, despite some form of circularity being involved (as already stressed by Kéry and Royle, 2016), models accounting for this form of heterogeneity – i.e., song rates dependent on local abundance – were much better supported than models ignoring it. Therefore, using observed, maximum per site counts as a covariate for φ improves model fit and helps to explain this variation. If ignored, it introduces a negative bias in abundance estimates with binomial N-mixture models as well (Warren et al., 2013). At the other hand, structurally the simplest binomial N-mixture model, when fitted to our flycatcher data, produced abundance estimates similar as the generalized models that consider relationship between Cmax and availability (Table 2). It remains to be studied whether this is just a case or a regular feature of binomial N-mixture models with a simple structure.
Kéry and Royle (2016) mention that in WinBUGS it is also possible to specify a binomial N-mixture model, where the latent abundance Ni (not a proxy for it, as we did in this study using Cmax) is included as a covariate for detection. Some such models experimentally fitted to simulated data seemed estimable, but others – fitted to real-world data – failed to produce promising estimates (Kéry and Royle, 2016, page 310).
Previous analysis of the count data used here (Neubauer and Sikora, 2013), applied dynamic occupancy models (MacKenzie et al., 2003). In their simplest form, as used in Neubauer and Sikora (2013), these models can only estimate detection probability (as a product of being available and being detected), and we've used maximum count Cmax as a covariate for detection probability, to show that the latter increases with abundance (more precisely, the number of neighbours, that is Cmax – 1 in an attempt to reflect habitat quality). However, in occupancy models, the estimated detection probability refers to a species (i.e., the probability of detecting at least one individual at a site). With detection decomposed into availability probability and actual detection probability in the generalized N-mixture models (Chandler et al., 2011) we used here, one can directly address the probability of vocalising (song rate) via the former parameter, which makes these models likely more appropriate to estimate abundance than binomial N-mixture models, particularly when the field protocol is based on point counts (see Neubauer and Sikora, 2020).
In summary, the so far little explored relationship between local abundance (or a measure of it) and detection (in standard binomial N-mixture models, Royle, 2004) or availability probability (in generalized binomial N-mixture models, Chandler et al., 2011) clearly deserves further attention. Using local, observed counts, or density, as a covariate for availability or detection should improve model fit and resulting abundance estimates (Kéry and Royle, 2016, page 310) with any commonly applied field protocols, like point counts. It remains to be verified with both simulations and real-world data.
Author contributions
GN and AS formulated the question, designed field work, collected data and wrote the paper. GN analyzed the data. Both authors read and approved the final manuscript.
Ethics statement
The study was conducted in compliance with permissions from the Regional Directorate for Environmental Protection, Olsztyn, Poland.
Declaration of competing interest
The authors declare that they have no competing interest.
Acknowledgements
The authors wish to express their gratitude to Marc Kéry and an anonymous Reviewer for their constructive suggestions, extremely helpful in improving the manuscript. Our thanks go also to Daniel O'Connell for improving the language, and to Tomasz Chodkiewicz and Zenon Rohde for their help with map preparation.
Barker, R.J., Schonfield, M.R., Link, W.A., Sauer, J.R., 2018. On the reliability of N-mixture models for count data. Biometrics 74, 369−377.
Bötsch, Y., Jenni, L., Kéry, M., 2019. Field evaluation of abundance estimates under binomial and multinomial N-mixture models. Ibis 162, 902−910.
Chandler, R.B., Royle, J.A., King, D.I., 2011. Inference about density and temporary emigration in unmarked populations. Ecology 92, 1429−1435.
Costa, A., Oneto, F., Salvidio, S., 2019. Time-for-space substitution in N-mixture modeling and population monitoring. J. Wildl. Manag. 83, 737−741.
Costa, A., Salvidio, S., Penner, J., Basile, M. 2021. Time-for-space substitution in N-mixture models for estimating population trends: A simulation-based evaluation. Sci. Rep. 11, 4581.
Fiske, I., Chandler, R., 2011. Unmarked: An R package for fitting hierarchical models of wildlife occurrence and abundance. J. Stat. Softw. 43, 1−23.
Hunt, J.W., Weckerly, F.W., Ott, J.R., 2012. Reliability of occupancy and binomial mixture models for estimating abundance of Golden-cheeked Warblers Setophaga chrysoparia. The Auk 129, 105-114.
Kéry, M., 2018. Identifiability in N-mixture models: A large-scale screening test with bird data. Ecology 99, 281−288.
Kery, M., Royle, A.J., 2016. Applied Hierarchical Modeling in Ecology. Analysis of Distribution, Abundance and Species Richness in R and BUGS. Vol. 1. Prelude and Static Models. Academic Press, London, UK.
Link, W.A., Schofield, M.R., Barker, R.J., Sauer, J.R., 2018. On the robustness on N-mixture models. Ecology 99, 1547−1551.
MacKenzie, D.I., Nichols, J.D., Hines, J.E., Knutson, M.G., Franlin, A.B., 2003. Estimating site occupancy, colonization, and local extinction when a species is detected imperfectly. Ecology 84, 2200-2207.
Neubauer, G., Sikora, A., 2013. Detection probability of the Collared Flycatcher Ficedula albicollis during quick, multiple surveys: a case study in an isolated population in northern Poland. Ornis Fennica 90, 211−221.
Neubauer, G., Sikora, A., 2020. Abundance estimation from point counts when replication is spatially intensive but temporally limited: Comparing binomial N-mixture and hierarchical distance sampling models. Ornis Fennica 97, 131−148.
Neubauer, G., Wolska, A., Rowiński, P., Wesołowski, T., 2022. N-mixture models estimate abundance reliably: A field test on Marsh Tit using time-for-space substitution. Ornithol. Appl. 124, 1−13.
Nichols, J.D., Thomas, L., Conn, P.B., 2009. Inferences about landbird abundance from count data: Recent advances and future directions. In: Thomson, D.L., Cooch, E.G., Conroy, M.J. (Eds.), Modeling Demographic Processes in Marked Populations. Springer, New York, NY, pp. 201−235.
Royle, J.A., 2004. N-mixture models for estimating population size from spatially replicated counts. Biometrics 60, 108−115.
R Core Team, 2021. R: A Language and Environment for Statistical Computing. R Foundation for Statistical Computing, Vienna, Austria.
Warren, C.C., Veech, J.A., Weckerly, F.W., O'Donnell, L., Ott, J.R., 2013. Detection heterogeneity and abundance estimation in population of Golden-cheeked Warblers Setophaga chrysoparia. The Auk 130, 677−688.
Table
1.
Generalized binomial N-mixture models fitted to repeated count data of Collared Flycatcher (Ficedula albicollis) in Las Warmiński nature reserve, N Poland, spring 2012. The three Greek letters denote submodels for abundance (λ), availability probability (φ) and detection probability (p). Heterogeneity in availability probability (i.e., probability of vocalising or song rate) was either unmodelled (with availability probability kept constant across sites and unrelated to abundance, denoted φ) or modelled as a function of maximum count at a site (denoted φCmax) or survey (φsurvey) or both. The remaining submodels were either the same across models (abundance, λ, modelled as constant across sites but with site area included as an offset) or modelled as a function of observer (pobs), time of the day, (ptime) or both (detection probability, p). Models are ranked according to AIC, from top-supported (the lowest AIC value) to least supported. Np is the number of parameters in the model, '+' denotes models with weights < 0.01.
Table
2.
Parameter estimates from the generalized N-mixture models fitted to count data of Collared Flycatcher (Ficedula albicollis) in Las Warmiński nature reserve, 2012 (N Poland). Models (1), (2) and (3) are the top-supported models from Table 1. All the values are on a normal scale with their 95% confidence intervals in parentheses. Availability probability is shown for the sites occupied by 1, 2 and 3 to 5 males. Estimates of the total population size (summed abundances across all sites surveyed) for the surveys 1 and 2 are also shown.
a Only the intercept is shown, despite this model including insignificant time effect in detection. b Estimates for both observers (A.S. and G.N.) are shown.

 DownLoad:


 Email Alerts
 RSS Feeds