Zheng Li, Jie Zhou, Minzhi Gao, Wei Liang, Lu Dong. 2022: Parapatric speciation with recurrent gene flow of two sexual dichromatic pheasants. Avian Research, 13(1): 100031. DOI: 10.1016/j.avrs.2022.100031
Citation:
Zheng Li, Jie Zhou, Minzhi Gao, Wei Liang, Lu Dong. 2022: Parapatric speciation with recurrent gene flow of two sexual dichromatic pheasants. Avian Research, 13(1): 100031. DOI: 10.1016/j.avrs.2022.100031
Zheng Li, Jie Zhou, Minzhi Gao, Wei Liang, Lu Dong. 2022: Parapatric speciation with recurrent gene flow of two sexual dichromatic pheasants. Avian Research, 13(1): 100031. DOI: 10.1016/j.avrs.2022.100031
Citation:
Zheng Li, Jie Zhou, Minzhi Gao, Wei Liang, Lu Dong. 2022: Parapatric speciation with recurrent gene flow of two sexual dichromatic pheasants. Avian Research, 13(1): 100031. DOI: 10.1016/j.avrs.2022.100031
Ministry of Education Key Laboratory for Biodiversity and Ecological Engineering, College of Life Sciences, Beijing Normal University, Beijing, 100875, China
b.
Ministry of Education Key Laboratory for Ecology of Tropical Islands, College of Life Sciences, Hainan Normal University, Haikou, 571158, China
Understanding speciation has long been a fundamental goal of evolutionary biology. It is widely accepted that speciation requires an interruption of gene flow to generate strong reproductive isolation between species. The mechanism of how speciation in sexually dichromatic species operates in the face of gene flow remains an open question. Two species in the genus Chrysolophus, the Golden Pheasant (C. pictus) and Lady Amherst's Pheasant (C. amherstiae), both of which exhibit significant plumage dichromatism, are currently parapatric in southwestern China with several hybrid recordings in field. In this study, we estimated the pattern of gene flow during the speciation of the two pheasants using the Approximate Bayesian Computation (ABC) method based on data from multiple genes. Using a newly assembled de novo genome of Lady Amherst's Pheasant and resequencing of widely distributed individuals, we reconstructed the demographic history of the two pheasants by the PSMC (pairwise sequentially Markovian coalescent) method. The results provide clear evidence that the gene flow between the two pheasants was consistent with the predictions of the isolation with migration model during divergence, indicating that there was long-term gene flow after the initial divergence (ca. 2.2 million years ago). The data further support the occurrence of secondary contact between the parapatric populations since around 30 kya with recurrent gene flow to the present, a pattern that may have been induced by the population expansion of the Golden Pheasant in the late Pleistocene. The results of the study support the scenario of speciation between the Golden Pheasant and Lady Amherst's Pheasant with cycles of mixing-isolation-mixing, possibly due to the dynamics of geographical context in the late Pleistocene. The two species provide a good research system as an evolutionary model for testing reinforcement selection in speciation.
The fascination that evolutionary biologists have long had with speciation has increased in recent decades due to the growing understanding of the complex mechanisms that shape biodiversity. Allopatric speciation driven by geographical isolation, implying the absence of gene flow, has been the standard model with which to interpret the progress in understanding speciation (Mayr, 1942; Coyne and Orr, 2004). However, allopatric speciation models without gene flow seem oversimplified, because the recurrence of secondary contact after the initial divergence provides opportunities for gene exchange between populations (Rohling et al., 1998; Lambeck and Chappell, 2001) (also known as partial extrinsic barriers) that may induce parapatric speciation (Coyne and Orr, 2004). Since more empirical examples of divergence in sympatry or parapatry have been reported, it is now widely accepted that speciation can occur in the presence of gene flow (Rice and Salt, 1988; Bolnick and Fitzpatrick, 2007; Nosil, 2008). To understand how speciation may proceed in the face of gene flow, one must understand the pattern and role of gene flow in the speciation process.
Much research to date has focused on the speciation process in monomorphic species of birds such as Hwameis (Li et al., 2010), Crows (Poelstra et al., 2014), Darwin's Finches (Lamichhaney et al., 2015), and Bamboo Partridges (Wang et al., 2021). These studies have revealed the importance of disruptive selection or assortative mating that promotes speciation with gene flow. However, research on the evolutionary mechanisms of speciation in sexually dichromatic species has lagged behind (Servedio, 2011). Compared with sexually monomorphic species, sexually dichromatic species may be exposed to more intense sexual selection that plays an important role in driving population divergence as an essential component of pre-zygotic isolation. There are several studies based on theoretical models and simulations (Servedio, 2012, 2016; Servedio and Bürger, 2014) concerning the pattern and role of gene flow in speciation of sexually dichromatic species, and a few empirical studies in birds (e.g., Dong et al., 2013). The lack of relevant studies has limited our understanding of the mode of speciation in sexually dichromatic birds.
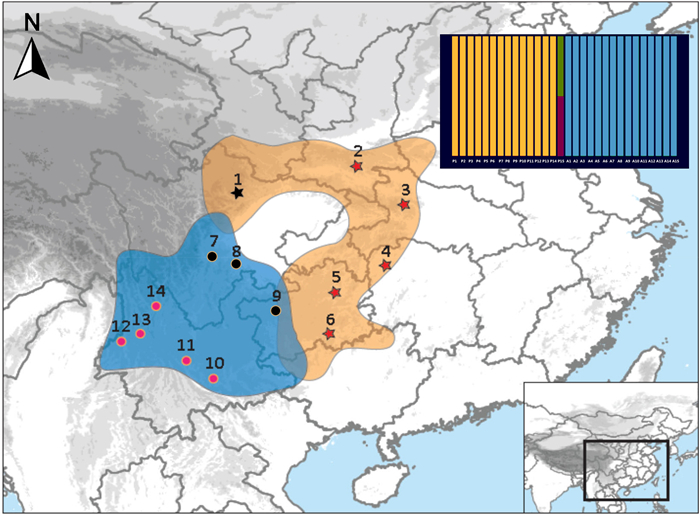
To examine the pattern and role of gene flow in speciation between sexually dichromatic species, we focused on two species in the genus Chrysolophus, the Golden Pheasant (C. pictus) and Lady Amherst's Pheasant (C. amherstiae), both of which exhibit significant plumage dichromatism. The males of the Golden Pheasant and Lady Amherst's Pheasant have extreme phenotypic differences in their plumage color, but the females are very similar, both with a duller mottled brown plumage. Golden Pheasants are distributed in the mountains of central and western China from the Qinling Mountains in the north to the Minshan Mountains in the west, while Lady Amherst's Pheasants are distributed in the Yunnan-Guizhou Plateau and the western and southern edges of the Sichuan Basin (Fig. 1). These two pheasants are currently parapatric in southwest China, with several hybrid recordings from western Sichuan (He and Wei, 1993; Shi et al., 2018) and northeast Yunnan (Deng, 1974) and an ancient hybrid recorded in a painting from one thousand years ago (Peng et al., 2016). These ongoing hybridization records imply incomplete pre-zygotic reproductive isolation in the hybrid zone. Observations of captive birds have also revealed incomplete post-zygotic reproductive isolation in the F1 hybrids and backcross hybrids, with a higher proportion in the male hybrids, corresponding to the prediction of Haldane's rule (Arrieta et al., 2013).
Figure
1.
The distribution and sampling locations of Chrysolophus pictus (orange zone, site 1–6) and C. amherstiae (blue zone, site 7–14). Allopatric populations of Chrysolophus are presented in red, and the individuals collected from the hybridzone and 50 km apart from the hybrid zone are presented in black (site 1, 7, 8 and 9). The histogram embedded in the upper right is the result of NewHybrid analysis (orange: C. pictus; blue: C. amherstiae; green and red: hybrid individual). (For interpretation of the references to color in this figure legend, the reader is referred to the Web version of this article.)
A study that employed an ecological niche model analysis proposed a scenario in which the ecological segregation established in allopatric glacial refugia in the late Pleistocene may have promoted the allopatric speciation of the two pheasant species (Lyu et al., 2015). However, without genetically based coalescence analysis, the niche-based model is limited to reconstructing the divergent history or estimating the mode of gene flow during the divergence between the two Chrysolophus species that is the key component to distinguishing parapatric speciation (isolation with gene flow) from allopatric speciation (isolation without gene flow). Moreover, the dynamics of geographical context in the late Pleistocene provide a good research system for studying speciation with or without gene flow in sexually dichromatic pheasants.
In this study, we combined multi-locus data from the sibling species of Chrysolophus and a de novo genome of C. amherstiae with resequencing of several individuals to achieve two goals. First, we aimed to detect candidate hybrids via phylogenetic analysis and further explore the mode of gene flow in speciation of C. pictus and C. amherstiae through Approximate Bayesian Computation (ABC) analysis (Beaumont et al., 2002). Second, we employed pairwise sequentially Markovian coalescent (PSMC) analyses (Li and Durbin, 2011) to inspect the evolutionary demographics of C. pictus and C. amherstiae based on the draft genome and resequencing data. These analyses allowed us to explore the pattern and role of gene flow in speciation of sexually dichromatic species, and the results will provide a better understanding of how speciation with gene flow proceeds.
2.
Materials and methods
2.1
Sampling, amplification, and sequencing
A total of 38 individuals (23 individuals of C. pictus and 15 individuals of C. amherstiae) from 15 locations were sampled across the geographic range of C. pictus and C. amherstiae (Fig. 1; Appendix Table S1). One Temminck's Tragopan (Tragopan temminckii) collected from Shimian (Sichuan, China) was used as the outgroup in the phylogenetic analysis. DNA was extracted from ethanol-preserved muscle, blood, or feathers using a TIANamp Genomic DNA kit (Tiangen Biotech Ltd., Beijing) following the manufacturer's protocol. The DNA was dissolved in 100 μL of TE buffer. A total of 37 exon loci (Appendix Table S2) including 34 unlinked autosomal loci and two Z-linked loci developed by Liu et al. (2018) and the mitochondrial cytochrome b (Cyt b) gene were amplified by polymerase chain reaction (PCR). The Touchdown PCR (Don et al., 1991) was performed in a PTC-220 PCR thermal cycler system (Bio-Rad, USA). The 40 μL reaction volume for PCR contained 2.4 μL template DNA, with 20 μL mixed concentrations of 2 × ExTaq buffer (Takara, Japan), 0.8 μL of each forward and reverse primer (10 μM), and 16 μL ddH2O. The initial denaturation was performed at 94 ℃ for 3 min followed by 20 cycles of 94 ℃ for 30 s, 62–52 ℃ (decreasing the annealing temperature by 0.5 ℃ per cycle) for 30 s and 72 ℃ for 1 min, and another 15 cycles of 94 ℃ for 30 s, 52 ℃ for 30s, and 72 ℃ for 1 min, ending with a final extension at 72 ℃ for 10 min. PCR products were sequenced bidirectionally using the 3730XL series platform Sequencer (Applied Biosystems, USA).
2.2
Sequence analysis
The obtained sequences were edited using the software CodonCode Aligner (CodonCode Corporation, Dedham, MA, USA) and aligned with Clustal W (Thompson et al., 1994) in MEGA v5.10 (Tamura et al., 2013), and the sequences with multiple deletions were removed. Haplotypes of the diploid nuclear sequences were separated using DNASP v5.10.01 (Librado and Rozas, 2009) based on a Markov chain Monte Carlo (MCMC) simulation approach with 500 bootstrap replicates, and the results of the first 100 runs were discarded. Due to the small sample size, haplotypes of the diploid nuclear sequences of T. temminckii were manually separated. The phased nuclear sequences and Cyt b sequences were aligned using Clustal W (Thompson et al., 1994) in MEGA v5.10 (Tamura et al., 2013).
We tested the neutrality of each gene using the Hudson-Kreitman-Aguade (HKA) test (Hudson et al., 1987) and Tajima's D (Tajima, 1989). The intra- and interspecific summary statistics were calculated for DNA polymorphism of each gene (Appendix Table S3) by DnaSP v5.10.01 (Librado and Rozas, 2009) for the subsequent ABC analysis (Beaumont et al., 2002). No significant λ2 (HKA) or Tajima's D were observed in the genes, except for the Tajima's D of the mitochondrial Cyt b gene (Appendix Table S4). The nuclear substitution rate of each nuclear gene was calculated followed the published method (Li et al., 2010). The mitochondrial Cyt b gene was not included in the ABC or PSMC analyses because its evolutionary rate differs from those of nuclear genes.
2.3
Detection of hybrids
We used the NewHybrids program (Anderson and Thompson, 2002) to calculate the posterior probability of sampled individuals belonging to parental or hybrid categories based on the genotypic information of the two pheasants. In this study, individuals collected 50 km from the sympatric zone without niche similarity (Lyu et al., 2015) were used as the parent group to estimate the allele frequencies of individuals collected in the hybrid zone or within 50 km. The dataset was analyzed three times using uniform priors for both θ and the mixing proportion π. The burn-in periods and numbers of sweeps were set to the values recommended in the manual. The mean value was used to infer hybrids between the two pheasants.
To infer the phylogenetic relationships between the two species, we used the ancestral reconstruction algorithm implemented in BEAST 1.8 (Drummond et al., 2012) based on autosomal nuclear genes, Z chromosome genes, and Cyt b genes. The substitution model of the genes were determined with jModelTest 2.1.3 (Darriba et al., 2012) based on the Bayesian information criterion (BIC). A strict clock was set for each gene; the rate for the Cyt b gene was set to 1.0, and the substitution rates of nuclear genes were estimated relative to the rate of the Cyt b gene. The length of the MCMC chain for the BEAST analysis was set at 1 × 10⁷ steps, and the first 10% of each run was discarded as a burn-in. Convergence was checked with Tracer 1.5 (Rambaut and Drummond, 2009) to confirm that the ESS values of the main parameters were above 200.
2.4
Approximate Bayesian Computation
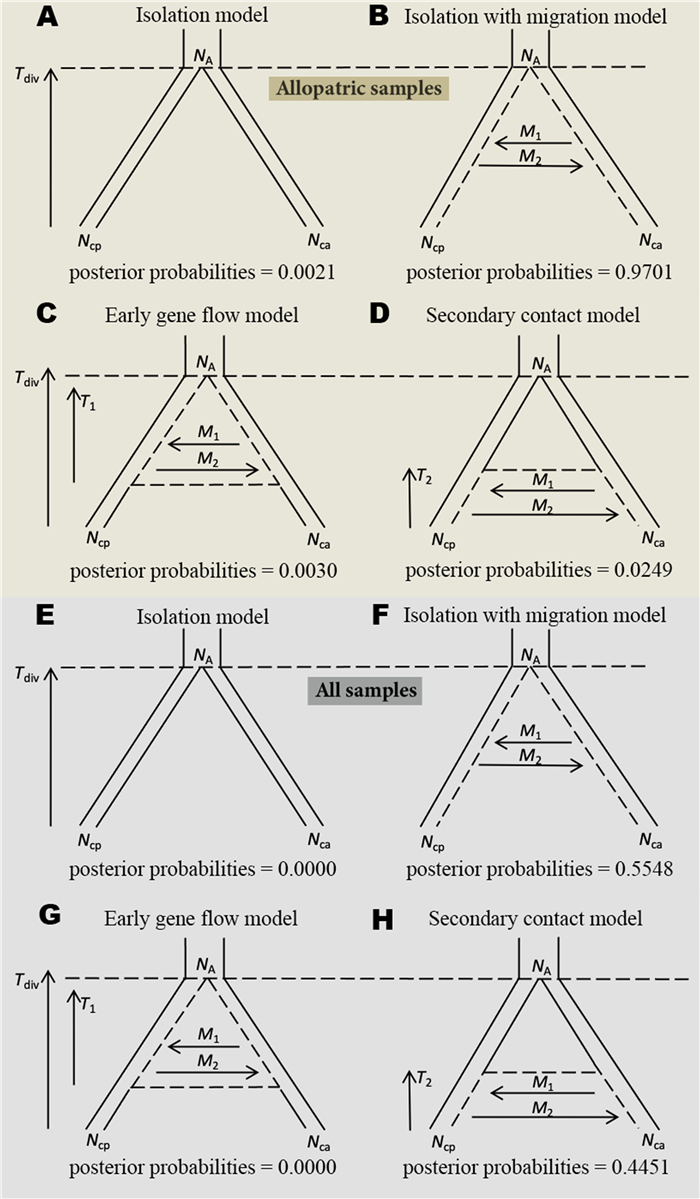
To infer the speciation history of the two Chrysolophus species, we used the ABC analysis that has been widely applied in phylogeographic studies (Beaumont et al., 2002; Beaumont, 2010; Bertorelle et al., 2010; Duchen et al., 2013; Cornejo-Romero et al., 2017) to statistically test four alternative models of demographic history: (1) an isolation model, where no gene flow occurs throughout the whole divergence process; (2) an isolation with migration model (IM model), where gene flow continuously occurs after an initial population split; (3) an early gene flow model, where gene flow only occurs at the initial stages of divergence; and (4) a secondary contact model, where gene flow only exists in the late period of divergence. The parameters to be estimated for the four models were as follows: divergence time (Tdiv), effective population sizes (Ne) of C. pictus (Ncp) and C. amherstiae (Nca), and Ne of the most common ancestor (NA). For the model with gene flow, the numbers of migrant birds in each generation were estimated: M1 represents the number of migrants of C. pictus; M2 represents the number of migrants from C. amherstiae; mcp represents the migration rate of C. pictus, and mca represents the migration rate of C. amherstiae.
For each speciation model, we used the software msABC (Pavlidis et al., 2010) to perform 1 × 10⁶ multi-locus coalescent simulations, and each divergence time was normalized by 4Ne. Demographic parameters were randomly sampled from a uniform distribution within the prior ranges (see details in Appendix Tables S5 and S6). We performed the model selection and parameter estimation under the most probable model using the "abc" package (Csilléry et al., 2012) in the R statistical programming environment (R Core Team, 2020). Using 1 × 10⁶ simulations, posterior probabilities for each demographic model were computed using multinomial logit regression (tolerance level = 0.001) (Beaumont et al., 2008). We selected the model with the highest posterior probability as the most probable model and performed 3 × 10⁶ coalescent simulations under the most probable model to estimate the parameters. The logit transformations of parameters were applied to estimate the posterior distributions of parameters under the most probable model via neural network regression (Blum and François, 2010). Each simulated dataset was weighted by its Euclidian distance through an Epanechnikov kernel (Jean-Marie et al., 2008). The mean and median values with the range of its 95% highest probability distribution (HPD) interval were reported.
Considering that the sympatric populations and hybrids may affect the result of model selection, analyses were conducted on two datasets: (1) allopatric populations of Chrysolophus (excluding the individuals collected from the hybrid zone and 50 km from the hybrid zone: site 1, 7, 8 and 9 in Fig. 1); and (2) all of the sampled individuals of the two Chrysolophus species.
2.5
Whole-genome assembly and PSMC analyses
One male Lady Amherst's Pheasant (collected in Dali, Yunnan, China) was selected to prepare two libraries (450 bp and 5 K) for sequencing on an Illumina HiSeq 2000 platform (Appendix Table S7). A total of 116.4 Gb of data were sequenced and assembled by ALLPATHS-LG v41687 (Butler et al., 2008) using default parameters (Appendix Table S7).
We resequenced 19 individuals from two Chrysolophus species (13 Golden Pheasants and six Lady Amherst's Pheasants, Appendix Table S4) with an average 35 × depth using Illumina NovaSeq 6000 deal-index sequencing libraries. Resequencing was performed by Novogene Company (Beijing, China). The trimmed clean reads of each individual were mapped back onto the assembled reference genome of C. amherstiae by BWA-MEM v0.7.12 (Li, 2013) using default parameters. We converted SAM files into binary BAM files, sorted the BAM files, and removed the PCR repeats using SAMtools v0.1.19 (Li et al., 2009).
By utilizing information from the whole genome of a single diploid individual, the PSMC analysis (Li and Durbin, 2011) can represent an appropriate method for estimating population size changes deep into the early Pleistocene. We applied the PSMC approach to the genomes of C. pictus (13 individuals) and C. amherstiae (6 individuals) to reconstruct the demographic history of each species. The consensus sequences (in BAM format) for each individual of each species were divided into non-overlapping 100-bp bins, where each bin was scored as heterozygous ('1') if there was a heterozygote in the bin, or as homozygous ('0') otherwise. The analysis was implemented with the fq2psmcfa command from the R package "psmc, " and the quality cut off (-q) was set to 20. The psmcfa sequences were taken as the input for the PSMC estimation to deduce the past Ne over time. The number of iterations (-N) was set to 25; Tmax (-t) was set to 15; the initial mutation/recombination ratio (-r) was set to 5, and the atomic time interval pattern (-p) was '4 + 25 × 2 + 4 + 6.' The psmc file was visualized with the mutation rate (μ) set to 3.8 × 10⁻⁹ per site per generation (generation time = 2 years) based on the mean nuclear substitution rate of Aves (Zhang et al., 2014).
3.
Results
3.1
Identification of hybrids
The Bayesian tree demonstrated substantial support for mutual monophyletic clades of the two pheasant species, with the exception of an incongruent phylogenetic position of one male Golden Pheasant (i.e., SCPW) collected near the hybrid zone (Fig. 1) using different molecular markers. The alleles of the male were clustered with the C. amherstiae when the autosome nuclear loci were employed to reconstruct the Bayesian phylogenetic relationships (Appendix Fig. S1), while the alleles were clustered with the C. pictus clade reconstructed by the mitochondrial Cyt b gene (Appendix Fig. S2). When the Z-link alleles were applied, the male alleles were found to be clustered with the two clades separately (Appendix Fig. S3). The phylogenetic incongruence was highly supported by the inference from the NewHybrids analyses, indicating that the male was detected as the hybrid of an F2 (posterior probability = 0.493) or backcross (posterior probability = 0.493) (Fig. 1).
3.2
Evolutionary history via ABC estimation
For allopatric populations of Chrysolophus, the best-supported model corresponded to an IM model (posterior probability = 0.97, Fig. 2b), indicating that ongoing gene flow has existed between C. pictus and C. amherstiae throughout the entire divergence process. The divergence time of C. pictus and C. amherstiae was estimated as 2.23 million years ago (Mya), and the gene flow from C. pictus to C. amherstiae (M2 = 2.00) was higher than that from C. amherstiae to C. pictus (M1 = 1.054) since the divergence. The Ne of C. amherstiae (Nca = 1.191 × 10⁵) was much larger than that of C. pictus (Ncp = 0.617 × 10⁵), and both species' effective population sizes were increased compared with the ancestor population size.
Figure
2.
Demographic history scenarios tested in this study, which included posterior probabilities for each model and parameters for divergence time (Tdiv), The time when there is gene flow in the early period (T1), the time when there is gene flow in the late period (T2), ancestral population size (NA), C. pictus and C. amherstiae sizes (Ncp and Nca, respectively) and gene flow (M1 and M2) when applicable. For (A to D), samples only include allopatric population of Chrysolophus. For (E to H), all sampled individuals of Chrysolophus, including individuals collected from hybridzone.
For all of the sampled individuals of two species, the IM model (posterior probability = 0.55, Fig. 2F) was best-supported. However, the secondary contact model was also highly supported compared with allopatric population estimation (posterior probability = 0.45, Fig. 2H). The divergence time of C. pictus and C. amherstiae under the best-supported IM model was estimated as 1.86 Mya, and the gene flow of the two pheasants was still asymmetric, where gene flow from C. pictus to C. amherstiae remained higher (Table 1). We further estimated the parameters of population dynamics under the secondary contact model because the posterior probabilities of the secondary contact model and isolation with migration model were very close. The initial secondary contact time of the two pheasants was estimated to be about 25, 800 years ago, indicating that the new hybrid zone was formed after the last glacial maximum. Gene flow retained the same trend with the estimation under IM model, but migration was increased in both directions compared with the IM model (Table 1). Consequently, medium-to-high gene flow was maintained during the speciation of the two pheasants in both categories with all of the models.
Table
1.
Population parameters of two datasets under isolation with migration model and secondary contact model estimated by ABC analysis.
Allopatric samples
All samples
Isolation with migration model
Isolation with migration model
Secondary contact model
Tdiv
M1
M2
Tdiv
M1
M2
T2
M1
M2
2.5% HPD
4.26 × 10⁵
0.184
0.254
4.57 × 10⁵
0.116
0.473
0.031 × 10⁵
0.668
2.14
Median
22.8 × 10⁵
0.929
1.70
19.3 × 10⁵
0.602
1.774
0.130 × 10⁵
2.92
8.97
Mean
22.3 × 10⁵
1.054
2.00
18.6 × 10⁵
0.713
1.054
0.258 × 10⁵
3.22
9.44
97.5% HPD
38.3 × 10⁵
2.590
5.34
28.8 × 10⁵
1.880
1.316
1.206 × 10⁵
7.04
19.33
Tdiv: population divergence time; T2: termination time of gene flow after secondary contact; M1: the number of migrants from C.amherstiae to C.pictus in each generation. M2: the number of migrants from C.pictus to C.amherstiae in each generation.
We sequenced and assembled the genome of C. amherstiae to serve as the reference. The genome assembly of C. amherstiae was 980 Mb in length (genomic coverage = 118.8×) and contained 21, 996 scaffolds (N50 = 399 Kb) (Appendix Table S8).
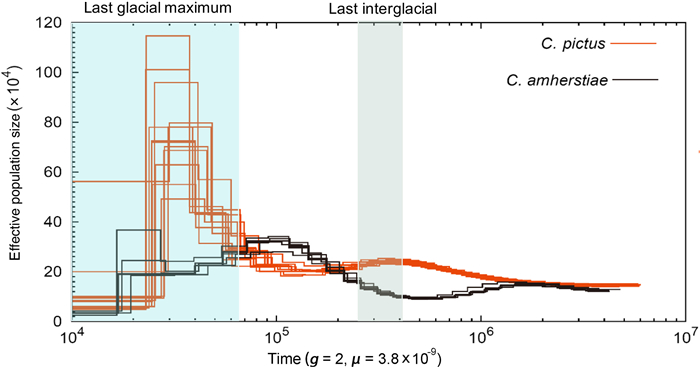
We conducted PSMC analyses to reconstruct the historical demography in both species of Phasianidae spanning the entire Pleistocene period, extending as far back as five million years (Fig. 3). The populations of the two species of Chrysolophus were very similar in their estimated Ne history around 2 Mya, potentially consistent with the divergence time (2.23 Mya for the allopatric population and 1.86 Mya for all of the sampled individuals) estimated by the ABC analyses. At the start of the last ice age (110 thousand years ago, kya), the Ne of C. pictus increased slightly, then gradually decreased during the Last Interglacial (LIG) and ended with a sharp increase before the Last Glacial Maximum (LGM). From a peak of approximately 20 kya, the Ne of C. pictus dropped by a factor of 10 between 20 and 10 kya throughout the LGM. Interestingly, the Ne of C. amherstiae showed an opposite trend to the Ne of C. pictus, decreasing from the last ice age to the beginning of the LIG. We then saw an increase in estimated Ne of C. amherstiae from the LIG to the beginning of the LGM followed by a slight decrease during the LGM.
Figure
3.
Inferred historical population sizes by Pairwise Sequential Markovian Coalescent analysis using 19 whole-genome sequenced individuals, including 13 C. pictus and 6 C. amherstiae for re-sequencing data with an average of 35 × depth. A de novo genome of C. amherstiae was used as the reference genome. The generation time (g) for both species were set to be two years. The mutation rate per generation (μ) was set to 3.8 × 10⁻⁹ per site. (Orange: C. pictus; Black: C. amherstiae). (For interpretation of the references to color in this figure legend, the reader is referred to the Web version of this article.)
Gene flow is conventionally considered as a homogenizing force that can moderate population divergence and impede speciation in the strict allopatric model of speciation. In this study, using multi-locus analysis via ABC, we detected ancient and recurrent gene flow during the speciation process of the Golden Pheasant and Lady Amherst's Pheasant, suggesting that incomplete reproductive isolation has long existed between the two sexually dichromatic species. The genomic data-based PSMC analysis suggested that the population expansion of the Golden Pheasant since the Last Interglacial may have played an essential role in shaping the current hybrid zone and inducing hybridization in the wild.
4.1
Ancient and recurrent gene flow
The evolution of reproductive isolation that underpins the Biological Species Concept allows us to reconsider the role of gene flow in speciation. Most studies implicitly assume that reproductive isolation can be classified into two main categories: pre-zygotic isolation (e.g., assortative mating and sexual selection) and post-zygotic isolation (i.e., low hybrid fitness) (Coyne and Orr, 2004; Nosil, 2012). Gene flow during speciation may strengthen the barrier of reproductive isolation through reinforcement acting on pre-zygotic selection as long as selection is not swamped by migration (Servedio and Kirkpatrick, 1997; Kirkpatrick and Servedio, 1999; Servedio, 2000, 2004).
According to the results of ABC analyses for the allopatric populations of Chrysolophus, there has been long-term gene flow since the initial divergence of C. pictus and C. amherstiae two million years ago (Table 1). The ancient (or early) gene flow with speciation is not unusual in east Asia, especially in the species complexes distributed across the continental Taiwan Island and mainland China, e.g., the Hwamei (Li et al., 2010), bush warblers (Wei et al., 2019) and bamboo-partridges (Wang et al., 2021) or the closely related species that diverged in the eastern edge of the Qinghai-Tibet Plateau, e.g., the long-tailed tits (Wang et al., 2014), eared pheasants (Wang et al., 2017), and leaf-warblers (Zhang et al., 2019). The ecological divergent selection for local adaptation is often considered as the most important factor that promotes ecologically driven speciation in the face of gene flow between species without sexually dichromatic traits. Our results provide a new case in which there was medium-level gene flow (Table 1) between the ancient populations of the two Chrysolophus species with significantly different ecological niches. However, the ecological segregation that limited the gene flow during the glacial periods (see Lyu et al., 2015) may not be the major determinant for the separation of these two sexually dichromatic species.
The occasional hybrid records of Golden Pheasants and Lady Amherst's Pheasants from the hybrid zone (see Deng, 1974; He and Wei, 1993; Shi et al., 2018) and the lower viability of F1 hybrids or backcrosses in captivity (Arrieta et al., 2013) suggests that the current gene flow could be maintained due to incompletely developed pre- and post-zygotic isolation. Our genetic data analysis revealed that when sympatric samples were included, the secondary contact model was better supported than when only allopatric samples were used. The high-level gene flow (Fig. 2) between the two pheasant species in the hybrid zone may have occurred after the LIG (95% HPD: 0.13–1.206 × 10⁵ years before present), which is consistent with the estimation of expansion time based on the ecological niche model (see Lyu et al., 2015) and our PSMC estimation (Fig. 3). However, we could not refuse the predictions of the isolation with migration model with or without the sympatric samples (Table 1) allowing long-term gene flow since their divergence, demonstrating that the scenario of a mixing-isolation-mixing process with recurrent gene flow could have occurred during speciation. The two categories of factors that contributed to the reproductive isolation, i.e., the sexually dichromatic plumage that is usually attributed to the consequences of sexual selection for pre-zygotic isolation (Servedio and Noor, 2003) and ecological segregation that may contribute more to post-zygotic isolation (Funk et al., 2006) were both incompletely developed between the Golden and Lady Amherst's Pheasant. Given the fact that the birds were able to maintain their independence at the species level under divergent male plumage color and recurrent gene flow, we believe that reinforcement selection on both sexual and ecological traits may have played significant roles in the divergence and speciation of the two pheasant species. Further research into the fitness and attractiveness of the backcross or F1 hybrids in the hybrid zone would be helpful to uncover the mechanisms of the selection against gene flow.
4.2
Heterogeneous pattern of population demographics in LGM
It is widely believed that climate change in the Pleistocene provided conditions for speciation (Hewitt, 2000, 2001). Gene flow might increase or decrease with climate change, depending on how climate change affects the habitat (Wasserman et al., 2010; Olsen et al., 2011). The cyclical climate changes in the quaternary period (beginning 2.4 Mya), especially the LIG (between 130 kya and 70 kya) and the LGM (between 21 kya and 18 kya), strongly affected the formation and distribution of species through "expansion-contraction" of their ranges (Hewitt, 2000, 2004; Provan and Bennett, 2008). In East Asia, the impact of the glacial period on the effective population size illustrated a different trend from that of high-latitude regions, such as Europe and North America. For example, advancing ice sheets drove the expansion of polar biota and the contraction of temperate biota to refugia in glaciated regions, such as Europe (Hewitt, 2004; Provan and Bennett, 2008), North America (Shafer et al., 2010), and Antarctica (Fraser et al., 2012). However, East Asia in the subtropical zone was not covered by ice sheets during the Pleistocene (Zhou et al., 2004), and the effective population size showed a contraction during the LIG and expansion during the LGM (Dong et al., 2017). According to the estimate by the PSMC, the population dynamics of C. pictus and C. amherstiae had opposite trends, from which it can be inferred that the LGM and LIG both had different effects on the two species, and the expansion of C. pictus during the recent secondary contact may have provided opportunities for gene exchange (Fig. 3).
4.3
Potential evolutionary processes contributing to reproductive isolation of the two sexually dichromatic pheasants
The evolutionary pattern of Chrysolophus fits the isolation with migration model, indicating that C. pictus and C. amherstiae have had chances to encounter and hybridize during their evolutionary history. However, they have not fused into one species, instead maintaining differentiation in phenotypes and ecological niches in the presence of long-term gene flow. Because the hybrids of the two pheasants are able to interbreed and produce fertile offspring, indicating that the post-zygotic isolation of C. pictus and C. amherstiae has not been fully established, the barrier of reproductive isolation may be reinforced by the promotion of pre-zygotic isolation (shown as sexual selection in our system). Each occurrence of gene flow is equivalent to a secondary contact that increasingly strengthened the pre-zygotic isolation by reinforcement, not only in the divergent male plumage color between the two pheasant species but also through acting on the cryptic divergence of female preference for male color that maintains the speciation under recurrent gene flow.
5.
Conclusions
The results of the study support the scenario of speciation between the Golden Pheasant (C. pictus) and Lady Amherst's Pheasant (C. amherstiae) with cycles of mixing-isolation-mixing due to the dynamics of natural selection and sexual selection in the late Pleistocene. This study provides a research system that can serve as an evolutionary model for testing reinforcement selection in speciation and for exploring the genetic mechanisms responsible for the origin and maintenance of reproductive isolation between sexually dichromatic species.
Author contributions
LD and JZ conceived the study; LD and WL collected the key samples; ZL, JZ and MG performed the study and analyzed data; ZL, JZ and LD drafted the manuscript with help from MG and WL. All authors read and approved the final manuscript.
Data availability
The sequences analysed in this study are available from the corresponding author on reasonable request.
Declaration of competing interest
The authors declare that they have not competing interests.
Acknowledgements
We are grateful to Wanglang National Nature Reserve, Yanyun Zhang, Chao Zhao, Zhixin Zhou and Yiqiang Fu for their help in collecting samples. We thank Bowen Zhang, Yu Hao and Jindan Guo for assistance in statistics. This study was supported by the National Natural Science Foundation of China (No. 31471987). The research protocol was approved by College of Life Sciences, Beijing Normal University: No. CLS-EAW-2013-007.
Anderson, E.C., Thompson, E.A., 2002. A model-based method for identifying species hybrids using multilocus genetic data. Genetics 160, 1217-1229
Arrieta, R.S., Lijtmaer, D.A., Tubaro, P.L., 2013. Evolution of postzygotic reproductive isolation in galliform birds: analysis of first and second hybrid generations and backcrosses. Biol. J. Linn. Soc. 110, 528-542
Beaumont, M.A., 2010. Approximate Bayesian computation in evolution and ecology. Annu. Rev. Ecol. Evol. Syst. 41, 379-406
Beaumont, M.A., Zhang, W., Balding, D.J., 2002. Approximate Bayesian computation in population genetics. Genetics 162, 2025-2035
Beaumont, O., Bonichon, N., Duchon, P., Eyraud-Dubois, L., Larcheveque, H., 2008. A distributed algorithm for resource clustering in large scale platforms. In: Baker, T.P., Bui, A., Tixeuil, S. (Eds), Principles of Distributed Systems. OPODIS 2008. Lecture Notes in Computer Science, vol 5401. Springer, Berlin, pp. 564-567
Bertorelle, G., Benazzo, A., Mona, S., 2010. ABC as a flexible framework to estimate demography over space and time: some cons, many pros. Mol. Ecol. 19, 2609-2625
Butler, J., MacCallum, I., Kleber, M., Shlyakhter, I.A., Belmonte, M.K., Lander, E.S., et al., 2008. ALLPATHS: de novo assembly of whole-genome shotgun microreads. Genome Res. 18, 810-820
Cornejo-Romero, A., Vargas-Mendoza, C.F., Aguilar-Martinez, G.F., Medina-Sanchez, J., Rendon-Aguilar, B., Valverde, P.L., et al., 2017. Alternative glacial-interglacial refugia demographic hypotheses tested on Cephalocereus columna-trajani (Cactaceae) in the intertropical Mexican drylands. PLoS ONE 12, e0175905
Csillery, K., Francois, O., Blum, M.G.B., 2012. Abc: an R package for approximate Bayesian computation (ABC). Method. Ecol. Evol. 3, 475-479
Darriba, D., Taboada, G.L., Doallo, R., Posada, D., 2012. JModelTest 2: more models, new heuristics and parallel computing. Nat. Method. 9, 772
Deng, Q.X., 1974. A natural hybrid of Chrysolophus amherstiae and C. picus. Curr. Zool. 20, 106-107. (in Chinese)
Don, R.H., Cox, P.T., Wainwright, B.J., Baker, K., Mattick, J.S., 1991. “Touchdown” PCR to circumvent spurious priming during gene amplification. Nucleic Acids Res. 19, 4008
Dong, F., Hung, C.M., Li, X.L., Gao, J.Y., Zhang, Q., Wu, F., et al., 2017. Ice age unfrozen: severe effect of the last interglacial, not glacial, climate change on East Asian avifauna. BMC Evol. Biol. 17, 244
Dong, L., Heckel, G., Liang, W., Zhang, Y., 2013. Phylogeography of Silver Pheasant (Lophura nycthemera L.) across China: aggregate effects of refugia, introgression and riverine barriers. Mol. Ecol. 22, 3376-3390
Drummond, A.J., Suchard, M.A., Xie, D., Rambaut, A., 2012. Bayesian phylogenetics with BEAUti and the BEAST 1.7. Mol. Biol. Evol. 29, 1969-1973
Duchen, P., Zivkovic, D., Hutter, S., Stephan, W., Laurent, S., 2013. Demographic inference reveals African and European admixture in the North American Drosophila melanogaster population. Genetics 193, 291-301
Funk, D.J., Nosil, P., Etges, W.J., 2006. Ecological divergence exhibits consistently positive associations with reproductive isolation across disparate taxa. Proc. Natl. Acad. Sci. U. S. A. 103, 3209-3213
He, J.L., Wei, L., 1993. Note on some natural hybrids of Chrysolophus amherstiae and C. picus from Dayi County, Sichuan. Zool. Res. 14, 239-240. (in Chinese)
Hewitt, G., 2000. The genetic legacy of the quaternary ice ages. Nature 405, 907-913
Hewitt, G.M., 2001. Speciation, hybrid zones and phylogeography - or seeing genes in space and time. Mol. Ecol. 10, 537-549
Hewitt, G.M., 2004. Genetic consequences of climatic oscillations in the Quaternary. Philos. T. Roy. Soc. B. 359, 183-195
Hudson, R.R., Kreitman, M., Aguade, M., 1987. A test of neutral molecular evolution based on nucleotide data. Genetics 116, 153-159
Jean-Marie, C., Filipe, S., Mark, A.B., Christian, P.R., Jean-Michel, M., David, J.B., et al., 2008. Inferring population history with DIY ABC: a user-friendly approach to approximate Bayesian computation. Bioinformatics 24, 2713-2719
Kirkpatrick, M., Servedio, M.R., 1999. The reinforcement of mating preferences on an island. Genetics 151, 865-884
Lambeck, K., Chappell, J., 2001. Sea level change through the last glacial cycle. Science 292, 679-686
Lamichhaney, S., Berglund, J., Almen, M.S., Maqbool, K., Grabherr, M., Martinez-Barrio, A., et al., 2015. Evolution of Darwin’s finches and their beaks revealed by genome sequencing. Nature 518, 371-375
Li, H., 2013. Aligning sequence reads, clone sequences and assembly contigs with BWA-MEM. arXiv:1303.3997v2 [q-bio.GN]
Li, H., Durbin, R., 2011. Inference of human population history from individual whole-genome sequences. Nature 475, 493-496
Li, H., Handsaker, B., Wysoker, A., Fennell, T., Ruan, J., Homer, N., et al., 2009. The sequence alignment/map format and SAMtools. Bioinformatics 25, 2078-2079
Li, J.W., Yeung, C.K.L., Tsai, P.W., Lin, R.C., Yeh, C.F., Yao, C.T., et al., 2010. Rejecting strictly allopatric speciation on a continental island: prolonged postdivergence gene flow between Taiwan (Leucodioptron taewanus, Passeriformes, Timaliidae) and Chinese (L. canorum canorum) hwameis. Mol. Ecol. 19, 494-507
Librado, P., Rozas, J., 2009. DnaSP v5: a software for comprehensive analysis of DNA polymorphism data. Bioinformatics 25, 1451-1452
Liu, Y., Liu, S., Yeh, C.F., Zhang, N., Chen, G., Que, P., et al., 2018. The first set of universal nuclear protein-coding loci markers for avian phylogenetic and population genetic studies. Sci. Rep. 8, 15723
Lyu, N., Packert, M., Tietze, D.T., Sun, Y.H., 2015. Uncommon paleodistribution patterns of Chrysolophus pheasants in east Asia: explanations and implications. J. Avian Biol. 46, 528-537
Mayr, E., 1942. Systematics and the Origin of Species from the Viewpoint of a Zoologist. Columbia University Press, New York
Nosil, P., 2012. Ecological Speciation. Oxford University Press, Oxford
Nosil, P., 2008. Speciation with gene flow could be common. Mol. Ecol. 17, 2103-2106
Olsen, J.B., Crane, P.A., Flannery, B.G., Dunmall, K., Templin, W.D., Wenburg, J.K., 2011. Comparative landscape genetic analysis of three Pacific salmon species from subarctic North America. Conserv. Genet. 12, 223-241
Pavlidis, P., Laurent, S., Stephan, W., 2010. MsABC: a modification of Hudson’s ms to facilitate multi-locus ABC analysis. Mol. Ecol. Resour. 10, 723-727
Peng, M.S., Wu, F., Murphy, R.W., Yang, X.J., Zhang, Y.P., 2016. An ancient record of an avian hybrid and the potential uses of art in ecology and conservation. Ibis 158, 444-445
Poelstra, J.W., Vijay, N., Bossu, C.M., Lantz, H., Ryll, B., Muller, I., et al., 2014. The genomic landscape underlying phenotypic integrity in the face of gene flow in crows. Science 344, 1410-1414
R Core Team, 2020. A language and environment for statistical computing. R Foundation for Statistical Computing, Vienna. URL
Rice, W.R., Salt, G.W., 1988. Speciation via disruptive selection on habitat preference: experimental evidence. Am. Nat. 131, 911-917
Rohling, E.J., Fenton, M., Jorissen, F.J., Bertrand, P., Ganssen, G., Caulet, J.P., 1998. Magnitudes of sea-level lowstands of the past 500,000 years. Nature 394, 162-165
Servedio, M.R., 2000. Reinforcement and the genetics of nonrandom mating. Evolution 54, 21-29
Servedio, M.R., 2004. The what and why of research on reinforcement. PLoS Biol. 2, e420
Servedio, M.R., 2011. Limits to the evolution of assortative mating by female choice under restricted gene flow. P. Roy. Soc. B. Biol. Sci. 278, 179-187
Servedio, M.R., 2012. The relationship between sexual selection and speciation. Curr. Zool. 58, 413-415
Servedio, M.R., 2016. Geography, assortative mating, and the effects of sexual selection on speciation with gene flow. Evol. Appl. 9, 91-102
Servedio, M.R., Burger, R., 2014. The counterintuitive role of sexual selection in species maintenance and speciation. Proc. Natl. Acad. Sci. U. S. A. 111, 8113-8118
Servedio, M.R., Kirkpatrick, M., 1997. The effects of gene flow on reinforcement. Evolution 51, 1764-1772
Servedio, M.R., Noor, M.A.F., 2003. The role of reinforcement in speciation: theory and data. Annu. Rev. Ecol. Evol. Syst. 34, 339-364
Shafer, A.B.A., Cullingham, C.I., Cote, S.D., Coltman, D.W., 2010. Of glaciers and refugia: A decade of study sheds new light on the phylogeography of northwestern North America. Mol. Ecol. 19, 4589-4621
Shi, X.Y., Fu, Q., Wang, L., Jiang, Z.Y., Shi, X.G., Li, S., 2018. Note on the natural hybridization of Golden Pheasant (Chrysolophus pictus) and Lady Amherst’s Pheasant (C. amherstiae) in Anzihe Nature Reserve, Sichuan Province. Chinese J Zool. 53, 660-663. (in Chinese)
Tajima, F., 1989. Statistical method for testing the neutral mutation hypothesis by DNA polymorphism. Genetics 123, 585-595
Tamura, K., Stecher, G., Peterson, D., Filipski, A., Kumar, S., 2013. MEGA6: molecular evolutionary genetics analysis version 6.0. Mol. Biol. Evol. 30, 2725-2729
Thompson, J.D., Higgins, D.G., Gibson, T.J., 1994. CLUSTAL W: improving the sensitivity of progressive multiple sequence alignment through sequence weighting, position-specific gap penalties and weight matrix choice. Nucleic Acids Res. 22, 4673-4680
Wang, P., Liu, Y., Liu, Y., Chang, Y., Wang, N., Zhang, Z., 2017. The role of niche divergence and geographic arrangement in the speciation of Eared Pheasants (Crossoptilon, Hodgson 1938). Mol. Phylogenet. Evol. 113, 1-8
Wang, P., Yeh, C., Chang, J., Yao, H., Fu, Y., Yao, C., et al., 2021. Multilocus phylogeography and ecological niche modeling suggest speciation with gene flow between the two Bamboo Partridges. Avian Res. 12, 17
Wang, W., Dai, C., Alstrom, P., Zhang, C., Qu, Y., Li, S.H., et al., 2014. Past hybridization between two East Asian long-tailed tits (Aegithalos bonvaloti and A. fuliginosus). Front. Zool. 11, 40
Wasserman, T.N., Cushman, S.A., Schwartz, M.K., Wallin, D.O., 2010. Spatial scaling and multi-model inference in landscape genetics: martes americana in northern Idaho. Landscape Ecol. 25, 1601-1612
Wei, C., Dong, L., Li, S.H., Alstrom, P., Liu, Y., Xia, C., et al., 2019. From the Himalayas to a continental Island: Integrative species delimitation in the Brownish-flanked Bush Warbler Horornis fortipes complex. Mol. Phylogenet. Evol. 131, 219-227
Zhang, D., Tang, L., Cheng, Y., Hao, Y., Xiong, Y., Song, G., et al., 2019. “Ghost Introgression” as a cause of deep mitochondrial divergence in a bird species complex. Mol. Biol. Evol. 36, 2375-2386
Zhang, G., Li, C., Li, Q., Li, B., Larkin, D.M., Lee, C., et al., 2014. Comparative genomics reveals insights into avian genome evolution and adaptation. Science 346, 1311-1320
Table
1.
Population parameters of two datasets under isolation with migration model and secondary contact model estimated by ABC analysis.
Allopatric samples
All samples
Isolation with migration model
Isolation with migration model
Secondary contact model
Tdiv
M1
M2
Tdiv
M1
M2
T2
M1
M2
2.5% HPD
4.26 × 10⁵
0.184
0.254
4.57 × 10⁵
0.116
0.473
0.031 × 10⁵
0.668
2.14
Median
22.8 × 10⁵
0.929
1.70
19.3 × 10⁵
0.602
1.774
0.130 × 10⁵
2.92
8.97
Mean
22.3 × 10⁵
1.054
2.00
18.6 × 10⁵
0.713
1.054
0.258 × 10⁵
3.22
9.44
97.5% HPD
38.3 × 10⁵
2.590
5.34
28.8 × 10⁵
1.880
1.316
1.206 × 10⁵
7.04
19.33
Tdiv: population divergence time; T2: termination time of gene flow after secondary contact; M1: the number of migrants from C.amherstiae to C.pictus in each generation. M2: the number of migrants from C.pictus to C.amherstiae in each generation.

 DownLoad:


 Email Alerts
 RSS Feeds