Key Laboratory of the Zoological Systematics and Evolution, Institute of Zoology, Chinese Academy of Sciences, Beijing, 100101, China
b.
Institute of Zoology and Parasitology Named After Pavlovsky E.N, Academy of Sciences of the Republic of Tajikistan, P.O. Box 70, Dushanbe, 734029, Tajikistan
c.
University of Chinese Academy of Sciences, Beijing, 100049, China
d.
College of Life Sciences, Westlake University, Hangzhou, 310024, China
e.
Department of Biology, Faculty of Natural and Computational Sciences, Assosa University, P.O. Box 18, Assosa, Ethiopia
f.
National Animal Collection Resource Center, Institute of Zoology, Chinese Academy of Sciences, Beijing, 100101, China
g.
Center for Excellence in Animal Evolution and Genetics, Chinese Academy of Sciences, Kunming, 650223, China
The avifauna in Tajikistan has been widely studied for the last century, but specific work on species richness pattern along elevation gradients in Tajikistan is rarely investigated. Here, we reported the first study of bird species richness (BSR) in the high-altitude mountain systems (Tien Shan and Pamir-Alay) of Tajikistan which are very sensitive to the recent climate changes. We aim to explore the relationship of BSR pattern with elevation gradient and to determine the potential drivers underlying the patterns. We collected occurrence data from field surveys, published articles, and open access websites to compile a list of bird species along elevational gradients across the whole country. The BSR was counted by 100 m elevational bands ranging from 294 m to 5146 m. The patterns of BSR were calculated separately for five groups: all breeding birds, Passeriformes, Non-Passeriformes, large elevational range species, and small elevational range species. We calculated ecological and climatic factors of planimetric area, mid-domain effect (MDE), habitat heterogeneity (HH), mean annual temperature (MAT), temperature annual range (TAR), annual precipitation (AP), normalized difference vegetation index (NDVI), human influence index (HII), and human disturbance (HD) in each elevational band. A combination of polynomial regression, Pearson's correlation, and general least squares model analyses were used to test the effects of these factors on the BSR. A unimodal distribution pattern with a peak at 750–1950 m was observed for all breeding birds. The similar pattern was explored for Passeriformes and Non-Passeriformes, while species with different elevational range sizes had different shapes and peak elevations. For all the breeding birds and Passeriformes, BSR was significantly related to spatial, climate and human influence factors, while BSR of Non-Passeriformes positively correlated with all the given factors. First, second and fourth range classes of birds were significantly correlated with human influence factors. Moreover, large-ranged species had positive correlations with the mid-domain effect and weakly with habitat heterogeneity. We found that area, MAT and AP were the main factors to explain the richness pattern of birds, and the species richness increases with these three factors increasing. Multiple factors such as area and climate explain 84% of the variation in richness. Bivariate and multiple regression analyses revealed a consistent influence of spatial and climate factors in shaping the richness pattern for nearly all bird groups.
Mountains serve as major hotspots for global biodiversity (Myers et al., 2000), yet understanding mechanisms underlying the development patterns of diversity has been a main challenge for ecologists since the time of Alexander von Humboldt (Rahbek et al., 2019a, b). Mountains cover only 25% of terrestrial land areas but are home to 87% of the world's land vertebrates (Fjeldså et al., 2012; Rahbek et al., 2019a). Nevertheless, mountain species are exposed to a large number of threats caused by climate change and human activities. Understanding mechanisms underlying patterns of species diversity in mountains would aid in comprehending how species respond to climate change and human activities, and thus is beneficial in developing conservation plans (Hunter et al., 1993).
Species richness patterns along elevational gradients have been widely studied since the last century. For example, some studies have found that species richness gradually decreases along elevational gradient (McCain, 2007, Quintero and Jetz, 2018), being similar to that species richness decreases along a latitudinal gradient from the tropics to the poles (Stevens, 1992). By comparing large amounts of bird distribution data along elevational gradients across the globe, McCain (2009) categorised the pattern of species richness along elevational gradients into four patterns: decreasing, low plateau, low plateau with a mid-peak, and mid-elevation peak. In the past decades, almost half of the studies reported that a hump-shaped pattern is the most common type of elevational richness pattern for montane species (Rahbek, 1995, 2005), while others have suggested species richness decreases with increasing elevation (Mallet-Rodrigues et al., 2015). Recently, Quintero and Jetz (2018) suggested that a low elevation plateau is the most common pattern within mountain systems after examining the global elevational species richness of birds.
Currently, several hypotheses have been proposed to explain species richness patterns along elevational gradients, which can generally be grouped into four categories (Table 1): (1) spatial constraint hypotheses, e.g., species-area relationship (SAR) (Rosenzweig, 1995) and geometric constraint hypothesis, e.g., mid-domain effect (MDE) (Colwell and Lees, 2000); (2) habitat heterogeneity (HH) hypothesis (Bazzaz, 1975, MacArthur and MacArthur, 1961); (3) water-energy constraint hypotheses (Evans et al., 2005); and (4) human disturbance hypothesis (Rodríguez-Rodríguez and Bomhard, 2012).
Table
1.
Hypotheses and the mechanisms that explain high species diversity.
Richness is positively related to land surface area
Habitat heterogeneity hypotheses
Complex and diverse habitats can provide more niches and different ways to use natural resources and thus increase the diversity of species (MacArthur and MacArthur, 1961; Bazzaz, 1975)
Richness is positively related to the habitat heterogeneity
Richness is related to water-energy predictors (temperature, precipitation, productivity)
Human disturbance hypothesis
Virgin and undisturbed natural places have more species diversity due to the absence of anthropogenic interventions and human influence (Rodríguez-Rodríguez and Bomhard, 2012)
Richness is negatively related to Human Influence Index
Spatial constraint hypotheses which include area and mid-domain effect (MDE) are usually associated with available niches along elevational bands and geometric boundaries (e.g., base and top of the mountain) on species distribution within a bounded domain (Wilson and MacArthur, 1967; Colwell and Lees, 2000; McCain and Grytnes, 2010). These two factors explain a numerous proportion of the elevational variation in species richness (Brehm et al., 2007; Tjørve and Tjørve, 2017). HH hypothesis holds the view that complex and diverse habitats can provide more niches and different ways to use natural resources and thus increase the number of species (MacArthur and MacArthur, 1961; Bazzaz, 1975). Water and energy can limit diversity in a region by their effects on species physiological tolerance and food resources (productivity) (O'Brien, 1998; Evans et al., 2005; Begon et al., 2006). Generally, warm and humid environments have higher net primary productivity, which can provide more food and support more species. Previous studies on birds have reported a positive relationship existing between normalized difference vegetation index (NDVI) and species richness (Hurlbert and Haskell, 2003; Lee et al., 2004; Hawkins et al., 2005; Koh et al., 2006; Wu et al., 2013a). The human disturbance hypothesis presumes that human activities are the main causes of decline in regional species richness (Fraschetti et al., 2001; Inostroza et al., 2016). Over the last century, the effects of humans on environment have increased substantially due to overpopulation, pollution, burning fossil fuels, and deforestation (Rodríguez-Rodríguez and Bomhard, 2012), leading to current rate of extinction being about 1000 times the background rate of extinction (Pimm et al., 2014). Accordingly, it is crucial to take human disturbance (HD) into account when evaluating the drivers of regional species richness patterns.
Several studies have described bird species richness (BSR) along elevational gradients in tropical and subtropical regions, but only a few studies have focused on temperate zones (Rahbek, 1995; Sergio and Pedrini, 2007; Thakur, 2013; Wu et al., 2013a, b, 2014). In recent, Quintero and Jetz (2018) proposed that species richness along an elevational gradient in different montane regions affects assemblages of birds in different ways, due to the diversification rates and the role of the combined area and elevational extent of a particular mountain region. The temperate Tajikistan has a unique and diverse avifauna comparable with neighboring countries in the region. Although the avifauna in Tajikistan has been well reported in the last century, the study of species richness patterns along elevational gradients in these mountain systems has not been conducted.
In this study, we examined the patterns of bird species richness along elevational gradients in Tajikistan. We first described the species richness pattern along elevational gradient for all breeding birds, Passeriformes, and Non-Passeriformes. We also described the elevational species richness patterns using birds categorised by their elevational range size. Subsequently, we examined relationships between species richness and explanatory factors related to spatial and water-energy constraints, and anthropogenic interventions were evaluated to test spatial constraint hypotheses, habitat heterogeneity hypothesis, water-energy constraint hypotheses and human disturbance hypothesis. We aimed to document the species richness of birds along the elevational gradient in Tajikistan and examine the mechanisms underlying the patterns and answer the following questions. (1) What are the patterns of bird species richness along elevational gradient? (2) Which factors shape the species richness patterns of birds along elevational gradient? This study is key to understanding the causes of and processes involved in bird species diversity in the Central Asian region and offers scientific guidelines for making a biodiversity conservation plan in the diversity hotspot.
2.
Methods and materials
2.1
Study area
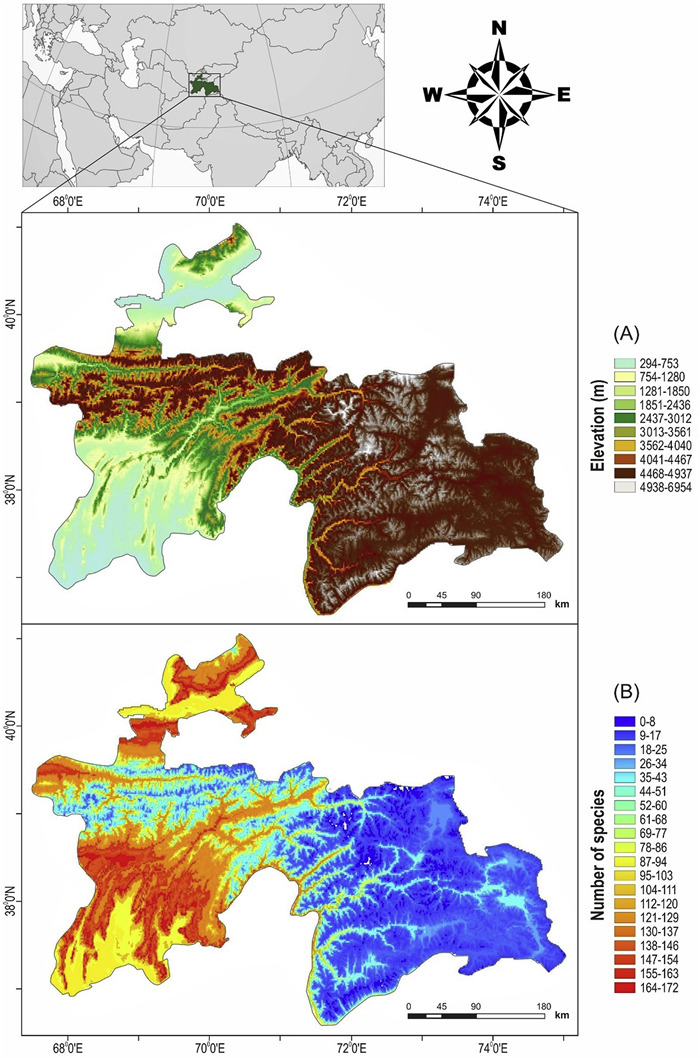
Tajikistan is located in the southern region of a global biodiversity hotspot, the mountains of Central Asia (Marchese, 2015), which covers a subdivision of the Palearctic zone, Asia, bioregion of the Central Asia – Iranian Plateau (Olson et al., 2001). The region is characterised by the mountains of the Pamir-Alay and Tien Shan Mountain ranges, and more than 50% of the country stands at over 3000 m a.s.l. (Fig. 1). Mountains occupy 93% of the area of Tajikistan, and only less than 7% has arable land. Two major areas of lowlands exist: part of the Fergana Valley in the north, the Amu Darya River valley including the southern Kofarnihon and Vakhsh river valleys in the south. The geographical location of the country is closely associated with properties of the natural environments such as having dry, continental climate, an uneven distribution of water resources, and the predominance of arid and semi-arid landscapes (Kurbоnov and Saidov, 2013). Consequently, the climate changes drastically with elevation. Natural zones transit from dry subtropics to alpine glaciers. These zones include flat and low mountains (300–1600 m a.s.l.); mid- to high-elevation mountains (1600–2800 m a.s.l.); alpine regions (2800–4500 m a.s.l.); and nival areas (4500 m a.s.l.). Accordingly, various ecosystems are represented in Tajikistan, preserving a large diversity of plant and animal species with a rich landscape and wildlife community (Safarov, 2003; Nowak et al., 2015).
Figure
1.
Topographic map (A) and species richness map of breeding birds (B) in Tajikistan.
Occurrence data reflecting the elevational distribution of species were mainly collected during joint field trips (under the "Agreement of Collaborative Research on Animal Diversity in The Republic of Tajikistan") between the Institute of Zoology, Chinese Academy of Sciences, and the Institute of Zoology and Parasitology Academy of Sciences of Tajikistan (from 2013 to 2016). We collected data in the summer season from May to August in each year. In order to collect comprehensive data of all the birds distributed in the country, we focused our field surveys and collecting bird's specimens in different kinds of geographical locations, especially in protected areas, national parks and densely populated bird areas (near lakes, rivers, forests, etc.). We used line transects and mist nets to observe and catch birds, respectively. We conducted our field surveys in 27 different locations covering the whole country (Appendix Fig. S1). Additionally, to collect observation points for all breeding birds, we assembled data from the published literature and public databases such as the Global Biodiversity Information Facility (GBIF), eBird, and other sources (Appendix List S1). Most of the data were recorded from 1997 to 2017. For some occurrence points without detailed geographical coordinates, we manually annotated coordinates based on a location name, using available sources such as Google Earth, gazetteers, and topographical maps of Tajikistan. Finally, we removed duplicated data by referring to the duplicated occurrence data (e.g., some birdwatchers uploaded identical data for a single observation into two different sources, especially GBIF and eBird).
2.3
Elevational species richness
We sampled species based on a bird checklist in Tajikistan of Koblik and Arkhipov (2014) and corrected the scientific names following the International Ornithological Congress World Bird List v 9.2 (Gill and Donsker, 2019). For the occurrence points with latitudinal and longitudinal coordinates, we first extracted the elevation data for each point based on the EarthEnv-DEM90 digital elevational model (DEM) data with a resolution of 90 m (Robinson et al., 2014). Second, we estimated the elevational range for each species based on the minimum and maximum elevations from all occurrence points and elevational ranges from publications. Species richness for these interpolated ranges was then calculated based on the number of bird ranges occurring in each 100 m elevational band (from 200 m to 5200 m; McCain, 2009; Wu et al., 2013a; Abebe et al., 2019). We assume that each species presents in every 100-m interval between its upper and lower elevation limits. For instance, we have collected only two available data of Corvus frugilegus, with its elevation one at 300 m and second data at 1500 m, therefore we can assume that this species can be present in each elevation band of 300, 400, 500 m and so on up to 1500 m (Vetaas and Grytnes, 2002; Bhattarai and Vetaas, 2006). Interpolation is important to overcome some limitations of under-sampling and is regarded as valid for vagile species and allows methodological consistency because most published accounts have assumed range continuity (McCain, 2009; Wu et al., 2013a; Sam et al., 2019). Furthermore, all breeding bird species were divided into four groups based on their elevational range size using quartile breaks classification: first (200–1300 m, n = 133), second (1301–2600 m, n = 55), third (2601–3900 m, n = 28) and fourth (3901–5200 m, n = 15) range size species following the methods of Lees et al. (1999), Jetz and Rahbek (2002), and others. We also separated all breeding birds into passerines and non-passerines to compare the different patterns of each group along elevational gradients. In order to test the robustness of elevational patterns of species richness, we also repeated the analyses based on 300 m and 500 m band sizes along the elevational gradients.
2.4
Predictors
Land surface area in Tajikistan was calculated using the EarthEnv-DEM90 DEM with a resolution of 90 m (Robinson et al., 2014). The DEM data were used to estimate surface area in each grid size so that the total surface area could be calculated by summarizing the number of square kilometres in each elevational band using the zonal tool in ArcGIS 10.2. To estimate geometric constraints in elevational bands, the average MDE and its 97.5% quantiles were calculated using the "rangemodelR" package in R software, version 3.5.0 (R Development Core Team, 2018) based on the assemblage of species in each band (Colwell et al., 2008). Habitat heterogeneity (HH) was summarized using the Shannon diversity index following Turner et al. (2001) based on habitat types (richness) and their areas (abundance). Here, habitat types and their areas in each elevational band were estimated in the ArcGIS 10.2 using the Globcover 2009 products from the European Space Agency GlobCover Portal (http://due.esrin.esa.int/page_globcover.php). These global cover data have a 250 m resolution and include 20 landcover types.
To estimate climate along elevational gradients, the mean annual temperature (MAT), annual precipitation (AP), and temperature annual range (TAR) in each 100-m elevational band were calculated based on monthly records from Climatologies at High Resolution for the Earth's Land Surface Areas (CHELSA) with 30-arc seconds resolution (Karger et al., 2017). The TAR is the difference between the maximum temperature in the warmest month and minimum temperature in the coldest month. The NDVI was used to represent the productivity of vegetation in each elevational band. The NDVI data were downloaded from MODIS data products (https://modis.gsfc.nasa.gov/data/dataprod).
The human influence index (HII) from the Last of Wild Project, Version 2 (LWP-2) (https://sedac.ciesin.columbia.edu) was used to estimate the human influence in each elevational band. In addition, proportions of artificial surfaces and cultivated land in each elevational band were calculated based on Globcover 2009 products from the European Space Agency GlobCover Portal (http://due.esrin.esa.int/page_globcover.php) to quantify human disturbance (HD) following the method of Zhang et al. (2013).
2.5
Data analyses
Firstly, we performed polynomial regressions between species richness and elevation (first-, second-, and third-order, richness as a function of elevation) to assess the form of elevational distribution patterns of species richness for each species group. Then, bivariate generalized least squares (GLS) regressions were performed to find the best fit relationships between species richness and predictors based on the Akaike Information Criterion (AIC). Finally, multiple general least squares (GLS) regressions were used to explore multivariate explanations for testing how these explanatory variables predicted the patterns of species richness. For the multiple regressions, we used Neyman–Pearson correlation to examine the relationships among predictor variables (area, MDE, HH, MAT, TAR, AP, NDVI, HII, HD), and then removed variables which had high correlation within each environmental category from the model. At the same time, we tested for multi-collinearity based on a variance inflation factors (VIF) and variables with VIF > 4 were also removed from the model to reduce multi-collinearity. At the end we have got several variables which were not correlated with each other in Neyman–Pearson's test and had VIF ≤ 4. Then we run multiple GLS with different combinations (of those variables) taking spatial autocorrelation in account. Based on Akaike information criterion (AIC) value and coefficient of determination (R2), the model with lowest AIC and high R2 were included in the final multiple GLS. The same steps were performed for other species groups as well. The results of all the steps of the multiple GLS regression are given in the Appendix. The models were evaluated using maximum likelihood estimation with the nlme package (Pinheiro et al., 2007) in R software, version 3.5.0 (R Development Core Team, 2018). Spatial dependence (i.e., spatial autocorrelation) was checked by the variogram function. By plotting a semivariogram, the semi-variance was checked, which is a measure of the spatial dependence between two observations as a function of the distance between them (Karl and Maurer, 2010). The normality of the model residuals was checked using the QQplot function in the ggplot2 package in R software (Wickham, 2009). We also checked the adequacy of the correlation structure and for residual homogeneity of the models.
3.
Results
3.1
Species occurrence records
From the whole country, we found 385 bird species belonging to 18 orders, 57 families, and 162 genera. For these 385 species, we have 231 breeding birds' data available. In the data, a total of 130 species belonging to 70 genera and 24 families were Passeriformes, and 101 species belonging to 17 orders, 24 families, and 70 genera were Non-Passeriformes. The list of 231 species (the final elevational range data matrix), and the data sources are provided in Appendix List S1.
3.2
Elevational patterns of species richness and predictors
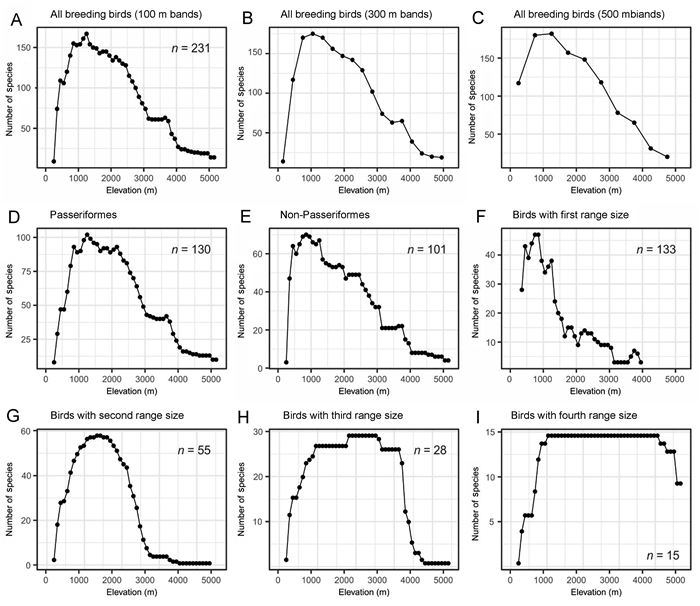
Generally, breeding birds are mainly distributed at low elevations in Tajikistan (Fig. 1). The species richness data showed a hump-shaped pattern along the elevational gradient with a peak at low elevation (750–1950 m, Fig. 2A). This pattern is consistent with the results based on 300 m and 500 m elevational bands (Fig. 2B and C). At the lowest elevation of 250 m in Tajikistan, the BSR for all breeding birds was represented by 9 species; then, it sharply increased by ca. 26 species/100 m up to 850–1250 m, after which the SR decreased monotonically. The upper limit of the SR was 5150 m elevation, represented by 14 species; above this elevation, there were no species; thus, no SR was available to be recorded (the highest elevation in Tajikistan is 7495 m a.s.l.). The diversity patterns of Passeriformes and Non-Passeriformes were also hump-shaped, with peaks of richness at different elevations. Passeriformes showed a broader pattern with a peak at 850–2450 m (Fig. 2D), while the pattern of richness for Non-Passeriformes was narrower as it shifted to the bottom of the gradient, with a peak at 450–1450 m (Fig. 2E). Birds with small ranges showed a sharp decreasing pattern of richness from 850 m to 1650 m, followed by a steady decrease with an increase in elevation (Fig. 2F). Species richness in the second and third range size classes was generally hump-shaped, but for the second range size, the pattern looked like a parabola with a peak at 1450–1850 m (Fig. 2G), whereas the third range size showed a high elevation plateau from 1150 m to 3650 m, followed by a sharp decrease towards the higher elevations (Fig. 2H). Richness of the species with the largest range size peaked over a wide elevational plateau from low to high elevations (1150–4450 m; Fig. 2I).
Figure
2.
Elevational distribution patterns of species richness for (A, 100 m; B, 300 m; C, 500 m) all breeding birds; (D) Passeriformes; (E) Non-Passeriformes, and (F) birds in the first (smallest), (G) second, (H) third, and (I) fourth (largest) elevational range classes, respectively.
The polynomial regression of the species richness pattern along the elevational gradients showed a significantly positive relationship with elevation (P < 0.01). Following the rule of the lowest AIC, third-order polynomial is better to predict species richness (Appendix Table S2). A quadratic or cubic function of elevation had a better fit than a simple linear regression on elevation.
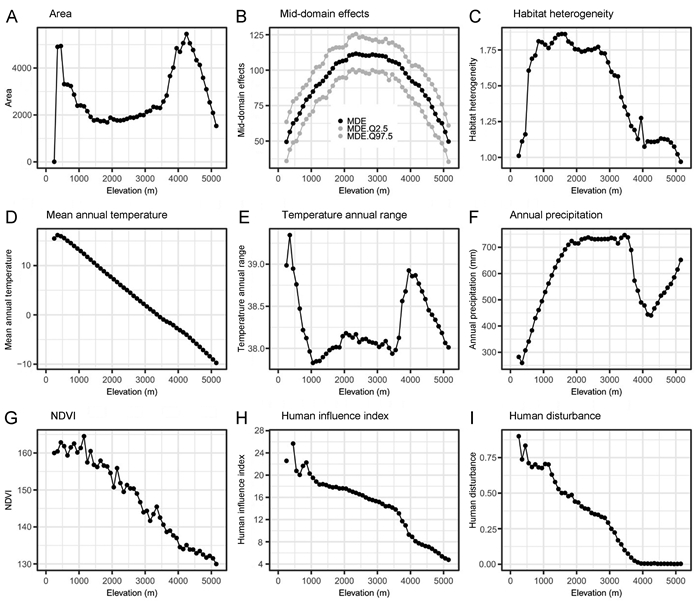
The elevational-area pattern showed two peaks, one at low elevation with a narrowed range (300–500 m), and the second peak having a significant increase at 4200 m, as the Pamir-Alay Plateau has a significant influence on the area in Tajikistan (Fig. 3A). The elevational pattern of the MDE was ideally hump-shaped with a peak at mid elevation (Fig. 3B). The HH pattern was generally hump-shaped with a high elevation plateau (Fig. 3C). The MAT showed a monotonically decreasing pattern with increasing elevation (Fig. 3D). Based on simple linear regression (r2 = 0.997, P < 2.2e–16), MAT decreased with elevation in a rate of −0.586 ℃/100 m in Tajikistan. The TAR generally showed a similar pattern with the elevational-area pattern (compare Fig. 3A and E). In addition, AP showed a hump-shaped pattern with a gradual increase above 4200 m (Fig. 3F). The NDVI showed a monotonically decreasing pattern with increasing elevation (Fig. 3G) in temperate regions. The patterns for the HII and HD were similar along the elevational gradient (Fig. 3H and I). Both showed a decreasing tendency, although HD decreased more substantially with elevation rising from 450 m to 3950 m, while HII decreased until the last elevational band at 5150 m.
Figure
3.
Elevational pattern in Tajikistan of (A) area; (B) mid-domain effect; (C) habitat heterogeneity; (D) mean annual temperature; (E) temperature annual range; (F) annual precipitation; (G) normalizeddifferencevegetationindex; (H) human influence index, and (I) human disturbance.
3.3
The relationships between species richness and predictors
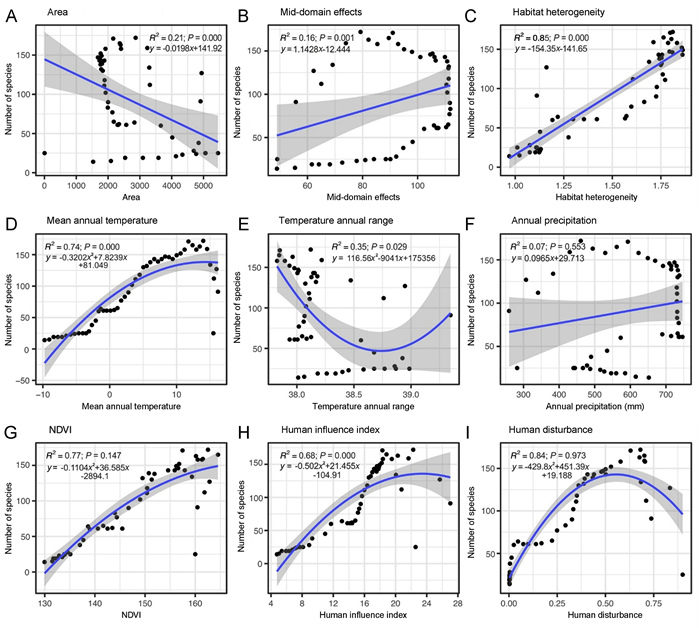
Results of bivariate GLS regression for species richness of all breeding birds against each predictor suggested that species richness could be significantly fitted by a simple linear regression (Appendix Table S2). Based on the P-value and R2 of the bivariate GLS regression, species richness was positively associated with spatial constraints, climate and human influence. In particular, species richness was well predicted by HH, MAT, and HII than other predictors (Fig. 4; Appendix Table S3). Multiple GLS regression analyses of BSR of all species groups (Passeriformes, Non-Passeriformes, and four range size classes) against the nine environmental factors showed similar relationships with these factors (Table 3) among those species' groups. Area, temperature, precipitation, and human-induced disturbance (HII, HD) were the most influential factors for most of the patterns of species richness. In addition to these factors, MDE was also a main factor to predict species richness for the third and fourth range size groups (Table 3).
Figure
4.
The relationships between bird species richness and environmental factors along the elevational gradient in Tajikistan (bird species richness represented for all breeding birds). (A) area; (B) mid-domain effect; (C) habitat heterogeneity; (D) mean annual temperature; (E) temperature annual range; (F) annual precipitation; (G) normalizeddifferencevegetationindex; (H) human influence index, and (I) human disturbance.
Table
3.
Estimates of the multiple GLS model of the relationship between species richness of all breeding birds, Passeriformes, Non-Passeriformes and predicted variables in Tajikistan.
Species groups
Variables
Estimate
SE
t-value
P-value
R2
All breeding birds
Area
0.01112
0.00122
9.136592
0.0000***
0.8487
AP
0.15547
0.04117
3.775871
0.0005***
MAT
4.25372
3.63228
1.171089
0.2476
Passeriformes
Area
0.003521
0.00075
4.665392
0.0000***
0.8412
AP
0.077082
0.02479
3.109595
0.0032**
MAT
1.714625
2.20579
0.777329
0.4409
Non-Passeriformes
Area
0.00772
0.000652
11.840427
0.0000***
0.8249
AP
0.08261
0.024218
3.411189
0.0014 **
MAT
2.31335
1.024077
2.258957
0.0287*
1st range size
Area
0.0033
0.00181
1.840596
0.0750*
0.8955
TAR
−33.0177
5.75236
−5.739844
0.0000***
AP
−0.0945
0.02108
−4.481573
0.0001***
HII
1.0812
0.43688
2.474727
0.0188***
2nd range size
Area
0.0028
0.00074
3.818336
0.0004***
0.4250
TAR
−8.7881
3.14572
−2.793655
0.0077**
HII
0.7748
0.33769
2.294424
0.0266*
3rd range size
Area
0.00220
0.000369
5.961578
0.0000***
0.8581
MDE
1.11785
0.292032
3.827836
0.0004***
MAT
0.90155
0.458021
1.968366
0.0552*
AP
0.03264
0.014076
2.318589
0.0250*
4th range size
Area
0.000797
0.0001790
4.452443
0.0001***
0.8910
MDE
0.733039
0.1464837
5.004237
0.0000***
AP
0.014024
0.0034167
4.104511
0.0002***
HII
−0.196024
0.0730349
−2.683984
0.0101*
Abbreviations: mid-domain effect, MDE; habitat heterogeneity, HH; mean annual temperature, MAT; temperature annual range, TAR; annual precipitation, AP; normalizeddifferencevegetationindex, NDVI; human influence index, HII, and human disturbance, HD; standard error, SE. *P < 0.01, **P < 0.001, ***P < 0.0001.
4.1
Species richness patterns of birds along the elevational gradient
Our study reveals that bird species richness along the elevation in Tajikistan is hump-shaped, which is consistent with previous elevational diversity patterns (Rahbek, 2005; McCain, 2009; Price et al., 2014; Pan et al., 2016; He et al., 2019). The peaks of the elevational species richness for the three different elevational bands (100 m, 300 m, 500 m; Fig. 2A) are closer to the bottom of the gradient, which confirms the previous studies of a parallel pattern with the species richness peaking at the bottom of the gradient (Lee et al., 2004; McCain, 2009; Wu et al., 2013a; Pan et al., 2016, 2019; He et al., 2019). McCain and Grytnes (2010) postulated that such a pattern may be caused by differences in sampling, the scale of a study, or post-sampling treatment of data. Our study focuses on a regional scale falling into two broad categories: (1) local scale (local or alpha diversity), which are sampled from the base to the peak of a single mountain within 1–2 years and (2) regional scale (regional or gamma diversity), which includes data compilation from sight and capture records, specimen records and field notes for an entire mountain or mountainous region (Appendix Fig. S3 a1, a2 and a3). The results could be heavily influenced by the greater size of the area at the base of the mountains when compared with the more limited area available near the tops of mountains, leading to a greater estimated richness at lower elevations (McCain and Grytnes, 2010). Besides the scale effect, our results also suggest that species richness at the lowest elevations may be driven by the high amplitude of annual temperatures, low humidity, and low precipitation. Although there is a high value of productivity (NDVI) at the lower elevations, it is simply represented by semi-savannas and tugay (a form of riparian woodland) (Appendix Figs. S4 and S5; Treshkin et al., 1998). More than 50% of the country stands at above 3000 m, and the average temperature in the temperate zone (the high mountains) in July is between 9.7 ℃ and 13.5 ℃. Therefore, climate and spatial factors would drive the highest species richness of birds in the low-mid elevation in Tajikistan.
4.2
Integrative factors shape the richness pattern
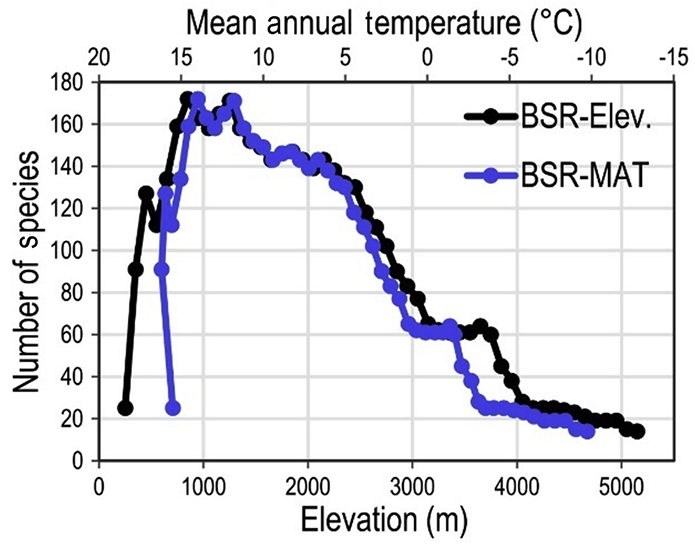
In our study, climatic variables, temperature (MAT, TAR), and precipitation (AP) exhibited a strong association on species richness patterns along elevational gradient (Elsen et al., 2017). The relationship of climatic variables was stronger with small-ranged birds than that of the large-ranged species (Appendix Table S4). This result is consistent with previous studies that the contemporary climate has strong relationships with richness patterns of small-ranged species (Ruggiero and Hawkins, 2008; Pandey et al., 2020). Climatic variables are considered to be a significant factor affecting avian richness, as they set limits on species distributions depending upon their physiological tolerances (He et al., 2019). Temperature changes drastically with elevation in Tajikistan (Nobis and Nowak, 2011). Generally, species richness decreased with decreasing temperature along the elevational gradient in Tajikistan. Moreover, the pattern of richness-temperature (MAT) is almost identical to the pattern of richness-elevation (Fig. 5), because temperature is strongly correlated with elevation (r2 = 0.997, P < 2.2e-16). This confirms the prediction of decreasing richness with increasing elevation (McCain and Grytnes, 2010).
Figure
5.
Elevational (Elev.) pattern of bird species richness (BSR) and mean annual temperature (MAT) in Tajikistan.
The elevational pattern of HII and HD in Tajikistan showed a monotonically decreasing pattern with higher values at lower elevations. Human disturbance tends to have a greater influence in the lowlands, while it monotonically decreases with increased elevation (Nogués-Bravo et al., 2008), as demonstrated in our results. We found a significant correlation between human influence (HII, HD) and BSR for most groups of birds (Fig. 4; Table 2; Appendix Tables S3 and S4). Human disturbance might be the cause of a decrease in SR as a result of human activities, changing natural landscapes, urbanization, and others (Murphy and Romanuk, 2014; Pandey et al., 2020). However, the elevation bands with higher SR in our study have also higher values of human influence (compare Fig. 2A with Fig. 3H and I), which reveals a positive interaction between human influence and BSR.
Table
2.
Pearson's correlation coefficients for the nine variables used to predict the species richness of birds in Tajikistan.
Area
MDE
HH
MAT
TAR
AP
NDVI
HII
MDE
−0.32250 (0.02236)
HH
−0.57639 (1.184e–05)
0.58858 (6.937e–06)
MAT
−0.30588 (0.03075)
0.03171 (0.8269)
0.65140 (3.008e–07)
TAR
0.70265 (1.285e–08)
−0.46550 (0.00065)
−0.63336 (7.96e–07)
−0.05423 (0.7084)
AP
−0.60746 (2.9e–06)
0.78150 (2.12e–11)
0.46627 (0.00064)
0.24010 (0.09305)
−0.77107 (5.714e–11)
NDVI
−0.39964 (0.00403)
0.09763 (0.5)
0.72789 (2.106e–09)
0.98118 (< 2.2e–16)
−0.18797 (0.1911)
−0.11735 (0.417)
HII
−0.33623 (0.01697)
0.13179 (0.3616)
0.62659 (1.129e–06)
0.96462 (< 2.2e–16)
−0.05881 (0.685)
−0.13638 (0.345)
0.94798 (< 2.2e–16)
HD
−0.37294 (0.00764)
−0.09528 (0.5104)
0.60465 (3.313e–06)
0.97514 (< 2.2e–16)
−0.08179 (0.5723)
−0.26711 (0.06077)
0.96607 (< 2.2e–16)
0.93001 (< 2.2e–16)
Pearson's "r" is in bold and the P-value is in brackets. Abbreviations: mid-domain effect, MDE; habitat heterogeneity, HH; mean annual temperature, MAT; temperature annual range, TAR; annual precipitation, AP; normalized difference vegetation index, NDVI; human influence index, HII, and human disturbance, HD.
Except for birds with large ranges, the results of individual regression models shows that HH is one of the chief predictors of the species-elevation relationship for all the bird groups (Fig. 4C). It is expectable that a larger area would have more habitat types and high HH, both of which are generally positively correlated with SR (Báldi, 2008; Pan et al., 2019). Our study obtains comparable results with Pan et al. (2016) for the relationship between BSR and HH—a positive relationship of HH with all the bird groups except for birds with small or large ranges because large-ranged birds are relatively more adaptable and can adapt to more habitat types.
We did not find support for area as a strong causal factor for all the groups' elevational richness in bivariate regressions, confirming a recent finding that area is not a significant environmental factor (McCain, 2009) but plays as a proxy of the other fundamental factors such as greater heterogeneity and different habitats in determining the SR (Wilson and MacArthur, 1967; Báldi, 2008). In our analyses, area has explained only 19% of the variation of species richness for all breeding birds and only 7% for Non-Passeriformes (Appendix Table S3). The MDE as well as area shows little (e.g., for Passeriformes) to no support for most of the species' groups in both bivariate regression (Appendix Table S2) and multi-model analyses (Table 2), apart from the birds with large range sizes, which are positively correlated with MDE (Table 3). This is consistent with many other studies on elevational SR (Colwell et al., 2004; Pan et al., 2016, 2019; He et al., 2019; Liu et al., 2019). He et al. (2019) inferred that species with large ranges are physiologically more tolerant to the gradients of climate (e.g., temperature, precipitation) than species with small ranges; hence, species with large ranges are more constrained and more likely to overlap within a bounded domain than species with smaller ranges that are more likely to be dependent on environmental factors and independent of boundary constraints (Colwell and Hurtt, 1994; Colwell and Lees, 2000).
The overall BSR patterns are hump-shaped with a peak shifting to the bottom of the gradient; although, these elevation areas are influenced by strong anthropogenic activities and land use pressures, nevertheless there is a positive interaction with human influence. We suppose that farmland and agricultures activities at these elevation areas can provide habitats useable by wild birds which is also discovered in some studies (Sekercioglu, 2012; Frishkoff et al., 2014; Muñoz-Pedreros et al., 2018). Another reason might be that the birds at these elevation areas have to tolerate the human influence due to their migration or breeding in this region where they have no other places to stay. In our collected data according to distribution status of species, 35% belong to breeding migration (BM); 20% belong to resident (R); 12% belong to breeding migration wintering (BMW); 9% belong to migration wintering (MW; Koblik and Arkhipov, 2014). By conservation ranking (IUCN), 96% of species have the rank of Least Concern (LC); 2% have the rank of Near Threatened (NT); 1% have the rank of Vulnerable (VU) and the same percentage have the rank of Endangered (EN; https://www.iucnredlist.org). The list of the species from our collected data is given in Appendix List S1.
Tajikistan harbours a high level of avian diversity, making it one of the global biodiversity hotspots (Myers et al., 2000; Mittermeier et al., 2004); moreover, most of the bird species in Tajikistan distributed at mid-elevations. Hence, a need exists for increased conservation efforts in these elevation areas. In the present case, our knowledge of human influence interactions with BSR is limited; thus, it is necessary to conduct long-term monitoring in mid-elevation zones with an emphasis on agricultural and urban areas and applied research are needed to provide more valuable insights for biodiversity conservation. As there is a positive relationship between species richness and proportion of protected areas (Paudel and Šipoš, 2014), expanding these reserves at mid-elevations will add greatly to its conservation value on avifauna. We found that 55% (n = 160) of all breeding birds have small ranges, thus they are at a greater risk of extinction than species with larger elevational ranges, since a small elevational range is the strongest predictor of the risk of extinction (White and Bennett, 2015). Therefore, there is a necessity to emphasize research on small-ranged species of birds in the region. Birds in mid-elevation areas in the zones of maximal species richness should be protected by working with local communities, particularly the need for environmental education designed to increase the awareness of local people about birds of Tajikistan, as it is related to the vital requirement for the protection and conservation of birds.
5.
Conclusion
This study tests environmental factors in shaping the elevational richness patterns of bird species in Tajikistan. The combined and interactive effect of gradients of climate (temperature, precipitation), and human influence (HII, HD) are able to predict bird species richness for nearly all species groups. The overall BSR patterns are hump-shaped with a peak shifting to the bottom of the gradient; however, these elevation areas are influenced by anthropogenic activities and land use pressures revealing the positive interaction between human influence and BSR. Therefore, it is necessary to conduct further research at these elevations in order to obtain more valuable insights about this interaction. We propose to focus research on small-ranged species due to their rate of extinction, since the majority of species are small-ranged in the region. In addition, it is necessary to work with local communities to increase the awareness of local people about the birds of Tajikistan for their further conservation and protection. This work highlights the importance for future management related to biodiversity conservation in Tajikistan and even in the Central Asian regions as being a pioneering case study of this region.
Author contributions
FL managed the study program; DA, and TC conceived the idea and research arrangement; PH identified and provided main part of the data; TC, FL and GS developed and edited the paper; DA, TC, PF, AF, analyzed the data; DA, TC, GS and FL developed the presentation, and wrote the paper. All authors read and approved the final manuscript.
Declaration of competing interest
The authors declare that they have no competing interests.
Acknowledgements
We kindly would like to acknowledge Professor Saidov A.S. (a former director of Institute of Zoology and Parasitology named after Pavlovsky E. N., and the present vice president of Academy of Sciences of the Republic of Tajikistan), who always supports us and was involved in arrangement of field trips during our joint project of collaborative research in Tajikistan. We would like to thank Askar Isabekov, a birdwatcher (owner of the birdwatching website: https://birds.kz/index.php and https://tajikistan.birds.watch), who provided us some bird's data of Tajikistan (353 occurrence data). We acknowledge Koblik E.A. (an ornithologist in Zoological Museum of Moscow State University. M. V. Lomonosova), for his comments, and ideas relating species checklist of Tajikistan. The first author would like to thank Manichanh Satdichanh and Bhattarai Prakash for some guidance and help during statistical analyses and also would like to acknowledge Chinese Academy of Sciences – The World Academy of Sciences (CAS-TWAS) President Fellowship Programme for providing scholarship to pursue Ph.D in the Ornithological Research Group at the Institute of Zoology, CAS. This work was funded by the National Science and Technology Major Project (2018ZX10101004), the Key Collaborative Research Program of the Alliance of International Science Organizations (ANSO-CR-KP-2020-04), Strategic Priority Research Program of the Chinese Academy of Sciences (XDA19050202).
Abebe, A.F., Cai, T., Wale, M., Song, G., Fjeldsa, J., Lei, F., 2019. Factors determining species richness patterns of breeding birds along an elevational gradient in the Horn of Africa region. Ecol. Evol. 917, 9609-9623.
Baldi, A., 2008. Habitat heterogeneity overrides the species-area relationship. J. Biogeogr. 354, 675-681.
Bazzaz, F., 1975. Plant species diversity in old-field successional ecosystems in southern Illinois. Ecology 562, 485-488.
Begon, M., Townsend, C., Harper, J., 2006. Ecology, from Individuals to Ecosystems. fourth ed. Blackwell Publication, New York.
Bhattarai, K.R., Vetaas, O.R., 2006. Can Rapoport's rule explain tree species richness along the Himalayan elevation gradient, Nepal? Divers. Distrib. 124, 373-378.
Brehm, G., Colwell, R.K., Kluge, J., 2007. The role of environment and mid-domain effect on moth species richness along a tropical elevational gradient. Glob. Ecol. Biogeogr. 162, 205-219.
Colwell, R.K., Brehm, G., Cardelus, C.L., Gilman, A.C., Longino, J.T., 2008. Global warming, elevational range shifts, and lowland biotic attrition in the wet tropics. Science 322, 258-261.
Colwell, R.K., Hurtt, G.C., 1994. Nonbiological gradients in species richness and a spurious Rapoport effect. Am. Nat. 1444, 570-595.
Colwell, R.K., Lees, D.C., 2000. The mid-domain effect: geometric constraints on the geography of species richness. Trends Ecol. Evol. 152, 70-76.
Colwell, R.K., Rahbek, C., Gotelli, N.J., 2004. The mid-domain effect and species richness patterns: what have we learned so far? Am. Nat. 1633, E1-E23.
Currie, D.J., Mittelbach, G.G., Cornell, H.V., Field, R., Guégan, J.F., Hawkins, B.A., Kaufman, D.M., Kerr, J.T., Oberdorff, T., O'Brien, E., Turner, J.R.G., 2004. Predictions and tests of climate-based hypotheses of broad-scale variation in taxonomic richness. Ecology letters 7(12), 1121–1134.
Elsen, P.R., Tingley, M.W., Kalyanaraman, R., Ramesh, K., Wilcove, D.S., 2017. The role of competition, ecotones, and temperature in the elevational distribution of Himalayan birds. Ecology 982, 337-348.
Evans, K.L., Warren, P.H., Gaston, K.J., 2005. Species-energy relationships at the macroecological scale: a review of the mechanisms. Biol. Rev. 801, 1-25.
Fjeldsa, J., Bowie, R.C., Rahbek, C., 2012. The role of mountain ranges in the diversification of birds. Annu. Rev. Ecol. Evol. Syst. 43, 249-265.
Fraschetti, S., Bianchi, C.N., Terlizzi, A., Fanelli, G., Morri, C., Boero, F., 2001. Spatial variability and human disturbance in shallow subtidal hard substrate assemblages: a regional approach. Mar. Ecol. Prog. Ser. 212: 1-12.
Frishkoff, L.O., Karp, D.S., M'Gonigle, L.K., Mendenhall, C.D., Zook, J., Kremen, C., et al., 2014. Loss of avian phylogenetic diversity in neotropical agricultural systems. Science 345, 1343-1346.
Gill, F., Donsker, D., 2019. IOC world bird list (v9. 2). .
Hawkins, B.A., Diniz-Filho, J.A.F., Soeller, S.A., 2005. Water links the historical and contemporary components of the Australian bird diversity gradient. J. Biogeogr. 326, 1035-1042.
Hawkins, B.A., Porter, E.E., 2001. Area and the latitudinal diversity gradient for terrestrial birds. Ecology letters 4(6), 595–601.
He, X., Wang, X., DuBay, S., Reeve, A.H., Alstrom, P., Ran, J., et al., 2019. Elevational patterns of bird species richness on the eastern slope of Mt. Gongga, Sichuan Province, China. Avian Res. 101, 1-12.
Hunter, J., Malcolm, L., Yonzon, P., 1993. Altitudinal distributions of birds, mammals, people, forests, and parks in Nepal. Conserv. Biol. 72, 420-423.
Hurlbert, A.H., Haskell, J.P., 2003. The effect of energy and seasonality on avian species richness and community composition. Am. Nat. 1611, 83-97.
Inostroza, L., Zasada, I., Konig, H.J., 2016. Last of the wild revisited: assessing spatial patterns of human impact on landscapes in Southern Patagonia, Chile. Region. Environ. Change 167, 2071-2085.
Jetz, W., Rahbek, C., 2002. Geographic range size and determinants of avian species richness. Science 297, 1548-1551.
Karger, D.N., Conrad, O., Bohner, J., Kawohl, T., Kreft, H., Soria-Auza, R.W., et al., 2017. Climatologies at high resolution for the earth's land surface areas. Sci. Data 41, 1-20.
Karl, J.W., Maurer, B.A., 2010. Spatial dependence of predictions from image segmentation: a variogram-based method to determine appropriate scales for producing land-management information. Ecol. Inform. 53, 194-202.
Koblik, E.A., Arkhipov, V.Y., 2014. Avifauna of the States of Northern Eurasia (former USSR): checklists. Zool. Issledov. 14, 171.
Koh, C.N., Lee, P.F., Lin, R.S., 2006. Bird species richness patterns of northern Taiwan: primary productivity, human population density, and habitat heterogeneity. Divers. Distrib. 125, 546-554.
Kurbоnov, S., Saidov, M., 2013. The state of forest genetic resources in the sec region, the Republic of Tajikistan country report: Food and Agriculture Organization of the United Nations. .
Lee, P.F., Ding, T.S., Hsu, F.H., Geng, S., 2004. Breeding bird species richness in Taiwan: distribution on gradients of elevation, primary productivity and urbanization. J. Biogeogr. 312, 307-314.
Lees, D.C., Kremen, C., Andriamampianina, L., 1999. A null model for species richness gradients: bounded range overlap of butterflies and other rainforest endemics in Madagascar. Biol. J. Linn. Soc. 674, 529-584.
Liu, Y., Su, X., Shrestha, N., Xu, X., Wang, S., Li, Y., et al., 2019. Effects of contemporary environment and Quaternary climate change on drylands plant diversity differ between growth forms. Ecography 422, 334-345.
Luo, Z., Tang, S., Li, C., Fang, H., Hu, H., Yang, J., Ding, J., Jiang, Z., 2012. Environmental effects on vertebrate species richness: Testing the energy, environmental stability and habitat heterogeneity hypotheses. PLoS One 7(4), e35514.
MacArthur, R.H., MacArthur, J.W., 1961. On bird species diversity. Ecology 423, 594-598.
Mallet-Rodrigues, F., Parrini, R., Renno, B., 2015. Bird species richness and composition along three elevational gradients in southeastern Brazil. Atualidades Ornitologicas 188, 39-58.
Marchese, C., 2015. Biodiversity hotspots: a shortcut for a more complicated concept. Glob. Ecol. Conserv. 3, 297-309.
McCain, C.M., 2009. Global analysis of bird elevational diversity. Glob. Ecol. Biogeogr. 183, 346-360.
McCain, C.M., Grytnes, J.A., 2010. Elevational gradients in species richness. eLS. .
Mittermeier, R.A., Gil, P., Hoffman, M., Pilgrim, J., Brooks, T., Mittermeier, C., et al., 2004. Hotspots Revisited: Earth's Biologically Richest and Most Endangered Terrestrial Ecoregions Cemex. CEMEX, Mexico City.
Munoz-Pedreros, A., Gonzalez-Urrutia, M., Encina-Montoya, F., Norambuena, H.V., 2018. Effects of vegetation strata and human disturbance on bird diversity in green areas in a city in southern Chile. Avian Res. 91, 1-15.
Murphy, G.E., Romanuk, T.N., 2014. A meta-analysis of declines in local species richness from human disturbances. Ecol. Evol. 41, 91-103.
Myers, N., Mittermeier, R.A., Mittermeier, C.G., Da Fonseca, G.A., Kent, J., 2000. Biodiversity hotspots for conservation priorities. Nature 403, 853-858.
Nobis, M., Nowak, A., 2011. New data on the vascular flora of the central Pamir Alai Mountains (Tajikistan, Central Asia). Polish Bot. J. 562, 195-201.
Nogues-Bravo, D., Araujo, M., Romdal, T., Rahbek, C., 2008. Scale effects and human impact on the elevational species richness gradients. Nature 4537192, 216-219.
Nowak, A., Nowak, S., Nobis, M.N.A., Nobis, A., 2015. Distribution patterns of segetal weeds of cereal crops in Tajikistan. Pak. J. Bot. 474, 1415-1422.
O'Brien, E., 1998. Water-energy dynamics, climate, and prediction of woody plant species richness: an interim general model. J. Biogeogr. 252, 379-398.
Olson, D.M., Dinerstein, E., Wikramanayake, E.D., Burgess, N.D., Powell, G.V., Underwood, E.C., et al., 2001. Terrestrial ecoregions of the world: a new map of life on earth. A new global map of terrestrial ecoregions provides an innovative tool for conserving biodiversity. BioScience 5111, 933-938.
Pan, X., Ding, Z., Hu, Y., Liang, J., Wu, Y., Si, X., et al., 2016. Elevational pattern of bird species richness and its causes along a central Himalaya gradient, China. PeerJ 4, e2636.
Pan, X., Liang, D., Zeng, W., Hu, Y., Liang, J., Wang, X., et al., 2019. Climate, human disturbance and geometric constraints drive the elevational richness pattern of birds in a biodiversity hotspot in southwest China. Glob. Ecol. Conserv. 18, e00630.
Pandey, N., Khanal, L., Chalise, M.K., 2020. Correlates of avifaunal diversity along the elevational gradient of Mardi Himal in Annapurna Conservation Area, Central Nepal. Avian Res. 111, 1-14.
Paudel, P.K., Sipos, J., 2014. Conservation status affects elevational gradient in bird diversity in the Himalaya: a new perspective. Glob. Ecol. Conserv. 2, 338-348.
Pimm, S.L., Jenkins, C.N., Abell, R., Brooks, T.M., Gittleman, J.L., Joppa, L.N., et al., 2014. The biodiversity of species and their rates of extinction, distribution, and protection. Science 344, 1246752.
Pinheiro, J., Bates, D., DebRoy, S., Sarkar, D., R Core Team, 2007. Linear and nonlinear mixed effects models. R package version 357, 1-89.
Price, T.D., Hooper, D.M., Buchanan, C.D., Johansson, U.S., Tietze, D.T., Alstrom, P., et al., 2014. Niche filling slows the diversification of Himalayan songbirds. Nature 509, 222-225.
Quintero, I., Jetz, W., 2018. Global elevational diversity and diversification of birds. Nature 555, 246-250.
R Development Core Team. 2018. R: a Language and Environment for Statistical Computing. R Foundation for Statistical Computing, Vienna.
Rahbek, C., 1995. The elevational gradient of species richness: a uniform pattern? Ecography 18, 200-205.
Rahbek, C., 2005. The role of spatial scale and the perception of large-scale species-richness patterns. Ecol. Lett. 82, 224-239.
Rahbek, C., Borregaard, M.K., Antonelli, A., Colwell, R.K., Holt, B.G., Nogues-Bravo, D., et al., 2019a. Building mountain biodiversity: geological and evolutionary processes. Science 365, 1114-1119.
Rahbek, C., Borregaard, M.K., Colwell, R.K., Dalsgaard, B., Holt, B.G., Morueta-Holme, N., et al., 2019b. Humboldt's enigma: what causes global patterns of mountain biodiversity? Science 365, 1108-1113.
Robinson, N., Regetz, J., Guralnick, R.P., 2014. EarthEnv-DEM90: a nearly-global, void-free, multi-scale smoothed, 90 m digital elevation model from fused ASTER and SRTM data. ISPRS J. Photogramm. 87, 57-67.
Rodriguez-Rodriguez, D., Bomhard, B., 2012. Mapping direct human influence on the world's mountain areas. Mt. Res. Dev. 322, 197-202.
Rosenzweig, M.L., 1995. Species diversity in space and time. Cambridge University Press, Cambridge.
Ruggiero, A., Hawkins, B.A., 2008. Why do mountains support so many species of birds? Ecography 313, 306-315.
Safarov, N., 2003. National strategy and action plan on conservation and sustainable use of biodiversity. .
Sam, K., Koane, B., Bardos, D.C., Jeppy, S., Novotny, V., 2019. Species richness of birds along a complete rain forest elevational gradient in the tropics: habitat complexity and food resources matter. J. Biogeogr. 462, 279-290.
Sekercioglu, C.H., 2012. Bird functional diversity and ecosystem services in tropical forests, agroforests and agricultural areas. J. Ornithol. 1531, 153-161.
Sergio, F., Pedrini, P., 2007. Biodiversity gradients in the Alps: the overriding importance of elevation. Biodivers. Conserv. 16, 3243-3254.
Stevens, G.C., 1992. The elevational gradient in altitudinal range: an extension of Rapoport's latitudinal rule to altitude. Am. Nat. 1406, 893-911.
Thakur, M., 2013. Bird species composition along the altitudinal gradient in Himachal Pradesh (Western Himalaya), India. Int. J. Adv. Biol. Res. 34, 556-562.
Tjoerve, E., Tjoerve, K.M., 2017. Species-area relationship. eLS. 1-9.
Treshkin, S., Kamalov, S., Bachiev, A., Mamutov, N., Gladishev, A., Aimbetov, I., 1998. Present status of the tugai forests in the lower Amudarya basin and problems of their protection and restoration. Ecol. Res. Monit. Aral Sea Deltas 43-54.
Turner, M.G., Gardner, R.H., O'neill, R.V., O'Neill, R.V., 2001. Landscape Ecology in Theory and Practice. Springer, New York.
Vetaas, O.R., Grytnes, J.A., 2002. Distribution of vascular plant species richness and endemic richness along the Himalayan elevation gradient in Nepal. Glob. Ecol. Biogeogr. 114, 291-301.
White, R.L., Bennett, P.M., 2015. Elevational distribution and extinction risk in birds. PLoS ONE 104, e0121849.
Wickham, H., 2009. ggplot2: Elegant Graphics for Data Analysis (use R!). Springer, New York.
Wilson, E.O., MacArthur, R.H., 1967. The Theory of Island Biogeography. Princeton University Press, Princeton.
Wu, Y., Colwell, R.K., Han, N., Zhang, R., Wang, W., Quan, Q., et al., 2014. Understanding historical and current patterns of species richness of babblers along a 5000-m subtropical elevational gradient. Glob. Ecol. Biogeogr. 2311, 1167-1176.
Wu, Y., Colwell, R.K., Rahbek, C., Zhang, C., Quan, Q., Wang, C., et al., 2013a. Explaining the species richness of birds along a subtropical elevational gradient in the Hengduan Mountains. J. Biogeogr. 4012, 2310-2323.
Wu, Y., Yang, Q., Wen, Z., Xia, L., Zhang, Q., Zhou, H., 2013b. What drives the species richness patterns of non-volant small mammals along a subtropical elevational gradient? Ecography 362, 185-196.
Zhang, J., Kissling, W.D., He, F., 2013. Local forest structure, climate and human disturbance determine regional distribution of boreal bird species richness in Alberta, Canada. J. Biogeogr. 406, 1131-1142.
Richness is positively related to land surface area
Habitat heterogeneity hypotheses
Complex and diverse habitats can provide more niches and different ways to use natural resources and thus increase the diversity of species (MacArthur and MacArthur, 1961; Bazzaz, 1975)
Richness is positively related to the habitat heterogeneity
Richness is related to water-energy predictors (temperature, precipitation, productivity)
Human disturbance hypothesis
Virgin and undisturbed natural places have more species diversity due to the absence of anthropogenic interventions and human influence (Rodríguez-Rodríguez and Bomhard, 2012)
Richness is negatively related to Human Influence Index
Table
3.
Estimates of the multiple GLS model of the relationship between species richness of all breeding birds, Passeriformes, Non-Passeriformes and predicted variables in Tajikistan.
Species groups
Variables
Estimate
SE
t-value
P-value
R2
All breeding birds
Area
0.01112
0.00122
9.136592
0.0000***
0.8487
AP
0.15547
0.04117
3.775871
0.0005***
MAT
4.25372
3.63228
1.171089
0.2476
Passeriformes
Area
0.003521
0.00075
4.665392
0.0000***
0.8412
AP
0.077082
0.02479
3.109595
0.0032**
MAT
1.714625
2.20579
0.777329
0.4409
Non-Passeriformes
Area
0.00772
0.000652
11.840427
0.0000***
0.8249
AP
0.08261
0.024218
3.411189
0.0014 **
MAT
2.31335
1.024077
2.258957
0.0287*
1st range size
Area
0.0033
0.00181
1.840596
0.0750*
0.8955
TAR
−33.0177
5.75236
−5.739844
0.0000***
AP
−0.0945
0.02108
−4.481573
0.0001***
HII
1.0812
0.43688
2.474727
0.0188***
2nd range size
Area
0.0028
0.00074
3.818336
0.0004***
0.4250
TAR
−8.7881
3.14572
−2.793655
0.0077**
HII
0.7748
0.33769
2.294424
0.0266*
3rd range size
Area
0.00220
0.000369
5.961578
0.0000***
0.8581
MDE
1.11785
0.292032
3.827836
0.0004***
MAT
0.90155
0.458021
1.968366
0.0552*
AP
0.03264
0.014076
2.318589
0.0250*
4th range size
Area
0.000797
0.0001790
4.452443
0.0001***
0.8910
MDE
0.733039
0.1464837
5.004237
0.0000***
AP
0.014024
0.0034167
4.104511
0.0002***
HII
−0.196024
0.0730349
−2.683984
0.0101*
Abbreviations: mid-domain effect, MDE; habitat heterogeneity, HH; mean annual temperature, MAT; temperature annual range, TAR; annual precipitation, AP; normalizeddifferencevegetationindex, NDVI; human influence index, HII, and human disturbance, HD; standard error, SE. *P < 0.01, **P < 0.001, ***P < 0.0001.
Table
2.
Pearson's correlation coefficients for the nine variables used to predict the species richness of birds in Tajikistan.
Area
MDE
HH
MAT
TAR
AP
NDVI
HII
MDE
−0.32250 (0.02236)
HH
−0.57639 (1.184e–05)
0.58858 (6.937e–06)
MAT
−0.30588 (0.03075)
0.03171 (0.8269)
0.65140 (3.008e–07)
TAR
0.70265 (1.285e–08)
−0.46550 (0.00065)
−0.63336 (7.96e–07)
−0.05423 (0.7084)
AP
−0.60746 (2.9e–06)
0.78150 (2.12e–11)
0.46627 (0.00064)
0.24010 (0.09305)
−0.77107 (5.714e–11)
NDVI
−0.39964 (0.00403)
0.09763 (0.5)
0.72789 (2.106e–09)
0.98118 (< 2.2e–16)
−0.18797 (0.1911)
−0.11735 (0.417)
HII
−0.33623 (0.01697)
0.13179 (0.3616)
0.62659 (1.129e–06)
0.96462 (< 2.2e–16)
−0.05881 (0.685)
−0.13638 (0.345)
0.94798 (< 2.2e–16)
HD
−0.37294 (0.00764)
−0.09528 (0.5104)
0.60465 (3.313e–06)
0.97514 (< 2.2e–16)
−0.08179 (0.5723)
−0.26711 (0.06077)
0.96607 (< 2.2e–16)
0.93001 (< 2.2e–16)
Pearson's "r" is in bold and the P-value is in brackets. Abbreviations: mid-domain effect, MDE; habitat heterogeneity, HH; mean annual temperature, MAT; temperature annual range, TAR; annual precipitation, AP; normalized difference vegetation index, NDVI; human influence index, HII, and human disturbance, HD.

 DownLoad:


 Email Alerts
 RSS Feeds