Kevin B. Briggs, Mark C. Mainwaring. 2022: Habitat selection by nestbox-breeding birds and Roe Deer are incongruent within a heterogeneous woodland landscape. Avian Research, 13(1): 100012. DOI: 10.1016/j.avrs.2022.100012
Citation:
Kevin B. Briggs, Mark C. Mainwaring. 2022: Habitat selection by nestbox-breeding birds and Roe Deer are incongruent within a heterogeneous woodland landscape. Avian Research, 13(1): 100012. DOI: 10.1016/j.avrs.2022.100012
Kevin B. Briggs, Mark C. Mainwaring. 2022: Habitat selection by nestbox-breeding birds and Roe Deer are incongruent within a heterogeneous woodland landscape. Avian Research, 13(1): 100012. DOI: 10.1016/j.avrs.2022.100012
Citation:
Kevin B. Briggs, Mark C. Mainwaring. 2022: Habitat selection by nestbox-breeding birds and Roe Deer are incongruent within a heterogeneous woodland landscape. Avian Research, 13(1): 100012. DOI: 10.1016/j.avrs.2022.100012
Conserving species relies upon acquiring an understanding of their use of habitat, yet our understanding of the use of habitat by co-existing species of different guilds at microgeographic scales remains poor. In particular, the use of habitat by woodland species is of conservation concern because of widespread declines in woodland biodiversity. Woodland bird declines have been ascribed, in part, to high deer densities because their browsing reduces the availability of nesting sites and food. We quantify the microgeographic use of habitat by Roe Deer (Capreolus capreolus) and of Great Tits (Parus major), Blue Tits (Cyanistes caeruleus) and Pied Flycatchers (Ficedula hypoleuca) in a heterogenous woodland landscape. We examined the use of habitat at microgeographic scales by the deer and the three bird species in relation to whether the local habitat was flat or wet or had a path, fence or wall within a 25-m radius of 206 randomly selected locations. We first examined if the occupancy rates of nestboxes in those locations were correlated with the number of Roe Deer lays and second, examined if the use of habitat by the Roe Deer and the bird species were associated with each of the habitat features that we quantified. We begin by showing that the use of habitat by Roe Deer is incongruent with the use of habitat by Great Tits, Blue Tits and Pied Flycatchers during the breeding season. Also, whilst all three bird species showed no, or weak, habitat preferences, the Roe Deer preferred daytime lay sites that were in flat areas of wet woodland close to paths, whilst there were no significant effects of the presence of fences and walls. These findings show that the Roe Deer and the three bird species differ in the use of habitat within a heterogenous woodland landscape, meaning that their use of habitat did not overlap at microgeographic scales. Meanwhile, the deer showed preferences for flat areas of wet woodland, whilst none of the bird species exhibited such preferences, and we discuss the implications of our findings for the management of woodlands.
The use of habitat by species occupying woodlands is of interest because of ongoing and widespread declines amongst woodland species (Bengtsson et al., 2000). Temperate woodlands are globally important habitats that in addition to hosting some of the oldest and largest trees, and thus organisms, in the world, serve as one of the world's major sources of timber and wood products, in addition to providing critical ecosystem services such as nutrient cycling, carbon cycling and the regulation of soil and water movements (Brockerhoff et al., 2017). Many species of woodland birds have undergone population declines in the past few decades (Gregory et al., 2007; Hewson and Noble, 2009) and there is a growing concern that the population increases seen in some deer species may be directly linked to the population declines of some songbird species (Chollet and Martin, 2013).
Deer are known to have significant impacts upon the vegetative dynamics of woodlands, particularly when they occur at high densities (Kirby, 2001; Fuller and Gill, 2001; Fuller, 2007). High deer numbers cause shrubs such as brambles (Rubus fruticosa) to decline in abundance through increased grazing pressure (Silva et al., 2015), whilst plants are damaged by trampling (Gill and Beardall, 2001) and forest regeneration is arrested (Bugalho et al., 2013). Deer grazing also has cascading effects on other species (Côté et al., 2004; Holt et al., 2011). For example, invertebrate communities change (Sakata and Michimasa, 2015), and ground-nesting birds (Perrins and Overall, 2001; Morecroft et al., 2001) and small mammals (Buesching et al., 2011) disappear due to a lack of understorey (Joys et al., 2004). It is unclear whether cavity-nesting insectivorous bird species might be affected by deer. Although their nesting availability would not be affected by deer, vegetation can nevertheless influence the foraging success and nestling weight of such species (Tremblay et al., 2005; Wilkin et al., 2009). However, hole-nesting birds should not be expected to suffer a reduction in the availability of nest sites as a result of deer browsing, but this issue remains unclear. Further, little attention has been paid to microgeographic habitat selection by deer, although studies have examined the summer bed sites of Elk (Cervus elephus) in North America (Millspaugh et al., 1998) and bed site selection by Roe Deer (Capreolus capreolus) in Norway (Mysterud, 1996; Linnell et al., 2004).
In contrast to deer, many bird species inhabiting woodlands have declined over the past few decades (Hewson et al., 2007; Hewson and Noble, 2009). Three of the most commonly studied woodland bird species, Pied Flycatcher (Ficedula hypoleuca), Great Tit (Parus major) and Blue Tit (Cyanistes caeruleus), commonly breed in nestboxes (Lambrechts et al., 2010). Pied Flycatchers are long-distance migratory birds and have undergone population declines (Amar et al., 2006), whilst Great Tits and Blue Tits are residents in Europe, despite local movements so that individuals do not remain in the same location year-round, and their populations are stable or even increasing slightly (Hewson et al., 2007). Pied Flycatcher population declines have been attributed to phenological mismatches between the peak availability of their caterpillar food supply and the timing of demand for food by their nestlings (Both et al., 2010), but microgeographic habitat features on the breeding grounds may also influence their population trends. Fine-scale variation in habitat quality, such as that due to browsing pressure, may alter the availability of food for adult flycatchers and tits, but the cavity-nesting tits and flycatchers are unlikely to be short of nest sites (Fuller et al., 2007).
In this study we examined the microgeographic use of habitat by Roe Deer and three species of hole-nesting woodland birds within a heterogeneous deciduous woodland landscape in north-west England. We examined the presence and number of daytime lay sites in relation to whether the local habitat was steep, flat or wet and had a human-made path, fence or wall close by and we test the following predictions. We predict that the Roe Deer will select lay sites in flat, dry areas of woodland that will not have paths, fences or walls close by and that the birds will occupy wetter areas closer to human artefacts. Roe Deer are likely to prefer flat, dry areas of woodland because such areas contain fewer fleas that negatively impact the deer, whilst the birds are expected to prefer such areas because the abundant invertebrates there provide food for the adult birds (Linnell et al., 2004). Meanwhile, Roe Deer and the bird species are likely to prefer areas far from paths, fences or walls because they prefer to occupy the least-disturbed locations (Müller et al., 2017).
2.
Materials and methods
We examined the use of habitat by Roe Deer, Great Tits, Blue Tits and Pied Flycatchers in seven deciduous woodlands in north-west Lancashire, UK, in the 2016–2019 breeding seasons. The woodlands consisted primarily of large, mature Sessile Oak (Quercus petraea) and Downy Birch (Betula pubescens) trees with an understorey of Wood Sorrel (Oxalis acetosella), brambles, ferns, grasses and mosses. The understory vegetation varied within, rather than between, woods which were all classified as “W11” in the National Vegetation Classification (Rodwell, 1991). The woods were all located in the Forest of Bowland Area of Outstanding Natural Beauty (54°05′ N, 02°36′ W; altitude 100–250 m above sea level).
The woodlands exist within an agricultural landscape and whilst there are two villages several kilometres away from two of the woodlands, the other five woodlands are located many kilometres away from residential areas. Six of the woodlands are between 20 and 50 ha in size, whilst one is 3 ha and all of them are privately owned, meaning that the woodlands are largely free of human disturbance. There was no livestock grazing in the woodlands, although there were some irregularly-used human-made paths and tracks throughout the woodlands. Meanwhile, there were no bird feeders in any of the woodlands.
2.1
Quantifying the abundance of deer lay sites
Within the study woodlands, a total of 206 locations were identified prior to the study taking place, which corresponded to the location of the 206 nestboxes, originally installed in 1977, that were included in this study (Lambrechts et al., 2010). One person (KBB) then surveyed each of those spots once during May 2016 alone and systematically searched each location for a period of 15 min for the presence of daytime lay sites of Roe Deer within a 25-m radius of each location. This was achieved by walking around the study area and visually searching for deer lays. A laser was used to define the 25-m radius (Shot saver, Leser Range Finder, SLR500) and we are confident we identified each lay site within the study area because they were easily identifiable due to the lack of vegetation within a relatively small and discrete area which serves to create a warm bed site (Corbet and Harris, 1991).
We quantified the presence and abundance of Roe Deer lay sites in May because that is the month that corresponds to the peak breeding season of the hole-nesting bird species that were included in this study. A total of 183 deer lays were found at the 206 locations, with the number of deer lays varying between 0 and 5 per location. Roe Deer lays are thought to be used over a relatively short period of time and although adult Roe Deer are highly territorial, lay sites may be grouped together when family groups lie together. Alternatively, groups of juveniles sometimes lie together in groups of more than one individual and so locations may contain more than one lay due to the presence of family groups of groups of immature deer (Corbet and Harris, 1991).
The lays were scrapes in the ground which consisted of a clearly identifiable area of ground in which all of the vegetation types, such as moss, grasses and dead leaves, had been raked to the sides of the scrape by the deer. We measured a total of 35 scrapes and they had a maximum length of 55.00 ± 3.00 (range: 50–61) cm and a minimum length of 37.02 ± 2.51 (range: 32–40) cm. Meanwhile, the scrapes contained lots of deer hairs within the scrape itself and the 35 scrapes mentioned immediately above had 67.69 ± 46.74 (range: 3–162) hairs in them because the deer moult in March–May.
2.2
Quantifying the presence of hole-nesting birds and habitat features
The 206 nestboxes were visited at least twice a week as part of a long-term study of birds breeding inside them (Briggs and Deeming, 2016; Briggs and Mainwaring, 2017, 2019). This enabled us to identify the species that occupied the nestboxes during the 2016–2019 breeding seasons, in addition to following their breeding attempts.
We also classified the habitat features associated with each of the 206 locations, which corresponded to the location of nestboxes, in relation to whether the local habitat within a 25-m radius of each spot was flat or wet and had a path, fence or wall within close proximity, as is described more comprehensively in Table 1.
Table
1.
Summary of the landscape features used to define the habitat features.
Habitat feature
Definition
Flat
The land was flat, as defined as there not being a slope of <30° within a 25-m radius of the spot
Wet
The land was wet, which was defined as the presence of land which was wet on a permanent or semi-permanent basis rather than just after rainfall. Further, the land was covered in vegetation associated with wet land, such as sedges and rushes
Path
A path was present within a 25-m radius of the spot. A network of paths interspersed the study woodlands and were reasonably well used by hikers and by also farmers who drive farm vehicles along them on a regular basis
Fence
A fence was present within a 25-m radius of the spot. The fences were primarily sheep netting or barbed wire fences that the deer could jump over
Wall
A wall was present within a 25-m radius of the spot. The walls were stone walls used to separate land belonging to different land owners and the deer could jump over them
The data were tested to assess whether they had a Gaussian error structure using Kolmogorov-Smirnov one sample tests before we analysed the data in the SPSS version 25 (SPSS, Chicago, IL, USA) statistical package.
We began by examining the relationships between the number of deer lays within each of the 206 locations and the occupancy rate of the 3 bird species, and all of the 3 species combined, using General Linear Models (GLM). We used 4 separate models and the explanatory variable was the “lay site number” (1, 2, 3 etc: covariate) in each of those 4 models, whilst separate models had dependent variables of “Great Tit occupation rates” (1, 2, 3 etc: covariate), “Blue Tit occupation rates” (1, 2, 3 etc: covariate), ‘Pied Flycatcher occupation rates’ (1, 2, 3 etc: covariate) and “all species occupation rates” (1, 2, 3 etc: covariate).
We then examined the habitat features that predicted the presence of Roe Deer, Great Tits, Blue Tits, Pied Flycatchers and all bird species using five separate Generalized Linear Models (GLZ) with a Poisson error structure that are used to model count data that include zero. In each of the five models the dependent variables were Roe Deer “lay site number” (0, 1, 2, 3 etc lay sites: continuous variable), “Great Tit occupation rate” (0, 1, 2, 3 etc years occupied: continuous variable), “Blue Tit occupation rate” (0, 1, 2, 3 etc years occupied: continuous variable), “Pied Flycatcher occupation rate” (0, 1, 2, 3 etc years occupied: continuous variable) and “all species occupation rate” (0, 1, 2, 3 etc years occupied: continuous variable) and in all models, the explanatory variables were “wood name” (various: categorical factor), “habitat: flat” (yes, no: categorical factor), “habitat: wet” (yes, no: categorical factor), “habitat: path” (yes, no: categorical factor), “habitat: fence” (yes, no: categorical factor) and “habitat: wall” (yes, no: categorical factor).
Each of the explanatory variables was assessed for significance when they were the last terms in the model. Each of the main terms, as well as all of their two-way interaction terms, were initially entered into the models before they were sequentially rotated and dropped if non-significant until only those terms whose elimination would have significantly reduced the explanatory power of the model remained, thereby yielding the final minimal models. Throughout the study, the mean values are presented ±1 standard error and a critical P value of 0.05 was applied to denote statistical significance.
3.
Results
There was no relationship between the number of daytime lay sites used by Roe Deer at the 206 locations included in this study and the occupancy rates of nestboxes of either the Great Tits (F = 2.565; df = 205; P = 0.111), Blue Tits (F = 0.016; df = 205; P = 0.899), Pied Flycatchers (F = 2.354; df = 205; P = 0.127) or the occupation rates of all of the three bird species combined (F = 0.127; df = 205; P = 0.722).
We then examined the influence of habitat variables and woodland identity on habitat selection by Roe Deer and Great Tits, Blue Tits, Pied Flycatchers and all bird species. For Roe Deer, the number of lay sites at the 206 locations varied between woodlands (P = 0.008; Table 2; Fig. 1A) but were found significantly more often in flat (P < 0.001; Table 2; Fig. 1A) and wet locations (P < 0.001; Table 2; Fig. 1A). Meanwhile, there was a weak indication that Roe Deer lay sites were found close to paths (P = 0.048; Table 2; Fig. 1A), but there was no relationship between the number of lay sites and the presence of fences (P = 0.197; Table 2; Fig. 1A) or walls (P = 0.641; Table 2; Fig. 1A).
Table
2.
Summary of General Linear Models examining the use of habitat by Roe Deer and passerine birds.
Species
Factor
df
Wald Chi-Square
P value
Roe Deer
Flat
1205
13.240
< 0.001
Wet
1205
26.781
< 0.001
Path
1205
3.914
0.048
Fence
1205
1.666
0.197
Wall
1205
0.217
0.641
Wood
1205
15.726
0.008
Great Tit
Flat
1205
4.516
0.034
Wet
1205
2.030
0.154
Path
1205
9.142
0.032
Fence
1205
0.828
0.363
Wall
1205
2.359
0.125
Wood
1205
17.362
0.008
Path × wood
1205
8.180
0.042
Blue Tit
Flat
1205
0.511
0.475
Wet
1205
1.704
0.192
Path
1205
0.005
0.941
Fence
1205
0.016
0.899
Wall
1205
3.127
0.077
Wood
1205
16.473
0.011
Fence × wood
1205
4.644
0.031
Pied Flycatcher
Flat
1205
1.211
0.271
Wet
1205
0.739
0.390
Path
1205
0.216
0.642
Fence
1205
2.460
0.117
Wall
1205
0.697
0.404
Wood
1205
15.494
0.017
All bird species
Flat
1205
0.007
0.932
Wet
1205
<0.001
0.989
Path
1205
0.342
0.559
Fence
1205
0.124
0.725
Wall
1205
5.749
0.016
Wood
1205
30.175
< 0.001
The explanatory variables were the “lay site number” of Roe Deer (0, 1, 2, 3 etc lay sites: continuous covariate), and the occupation rates of Great Tits, Blue Tits, Pied Flycatchers and all bird species (0, 1, 2, 3 etc years occupied: continuous covariate), and the dependent variables were “wood name” (various: categorical factor), “habitat: flat” (yes, no: categorical factor), “habitat: wet” (yes, no: categorical factor), “habitat: path” (yes, no: categorical factor), “habitat: fence” (yes, no: categorical factor) and “habitat: wall” (yes, no: categorical factor). For brevity, only significant interaction terms are included and significant terms are highlighted in bold.
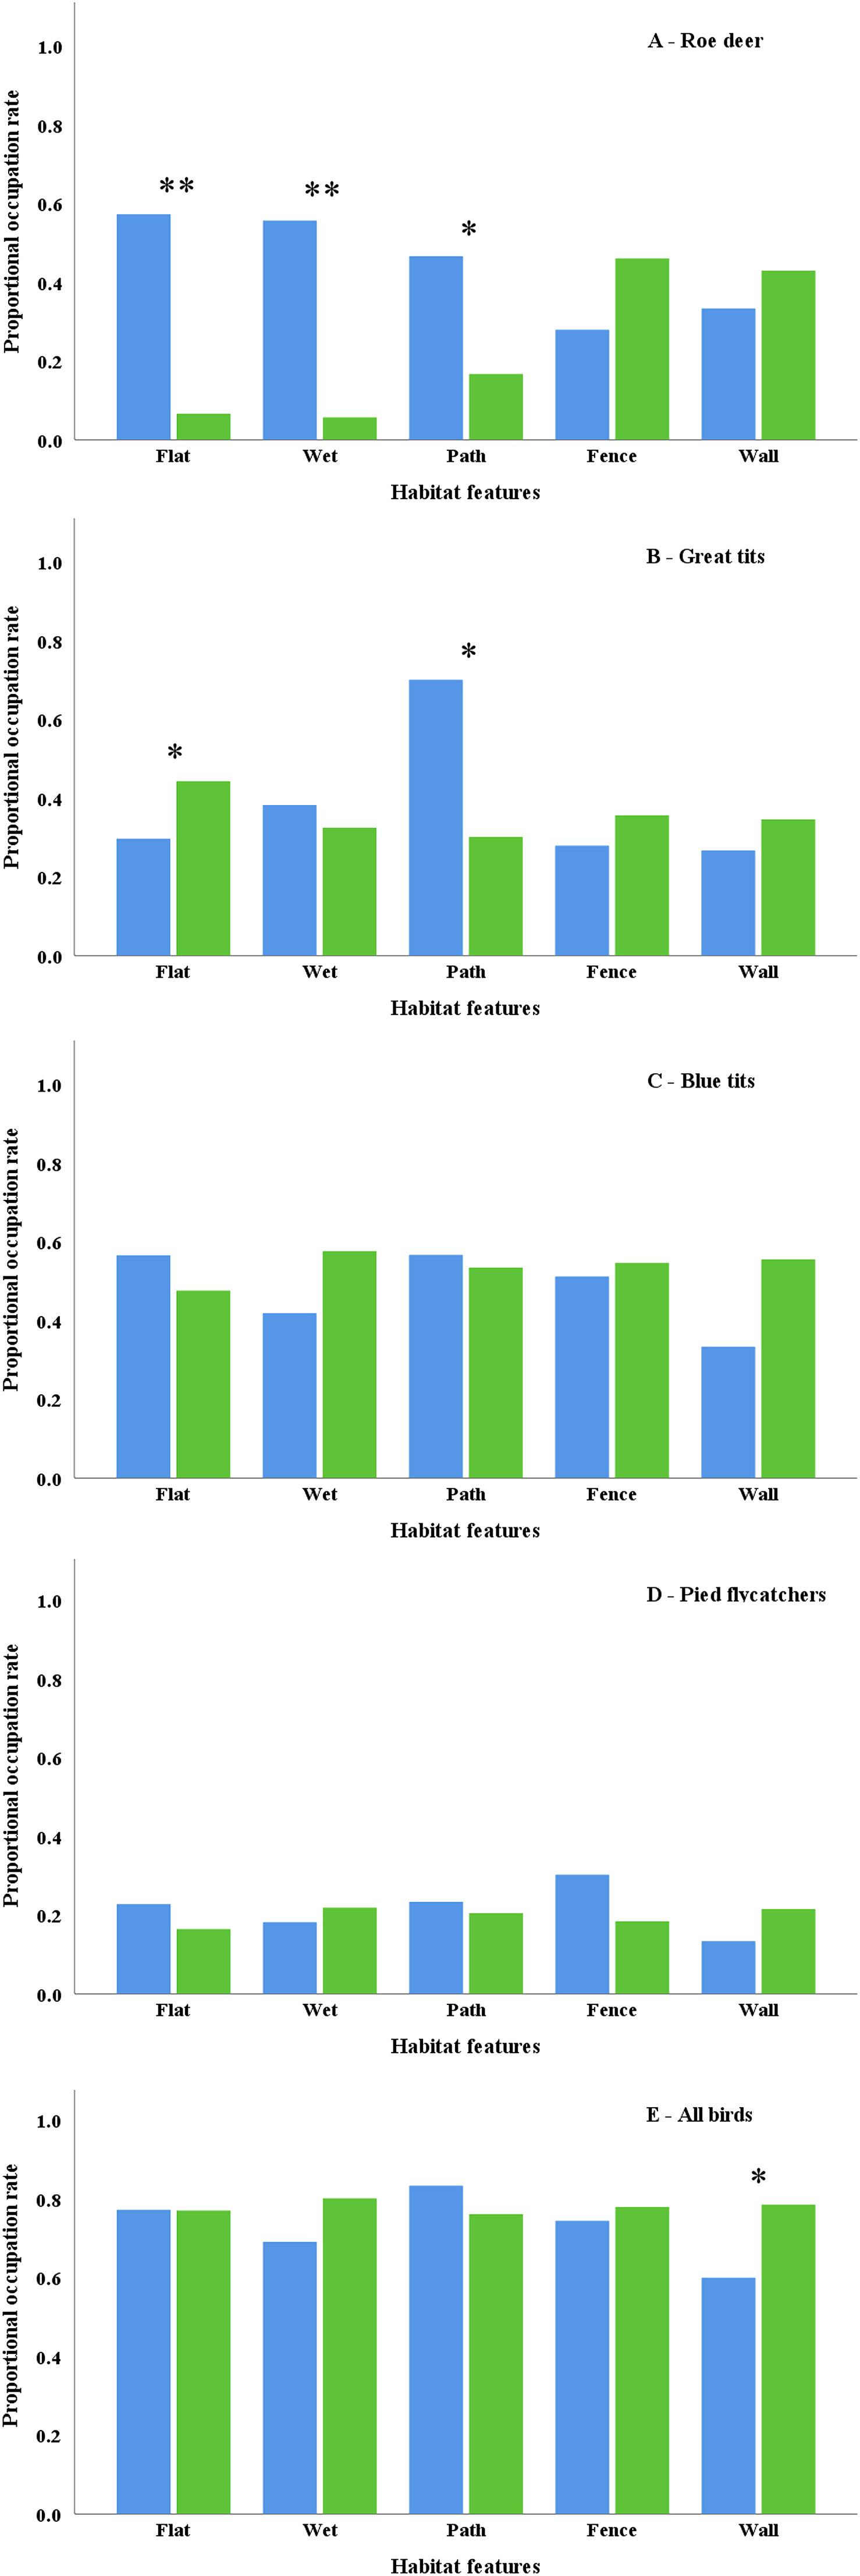
Figure
1.
The proportion of Roe Deer lays and nestbox occupation rates in relation to microgeographic habitat features. Blue bars denote the proportion of locations in which deer lays and breeding birds were present, whilst the green bars denote the proportion of locations in which deer lays and breeding birds were absent. Note that ∗∗ denotes significance at the P < 0.001 level and that ∗ denotes significance at the P < 0.05 level. (For interpretation of the references to colour in this figure legend, the reader is referred to the Web version of this article.)
The occupation of nestboxes by the birds was quantified between 2016 and 2019, yet the deer data were collected in 2016. The data collected on nestbox occupancy rates between 2016 and 2019 are reported below but as deer browsing may influence the vegetative dynamics of woodlands, then we report the 2016 data in Appendix Table S1. For Great Tits, nestbox occupation rates varied between woodlands (P = 0.008; Table 2; Fig. 1B) and showed a trend towards preferring non-flat i.e. steep locations (P = 0.034; Table 2; Fig. 1B) and locations with paths (P = 0.032; Table 2; Fig. 1B). Meanwhile, a significant interaction term between “path” and “wood” (P = 0.042; Table 2; Fig. 1B) showed that the proximity of Great Tit nests to paths varied between woodlands. For Blue Tits, nestbox occupation rates varied between woodlands (P = 0.011; Table 2; Fig. 1C), whilst a significant interaction term between “fence” and “wood” (P = 0.031; Table 2; Fig. 1C) showed the proximity of Blue Tit nests to fences varied between woodlands.
For Pied Flycatchers, the association of occupancy varied between woodlands (P = 0.017; Table 2; Fig. 1D), whilst their nestbox occupation rates never varied with any of the habitat features. For all bird species, meanwhile, the association of nestbox occupation varied between woodlands (P < 0.001; Table 2; Fig. 1E) and showed a highly significant trend towards preferring nestboxes in locations that were located away from walls (P = 0.016; Table 2; Fig. 1E).
4.
Discussion
The main findings of this study were that the microgeographic habitat preferences of Roe Deer were incongruent with the habitat preferences of Great Tits, Blue Tits and Pied Flycatchers within a heterogenous woodland habitat. The Roe Deer preferred locations that were flat, wet and close to paths, but there was no relationship with the presence of fences or walls, whilst none of the three bird species showed really strong preferences for any of the habitat features. These results suggest that Roe Deer and insectivorous passerine birds selected different microgeographic habitats within deciduous woodlands, which suggests the presence of interspecific variation in the use of habitat between guilds.
Roe Deer preferred lay sites in locations that were flat and wet and whilst we are unsure of the factors causing these preferences, it is likely to be related to their food supply. Brambles are one of the main foods of Roe Deer and studies have shown that in Thetford Forest, a large coniferous plantation in eastern England, Roe Deer occurred at higher densities in areas with a greater coverage of both brambles and bracken because they provided food and cover for sleeping deer (Chapman et al., 1985; Hemami et al., 2004, 2005). Unfortunately, we are unable to directly compare the abundance of Roe Deer in our study woodlands with those in other studies because whereas we indirectly quantified the abundance of deer, other studies directly quantified deer abundance. Nevertheless, it may well be that brambles were more abundant in flat areas of wet woodland in our study area but unfortunately, we never quantified the presence of brambles or vegetative cover. Further, we quantified the presence of Roe Deer in one year, 2016, but as the deer may well have changed the vegetative structure of the woodlands, then it would have been preferable to examine their presence and abundance over multiple years. Such relationships would, therefore, be worthy of further study.
Roe Deer lay sites, meanwhile, were found close to paths but showed no relationship with fences or stone walls. It is unclear why the deer preferentially selected areas close to paths but it is likely they may have had less canopy coverage and were thus relatively open. Such open areas are associated with high numbers of brambles, one of the deer's main foods (Chapman et al., 1985; Hemami et al., 2004). Further, the paths are only irregularly used by people and so it is unlikely that the deer were subject to disturbance from humans (Hemami et al., 2004; Jiang et al., 2007). Meanwhile, the use of habitat by Roe Deer was unrelated to the presence of fences or stone walls. Stone walls and fences are not associated with human activities and we suggest that is the reason why the use of habitat by Roe Deer was unrelated to the presence of stone walls and fences.
The occupation of nestboxes by Great Tits varied significantly between woodlands as indicated by several interaction terms involving ‘woodland identity’. There was, however, a very weak trend towards Great Tits preferring habitats that were steep and close to paths, although the use of habitat by Roe Deer was incongruent with the use of habitat by Great Tits. Otherwise, the selection of nest sites by the three bird species was unrelated to any of the habitat features included in this study, although all bird species combined did show a very strong tendency to avoid walls. It has been suggested that increasing deer populations may play an important role in the decline of songbirds (Chollet and Martin, 2013), such as Pied Flycatchers. However, our data suggest that there was minimal overlap, in terms of their selection of habitat at microgeographic scales, between the deer and insectivorous bird species, suggesting that the deer had minimal impact on the birds. This is perhaps unsurprising given that the deer do not impact the availability of nest site of the three bird species included in this study.
Whilst there was no evidence that the bird species avoided the deer, the reason why they occupied different microgeographic habitat locations may be associated with the indirect effects of deer browsing. Although browsing does not alter the availability of nesting sites for cavity-nesting birds, it does alter invertebrate communities which may have led to a reduction in the availability of the food supply of the adult birds (Fuller et al., 2012; Sakata and Michimasa, 2015). Meanwhile, it is unlikely that deer browsing caused a reduction in the availability of caterpillars, on which the birds feed their young, because the caterpillars reside in the tree canopies, well above the reach of the Roe Deer (Perrins and Overall, 2001; Joys et al., 2004). It would be useful to experimentally exclude Roe Deer from experimental bird territories by erecting deer fencing around nestboxes and then quantifying the selection of experimental and control nestboxes that have no deer fencing around them to confirm such suggestions.
Alternatively, the use of habitat by the birds may have been unrelated to the use of habitat by the deer. For example, the three bird species may have selected their nest sites as a result of social information acquired from either conspecifics or heterospecific bird species (Samplonius and Both, 2017; Tolvanen et al., 2018). There may also have been a degree of interspecific competition between the three bird species. Pied Flycatchers are trans-Saharan migrants (Alatalo et al., 1986) and are often prevented from occupying nestboxes by resident tit species, which may explain why migrant birds are declining faster than sedentary birds (Sanderson et al., 2006; Both et al., 2010). In turn, we agree with Goodenough et al. (2009) who argue that nestboxes need to be placed in locations with thought to effectively conserve Pied Flycatchers.
5.
Conclusions
We have shown that habitat use by Roe Deer is incongruent with the habitat use of secondary hole nesting birds in a heterogeneous woodland landscape. Our findings have implications for foresters and conservationists wishing to understand the settlement patterns of deer and birds, because our methodological approach provides an efficient way of estimating the presence and abundance of deer, which in turn means that plans can be developed to lower their abundance if necessary. In light of these findings, we propose two areas of research that may prove fruitful. First, it would be interesting to experimentally confirm if the settlement patterns are linked by erecting deer-proof fences around experimental areas and examining their occupancy rates by hole nesting birds when compared to control areas without deer-proof fences. Second, studies could examine if other deer species have similar lay site preferences to examine the generality of our findings.
Declaration of competing interest
The authors declare that they have no competing interests.
Acknowledgements
We thank Alex Mather, Karl Oyston and Rodney Everett for permission to work in their woodlands.
Alatalo RV, Lundberg A, Glynn C. Female pied flycatchers choose territory quality and not male characteristics. Nature. 1986;323:152-153
Amar, A., Hewson, C.M., Thewlis, R.M., Smith, K.W., Fuller, R.J., Lindsell, J.A., et al., 2006. What’s Happening to Our Woodland Birds?. Joint Report by the Royal Society for the Protection of Birds and the British Trust for Ornithology, Sandy and Thetford.
Bengtsson J, Nilsson SG, Franc A, Menozzi P. Biodiversity, disturbances, ecosystem function and management of European forests. For Ecol Manag. 2000;132:39-50
Bertolino S, Montezemoloa NC, Perrone A. Habitat use of coexisting introduced eastern cottontail and native European hare. Mamm Biol. 2013;78:235-240
Both C, van Turnhout CAM, Bijlsma RG, Siepel H, Van Strien AJ, Foppen RPB. Avian population consequences of climate change are most severe for long-distance migrants in seasonal habitats. Proc R Soc B. 2010;277:1259-1266
Briggs KB, Deeming DC. Use of materials in nest construction by Pied Flycatchers Ficedula hypoleuca reflects localized habitat and geographical location. Bird Study. 2016;63:516-524
Briggs KB, Mainwaring MC. Habitat geology influences intraspecific variation in the speckling patterns of Blue Tit Cyanistes caeruleus and Great Tit Parus major eggs. Acta Ornithol. 2017;52:11-20
Briggs KB, Mainwaring MC. Experimental evidence of non-random nest material selection in Pied Flycatchers. Behav Process. 2019;164:59-64
Brockerhoff EG, Barbaro L, Castagneyrol B, Forrester DI, Gardiner B, Gonzalez-Olabarria JR, et al. Forest biodiversity, ecosystem functioning and the provision of ecosystem services. Biol Cons. 2017;26:3005-3035
Buesching CD, Newman C, Jones JT, Macdonald DW. Testing the effects of deer grazing on two woodland rodents, bankvoles and woodmice. Basic Appl Ecol. 2011;12:207-214
Bugalho MN, Ibanez I, Clark JS. The effects of deer herbivory and forest type on tree recruitment vary with plant growth stage. For Ecol Manag. 2013;308:90-100
Chapman NG, Claydon K, Claydon M, Harris S. Distribution and habitat selection by muntjac and other species in a coniferous forest. Acta Theriol. 1985;30:287-303
Chollet S, Martin J-L. Declining woodland birds in North America: should we blame Bambi? Divers Distrib. 2013;19:481-483
Corbet, G.B., Harris, S., 1991. The Handbook of British Mammals, third ed. Blackwell Scientific Publications, London.
Emmering QC, Kelly JK, Ostfeld RS, Schmidt KA. Variation in coexisting birds to exploit spatial heterogeneity in small mammal activity. J Avian Biol. 2018;49:e01946
Fuller RJ. Responses of woodland birds to increasing numbers of deer: a review of evidence and mechanisms. Forestry. 2007;74:280-298
Fuller RJ, Gill RMA. Ecological impacts of increasing numbers of deer in British woodland. Forestry. 2001;74:193-199
Fuller RJ, Smith KW, Grice PV, Currie FA, Quine CP. Habitat change and woodland birds in Britain: implications for management and future research. Ibis. 2007;149:261-268
Fuller, R.J., Smith, K.W., Hinsley, S.A., 2012. Temperate western European woodland as a dynamic environment for birds: a resource-based view. In: Fuller, R.J. (Ed.), Birds and Habitat: Relationships in Changing Landscapes. Cambridge University Press, Cambridge, pp. 352–380.
Gill RMA, Beardall V. The impact of deer on woodlands: the effects of browsing and seed dispersal on vegetation structure and composition. Forestry. 2001;74:209-218
Goodenough AE, Elliot SL, Hart AG. The challenges of conservation for declining migrants: are reserve-based initiatives during the breeding season appropriate for the Pied Flycatcher Ficedula hypoleuca? Ibis. 2009;151:429-439
Gregory RD, Vorisek P, van Strien A, Gmelig Meyling AW, Jiguet F, Fornasari L, et al. Population trends of widespread woodland birds in Europe. Ibis. 2007;149:78-97
Hawkes RW, Smart J, Brown A, Jones H, Lane S, Wells D, et al. Multi-taxa consequences of management for an avian umbrella species. Biol Conserv. 2019;236:192-201
Hemami MR, Watkinson AR, Dolman PM. Habitat selection by sympatric muntjac (Muntiacus reevesi) and Roe Deer (Capreolus capreolus) in a lowland commercial pine forest. For Ecol Manag. 2004;194:49-60
Hemami MR, Watkinson AR, Dolman PM. Population densities and habitat associations of introduced muntjac Muntiacus reevesi and native Roe Deer Capreolus capreolus in a lowland pine forest. For Ecol Manag. 2005;215:224-238
Hewson CM, Amar A, Lindsell JA, Thewlis RM, Butler S, Smith K, et al. Recent changes in bird populations in British broadleaved woodland. Ibis. 2007;149:14-28
Hewson CM, Noble DG. Population trends of breeding birds in British woodlands over a 32-year period: relationships with food, habitat use and migratory behaviour. Ibis. 2009;151:464-486
Holt CA, Fuller RJ, Dolman PM. Breeding and post-breeding responses of woodland birds to modification of habitat structure by deer. Biol Cons. 2011;144:2151-2162
Jiang G, Zhang M, Ma J. Effects of human disturbance on movement, foraging and bed selection in red deer Cervus elaphus xanthopygus from the Wandashan Mountains, northeastern China. Acta Theriol. 2007;52:435-446
Joys AC, Fuller RJ, Dolman PM. Influences of deer browsing, coppice history and standard trees on the growth and development of vegetation structure in coppiced woods in lowland England. For Ecol Manag. 2004;202:23-37
Kirby KJ. The impact of deer on the ground flora of British woodland. Forestry. 2001;74:219-230
Lambrechts MM, Adriaensen F, Ardia DR, Artemyev AV, Atienzar F, Banbura J, et al. The design of artificial nestboxes for the study of secondary hole-nesting birds: a review of methodological inconsistencies and potential biases. Acta Ornithol. 2010;45:1-26
Linnell JDC, Nilsen EB, Andersen R. Selection of bed-sites by Roe Deer Capreolus capreolus fawns in an agricultural landscape. Acta Theriol. 2004;49:103-111
Martin PR, Martin TE. Ecological and fitness consequences of species coexistence: a removal experiment with Wood Warblers. Ecology. 2001;82:189-206
Millspaugh JJ, Raedeke KJ, Brundige GC, Willmott CC. Summer bed sites of Elk (Cervus elaphus) in the Black Hills, South Dakota: considerations for thermal cover management. Am Midl Nat. 1998;139:133-140
Morecroft MD, Taylor ME, Ellwood SA, Quinn SA. Impacts of deer herbivory on ground vegetation at Wytham Woods, central England. Forestry. 2001;74:251-257
Muller A, Dahm M, Boecher PK, Root-Bernstein M, Svenning J-C. Large herbivores in novel ecosystems - habitat selection by red deer (Cervus elaphus) in a former brown-coal mining area. PLoS One. 2017;12:e0177431
Mysterud A. Bed site selection by adult Roe Deer Capreolus capreolus in southern Norway during summer. Wildlife Biol. 1996;2:101-106
Palomares F, Fernandez N, Roques S, Chavez C, Silveira L, Keller C, et al. Fine-scale habitat segregation between two ecologically similar top predators. PLoS One. 2016;11:e0155626
Perrins CM, Overall R. Effect of increasing numbers of deer on bird populations in Wytham Woods, central England. Forestry. 2001;74:299-309
Rodwell, J.S., 1991. British Plant Communities, vol. 1. Cambridge University Press, Cambridge.
Sakata Y, Michimasa Y. Deer overbrowsing on autumn-flowering plants causes bumblebee decline and impairs pollination service. Ecosphere. 2015;6:274
Samplonius JM, Both C. Competitor phenology as a social cue in breeding site selection. J Anim Ecol. 2017;86:615-623
Samplonius JM, Kromhout Van Der Meer IM, Both C. Nest site preference depends on the relative density of conspecifics and heterospecifics in wild birds. Front Zool. 2017;14:56
Silva JS, Catry FX, Moreira F, Bugalo MN. The effects of deer exclusion on the development of a Mediterranean plant community affected by a wildfire. Restor Ecol. 2015;23:760-767
Tolvanen J, Seppanen J-T, Monkkonen M, Thomson RL, Ylonen H, Forsman JT. Interspecific information on predation risk affects nest site choice in a passerine bird. BMC Evol Biol. 2018;18:181
Tremblay I, Thomas D, Blondel J, Perret P, Lambrechts MM. The effect of habitat quality on foraging patterns, provisioning rate and nestling growth in Corsican Blue Tits Parus caeruleus. Ibis. 2005;147:17-24
Wilkin TA, King LE, Sheldon BC. Habitat quality, nestling diet, and provisioning behaviour in Great Tits Parus major. J Avian Biol. 2009;40:135-145
Table
1.
Summary of the landscape features used to define the habitat features.
Habitat feature
Definition
Flat
The land was flat, as defined as there not being a slope of <30° within a 25-m radius of the spot
Wet
The land was wet, which was defined as the presence of land which was wet on a permanent or semi-permanent basis rather than just after rainfall. Further, the land was covered in vegetation associated with wet land, such as sedges and rushes
Path
A path was present within a 25-m radius of the spot. A network of paths interspersed the study woodlands and were reasonably well used by hikers and by also farmers who drive farm vehicles along them on a regular basis
Fence
A fence was present within a 25-m radius of the spot. The fences were primarily sheep netting or barbed wire fences that the deer could jump over
Wall
A wall was present within a 25-m radius of the spot. The walls were stone walls used to separate land belonging to different land owners and the deer could jump over them
Table
2.
Summary of General Linear Models examining the use of habitat by Roe Deer and passerine birds.
Species
Factor
df
Wald Chi-Square
P value
Roe Deer
Flat
1205
13.240
< 0.001
Wet
1205
26.781
< 0.001
Path
1205
3.914
0.048
Fence
1205
1.666
0.197
Wall
1205
0.217
0.641
Wood
1205
15.726
0.008
Great Tit
Flat
1205
4.516
0.034
Wet
1205
2.030
0.154
Path
1205
9.142
0.032
Fence
1205
0.828
0.363
Wall
1205
2.359
0.125
Wood
1205
17.362
0.008
Path × wood
1205
8.180
0.042
Blue Tit
Flat
1205
0.511
0.475
Wet
1205
1.704
0.192
Path
1205
0.005
0.941
Fence
1205
0.016
0.899
Wall
1205
3.127
0.077
Wood
1205
16.473
0.011
Fence × wood
1205
4.644
0.031
Pied Flycatcher
Flat
1205
1.211
0.271
Wet
1205
0.739
0.390
Path
1205
0.216
0.642
Fence
1205
2.460
0.117
Wall
1205
0.697
0.404
Wood
1205
15.494
0.017
All bird species
Flat
1205
0.007
0.932
Wet
1205
<0.001
0.989
Path
1205
0.342
0.559
Fence
1205
0.124
0.725
Wall
1205
5.749
0.016
Wood
1205
30.175
< 0.001
The explanatory variables were the “lay site number” of Roe Deer (0, 1, 2, 3 etc lay sites: continuous covariate), and the occupation rates of Great Tits, Blue Tits, Pied Flycatchers and all bird species (0, 1, 2, 3 etc years occupied: continuous covariate), and the dependent variables were “wood name” (various: categorical factor), “habitat: flat” (yes, no: categorical factor), “habitat: wet” (yes, no: categorical factor), “habitat: path” (yes, no: categorical factor), “habitat: fence” (yes, no: categorical factor) and “habitat: wall” (yes, no: categorical factor). For brevity, only significant interaction terms are included and significant terms are highlighted in bold.

 DownLoad:


 Email Alerts
 RSS Feeds