Kevin B. Briggs, Mark C. Mainwaring. 2022: Habitat selection by nestbox-breeding birds and Roe Deer are incongruent within a heterogeneous woodland landscape. Avian Research, 13(1): 100012. DOI: 10.1016/j.avrs.2022.100012
Citation:
Kevin B. Briggs, Mark C. Mainwaring. 2022: Habitat selection by nestbox-breeding birds and Roe Deer are incongruent within a heterogeneous woodland landscape. Avian Research, 13(1): 100012. DOI: 10.1016/j.avrs.2022.100012
Kevin B. Briggs, Mark C. Mainwaring. 2022: Habitat selection by nestbox-breeding birds and Roe Deer are incongruent within a heterogeneous woodland landscape. Avian Research, 13(1): 100012. DOI: 10.1016/j.avrs.2022.100012
Citation:
Kevin B. Briggs, Mark C. Mainwaring. 2022: Habitat selection by nestbox-breeding birds and Roe Deer are incongruent within a heterogeneous woodland landscape. Avian Research, 13(1): 100012. DOI: 10.1016/j.avrs.2022.100012
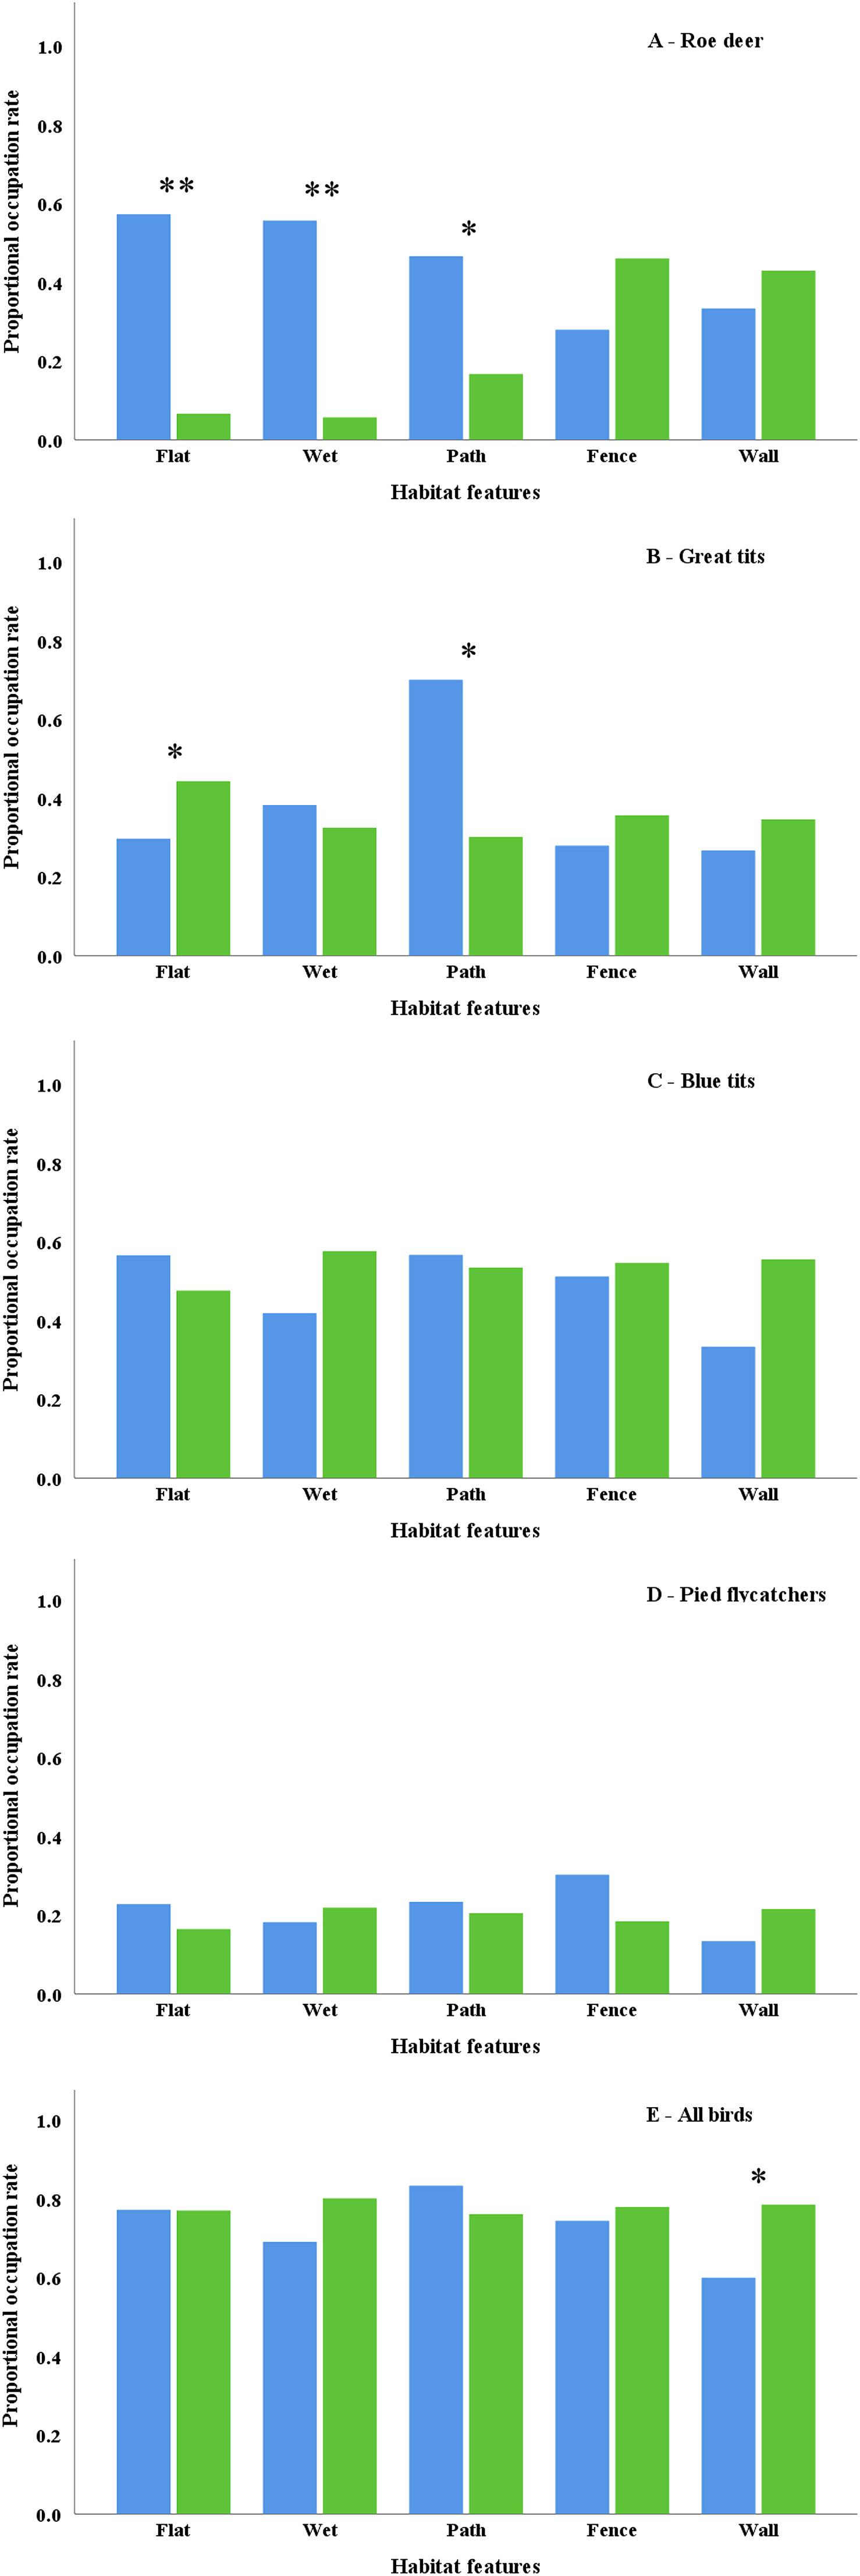
Conserving species relies upon acquiring an understanding of their use of habitat, yet our understanding of the use of habitat by co-existing species of different guilds at microgeographic scales remains poor. In particular, the use of habitat by woodland species is of conservation concern because of widespread declines in woodland biodiversity. Woodland bird declines have been ascribed, in part, to high deer densities because their browsing reduces the availability of nesting sites and food. We quantify the microgeographic use of habitat by Roe Deer (Capreolus capreolus) and of Great Tits (Parus major), Blue Tits (Cyanistes caeruleus) and Pied Flycatchers (Ficedula hypoleuca) in a heterogenous woodland landscape. We examined the use of habitat at microgeographic scales by the deer and the three bird species in relation to whether the local habitat was flat or wet or had a path, fence or wall within a 25-m radius of 206 randomly selected locations. We first examined if the occupancy rates of nestboxes in those locations were correlated with the number of Roe Deer lays and second, examined if the use of habitat by the Roe Deer and the bird species were associated with each of the habitat features that we quantified. We begin by showing that the use of habitat by Roe Deer is incongruent with the use of habitat by Great Tits, Blue Tits and Pied Flycatchers during the breeding season. Also, whilst all three bird species showed no, or weak, habitat preferences, the Roe Deer preferred daytime lay sites that were in flat areas of wet woodland close to paths, whilst there were no significant effects of the presence of fences and walls. These findings show that the Roe Deer and the three bird species differ in the use of habitat within a heterogenous woodland landscape, meaning that their use of habitat did not overlap at microgeographic scales. Meanwhile, the deer showed preferences for flat areas of wet woodland, whilst none of the bird species exhibited such preferences, and we discuss the implications of our findings for the management of woodlands.
To protect threatened species from global climate change and disturbances resulting from human activities, it is necessary to carry out conservation biology studies (Barnosky et al., 2011; Hohenlohe et al., 2021). Evaluating the quality of gene pools is an important task in conservation biology because it helps us to identify priority conservation units (Vandersteen Tymchuk et al., 2010; Nadyeina et al., 2014). The gene pool always refers to the total of the all genetic variations in a population. Generally, the gene pool quality of populations with high genetic diversity is relatively high. In addition, analyzing the gene pool quality could facilitate conservation workers to identify and evaluate the source population and fitness, respectively, of the reintroduced population for the purpose of their conservation (Jeremie et al., 2013; Mueller et al., 2022). However, it is difficult to evaluate the genetic quality of the populations accurately and comprehensively with limited genetic markers because the populations generally harbor numerous variations.
Allozymes (Li et al., 2010), microsatellites (Gu et al., 2013), mitochondrial and nuclear loci (Wang et al., 2017) have been used in conservation genetic researches. For example, mitochondrial DNA has been used to evaluate the global genetic diversity pattern of terrestrial amphibians and mammals (Miraldo et al., 2016). Microsatellites have been used to identify the conservation units of the Blue Eared Pheasant (Crossoptilon auritum; Gu et al., 2013). However, conservation units sometimes cannot be accurately identified using only a limited set of genetic markers (Zhao et al., 2013). For example, it is suggested that Giant Panda (Ailuropoda melanoleuca) has two management units based on mitochondrial and microsatellite loci (Zhang et al., 2007), but the whole genome data suggest there are three distinct lineages (Zhao et al., 2013). The whole genome data could not only tell us the genetic diversity across whole genome but also provide the detailed information of demographic history (Zhao et al., 2013; Xue et al., 2015). What is more, it could help researchers to investigate the inbreeding coefficient (Xue et al., 2015; Wang et al., 2020), mutation load (Xue et al., 2015; Wang et al., 2020), and predict the trend of the population (Gu et al., 2021; Chen et al., 2022). It is necessary to use whole-genome data in conservation genetics research.
With the development of genomic sequencing technology, researchers could use population genomic data to evaluate the genetic diversity of each population and to identify the conservation units (Zhao et al., 2013; Wang et al., 2020). For example, the population genomic data of the Brown Eared Pheasant (C. mantchuricum) indicated that the species has a relatively low genetic diversity and has three conservation units (Wang et al., 2020). The samples used for these kinds of studies are usually blood or animal remains from the field. However, collecting blood from threatened species not only threatens their survival, but is also legally restrictions in some countries. For example, capturing and collecting blood will cause stress reaction of animals. Moreover, it is difficult to find animal remains in the wild. Hence, it is necessary to design a framework that employs whole-genome sequencing to evaluate the genetic diversity of threatened species using non-destructive sampling. Non-destructive sampling has been widely used in previous studies, but they did not evaluate the genetic status at the whole genomic level (Wasko et al., 2003; Schmaltz et al., 2006).
The 2b-RAD technology could facilitate the development of conservation genetics based on non-destructive sampling. It is a restriction site-associated DNA (RAD) genotyping method based on type IIB restriction enzymes and is suitable for high-throughput genotyping (Wang et al., 2012). This method has the advantages of high technical repeatability and cost-effectiveness (Wang et al., 2012). Moreover, trace DNA (100–200 ng) could be used for constructing 2b-RAD libraries and identifying single-nucleotide polymorphisms (SNPs; Cui et al., 2015). The whole genome sequencing DNA libraries always need complete DNA sequences, such as the DNA length is larger than 10 kb. But, the samples that cannot provide complete DNA sequence, such as feathers and feces, may be used to construct 2b-RAD DNA libraries. Furthermore, these types of samples can be collected in a non-destructive manner. Although the 2b-RAD technology has been widely used in population genomics (Gao et al., 2022; Liu et al., 2022; Ruocco et al., 2022), its application in conservation genetic studies is scarce. The RAD sequencing technology has been widely used in conservation genetic researches (Lasalle et al., 2022; Xie et al., 2022), but few studies applied 2b-RAD sequencing technology, which may promote the development of conservation genetics.
The Brown Eared Pheasant (C. mantchuricum) is a threatened species that is classified as vulnerable (VU) in the IUCN red list (BirdLife International, 2016). It is a native species in China, with narrow and fragmented habitats (Zheng, 2015). It is usually found in mountain forests in the temperate zone belt at 1500–1800 m above sea level. Its current distribution is limited to parts of Shaanxi, Shanxi, and Hebei provinces in China, and Beijing, the capital of China. It has been reported that the Brown Eared Pheasant has a low genetic diversity (Wang et al., 2020). Organizing the reintroduction effort may aid in the recovery of this endangered species. In this regard, it is necessary to identify the population source and evaluate the genetic diversity of such species to successfully implement their reintroduction programs. Currently, there are several captive populations of Brown Eared Pheasant. In China, the Taiyuan Zoo has the biggest captive populations of Brown Eared Pheasant, which are raised in one feedlot. The Brown Eared Pheasants were raised in different farms in Europe. These populations may be potential gene pools of this species because they have considerable population size. However, the genetic diversity, inbreeding pattern, and mutation load of these populations are unclear.
The current study employed the 2b-RAD technique to sequence the genomic data from feather samples and used it to: 1) calculate the genetic diversity; 2) estimate the kinship pattern; and 3) evaluate the mutation load of this species. All these analyses will help us understand the genetic status of the captive Brown Eared Pheasant. Moreover, the current project will provide a framework to evaluate the whole-genomic genetic status of threatened species using non-destructive sampling. The framework would improve the development of conservation genetics.
2.
Materials and methods
2.1
Sampling, extracting DNA, constructing 2b-RAD DNA libraries, and identifying SNPs
To compare the genomic status of Taiyuan Zoo and European populations of captive Brown Eared Pheasants, we collected feathers (primaries and tail feathers) from 66 and 76 individuals of the populations, respectively (Appendix Table S1). There were three feathers pulled from living individuals and stored at room temperature. The root of feather was used to extract DNA using the TIANamp Micro DNA Kit (DP316) of TIANGEN BIOTECH (Beijing) Co., LTD. The DNA extraction process followed the protocol of the DNA Kit. The extraction of DNA, construction and sequencing of 2b-RAD DNA library was performed by Shanghai OE Biotech Co., Ltd (Shanghai, China). The concentration and amount of DNA was measured after extracting DNA. The samples that have more than 100 ng DNA were used to construct the 2b-RAD DNA library. A type IIB restriction enzyme (BsaXI) was used to construct the libraries. An average of 14,674,497 (95% confidence interval (CI) = 13,908,242–15,440,752) clean reads per sample was aligned against the autosomes of the Brown Eared Pheasant (accession no. GWHAOPW00000000 in CNCB-NGDC) using Bowtie v. 1.2.3 (Langmead and Salzberg, 2012). Samtools v. 1.14 was used to calculate the mapping rate and coverage of each non-zero depth position (Li, 2011). The gstacks function in Stacks v. 2.41 was used to identify the SNPs (Rochette et al., 2019). The SNPs were then filtered using the following criteria: the minimum percentage of individuals that process the locus is 95%, minimum minor allele frequency is 0.1, maximum observed heterozygosity is 0.6, and the maximum proportion of missing data in each site is 40%. To evaluate whether the DNA quality will influence the number of no-missing SNPs in each sample, the vcftools v. 0.1.13 was used to extract the no-missing SNPs of each sample (Danecek et al., 2011). The DNA were grouped into four groups, which have [8000, 10,000), [10,000, 11,000), [11,000, 12,000), [12,000, 13,000) no-missing SNPs in each sample, respectively. The Welch two sample t-test was used to test whether there is significant difference in DNA amount between any paired groups.
2.2
Estimating the heterozygosity and inbreeding coefficients
To compare the genetic diversity of the two populations of Brown Eared Pheasants, we first calculated the number of heterozygous SNPs in each sample. Here, we define heterozygosity as the number of heterozygous SNPs in each sample divided by the total number of SNPs. We then attempted to estimate the inbreeding levels in the two populations. The 'het' function in vcftools v. 0.1.13 was used to calculate the inbreeding coefficient (Danecek et al., 2011).
To compare the genetic diversity of Brown Eared Pheasant between captive populations and the wild populations. We downloaded re-sequence data of the wild populations from National Genomics Data Center (NGDC; Wang et al., 2020). The re-sequence data is from 19 samples, which include the Shanxi and Shaanxi populations. The accession ID of the data could be found in Appendix Table S2. The pipeline that used to identify SNPs in Wang et al. (2020) was used to analyze the re-sequence data. We also set that the minimum percentage of individuals that process the locus is 95%, minimum minor allele frequency is 0.1, and maximum observed heterozygosity is 0.6 in this SNP set. After we got the clean SNP set, we employed above method to calculate heterozygosity and inbreeding coefficient of each sample.
The independent sample t-test was used to test whether the captive populations and wild populations have similar genetic diversity levels and inbreeding coefficients. To test whether heterozygosity has a negative relationship with the inbreeding coefficient, the RMA method was used to compute the linear regression between the heterozygosity and inbreeding coefficient in the captive populations. The 'lmodel2' R package was used to estimate the linear regression.
2.3
Inferring kinship
We then attempted to evaluate the pedigree of the Brown Eared Pheasants. The KING software v. 2.2.8 was used to estimate the kinship coefficient and proportion of SNPs with zero identical-by-state (IBS0; Manichaikul et al., 2010). Because the input file for the KING software should be in the PLINK binary format, the vcf file was first converted to plink format using vcftools v. 0.1.13 (Danecek et al., 2011). Thereafter, the "make bed" function in Plink v. 1.9 (Purcell et al., 2007) was used to generate the input file for the KING software. The "kinship" function in KING was then used to perform the analysis. Pairs having an estimated kinship coefficient of 0.177–0.354, 0.0884–0.177, 0.0442–0.0884, and < 0.0442 were classified as having first degree, second degree, third degree, and no close relationship, respectively, according to the manual of the KING software.
2.4
Estimating mutation load
The mutation load of the two captive populations was evaluated using snpEff v. 5.1d, which was used to annotate and predict the function effect of each variation in the coding region (Cingolani et al., 2012). Because the sequencing depth and coverage of the wild populations is different with that of the captive populations, we did not compare mutation load between captive populations and wild populations. The "build" function in snpEff was used to build the SNP database of the Brown Eared Pheasant. After constructing the database, the vcf file was used as the input file for snpEff. After annotation, snpSift v. 5.1d (Ruden et al., 2012) was used to extract the missense, synonymous, and loss of function variants. To estimate the effect of missense and loss of function variants on the fitness of the species, we calculated the ratio of the number of homozygous missense mutations to the number of homozygous synonymous mutations, and the ratio of the number of homozygous losses of function mutations to the number of homozygous synonymous mutations, respectively, in each sample. The ratios for the heterozygous sites were also calculated. Missense and loss of function variants that have a negative effect on species fitness are usually heterozygous because homozygous variants reduce the survival rate. The independent sample t-test was used to test whether the two captive populations have similar ratios. The workflow of the above analysis is summarized in Fig. 1.
Figure
1.
Workflow for analyzing the genomic status of endangered species. The words in brackets refer to the corresponding software used for analysis.
The mean number of no-missing SNPs is 11571 (95% CI = 11380–11762). The DNA amount of the samples that have less than 10,000 SNPs is significantly less than that of the samples that have more than 11,000 SNPs (Fig. 2). However, the more DNA content does not necessarily result in more SNPs in the corresponding samples (Fig. 2; Appendix Table S1). The average mapping rate and coverage was 95.24% (95% CI = 94.81%–95.66%) and 1.92 (95% CI = 1.90–1.93), respectively. The 2b-RAD DNA libraries were successfully constructed for 60 and 39 samples from Taiyuan Zoo, China, and Europe, respectively (Appendix Table S1). The probability of successful DNA-library construction is 90.91% and 51.32% for Taiyuan Zoo and Europe populations, respectively. The current study obtained 43,534 high-quality SNPs for the wild populations. Because the re-sequence data of the captive populations and the wild population is from 2b-RAD and whole genome DNA library, respectively, we did not combine the two SNP sets together.
Figure
2.
The boxplot of DNA amount in four groups of samples. The number of no-missing SNPs in each group is [8000, 10,000), [10,000, 11,000), [11,000, 12,000), and [12,000, 13,000), respectively. The Welch two sample t-test was used to test whether there has significance difference between any two pair groups. The asterisk means there has significant difference.
The genetic diversity of the Taiyuan Zoo population was significantly lower than that of the European population (p < 0.01; Fig. 3A). Both populations have lower genetic diversity than the wild population (Fig. 3A). The mean heterozygosity of the Taiyuan Zoo and European populations was 0.20 (95% CI = 0.19–0.21) and 0.25 (95% CI = 0.22–0.27), respectively. The mean heterozygosity in the wild population is 0.30 (95% CI = 0.25–0.34). The mean inbreeding coefficient of the sampled Brown Eared Pheasants in Taiyuan Zoo was 0.40 (95% CI = 0.37–0.43). Compared to the Taiyuan Zoo population, the European population had a significantly lower inbreeding coefficient (0.17; 95% CI = 0.11–0.23; Fig. 3B). Both captive populations have significant higher inbreeding coefficient than the wild population (0.02; 95% CI = −0.09–0.12; Fig. 3D). The inbreeding coefficients of both captive populations had a significantly negative relationship with their heterozygosity (Fig. 3C and D).
Figure
3.
Heterozygosity and inbreeding coefficient of captive and wild Brown Eared Pheasants. (A) and (B): Bar plots of heterozygosity and inbreeding coefficient in Brown Eared Pheasants, respectively. The green, light yellow and brown bars represent the corresponding values for Taiyuan Zoo, European and wild populations, respectively. The error bars represent the 95% confidence interval (CI). Because the 95% CI of the inbreeding coefficient in the wild population is −0.09–0.12, we do not show the values lower than zero in Fig. 2B. The p-value was calculated by the independent sample t-test. (C) and (D): The ranged major axis (RMA) linear regression between heterozygosity and inbreeding coefficient of Brown Eared Pheasants in Taiyuan Zoo and Europe, respectively.
Based on the kinship coefficient, we found that 61.58% of the sampled pairs in Taiyuan Zoo had no close relationship (Fig. 4A, C). In Taiyuan Zoo, the percentage of pairs having first-, second-, and third-degree relationship was 13.90%, 16.38%, and 8.14%, respectively (Fig. 4A, C). The degree of relationship between the individuals in Europe was lower than that between the individuals in Taiyuan Zoo, with 78.00% of the sampled pairs showing no close relationship (Fig. 4B, D). The percentage of pairs having first-, second-, and third-degree relationship was 3.64%, 10.80%, and 7.56%, respectively, in the European population.
Figure
4.
The inferred pedigree of captive Brown Eared Pheasants. (A) and (B): Kinship relationship of Brown Eared Pheasant pairs in Taiyuan Zoo and Europe, respectively. The points represent sample pairs. The golden, cyan, blue and red points represent inferred first-, second-, and third-degree related, and unrelated pairs, respectively. (C) and (D): The number of pairs having different kinship relationships in Taiyuan Zoo and Europe, respectively. The golden, cyan, blue, and red bars represent inferred first-, second-, and third-degree related, and unrelated pairs, respectively. The percentages above each bar represent the proportion of the corresponding number of pairs to the total number of pairs.
The captive population of Taiyuan Zoo had an average of 13.58 (95% CI = 12.14–15.03) and 20.40 (95% CI = 18.87–21.93) homozygous and heterozygous missense variants, respectively. None of the samples from Taiyuan Zoo had the homozygous loss of function mutation, while the average number of heterozygous losses of function variants in this population was 0.60 (95% CI = 0.35–0.85). The average number of homozygous and heterozygous synonymous variants was 15.08 (95% CI = 14.21–15.96) and 37.93 (95% CI = 35.25–40.62), respectively. In the European population, the average number of homozygous and heterozygous missense variants was 44.82 (95% CI = 42.07–47.57) and 38.26 (95% CI = 34.91–41.60), respectively, while the average number of homozygous and heterozygous synonymous variants was 55.74 (95% CI = 51.53–59.96) and 59.49 (95% CI = 53.24–65.74), respectively. The average number of homozygous and heterozygous variants in this population was 1.08 (95% CI = 0.80–1.35) and 0.54 (95% CI = 0.28–0.79), respectively. The ratio of the number of homozygous missense mutations to the number of homozygous synonymous mutations was similar between the Taiyuan Zoo and European populations (Fig. 5A). However, the ratio of the number of heterozygous missense mutations to the number of heterozygous synonymous mutations in the Taiyuan Zoo population was significantly lower than that in the European population (Fig. 5A). The ratio of the number of homozygous losses of function mutations to that of homozygous synonymous mutations in the Taiyuan Zoo population was also significantly lower than that in the European population (Fig. 5B). Meanwhile, the ratio of the number of heterozygous losses of function mutations to the number of heterozygous synonymous mutations was similar between the Taiyuan Zoo and European populations (Fig. 5B).
Figure
5.
Proportion of missense and loss of function mutations relative to synonymous mutations. (A) Proportion of homozygous and heterozygous missense mutations relative to the corresponding synonymous mutations. (B) Proportion of homozygous and heterozygous loss of function mutations relative to the corresponding synonymous mutations. The light yellow and brown bars represent the corresponding values in Taiyuan Zoo and European populations, respectively. The error bar represents the 95% confidence interval. Hom represents homozygous; Het represents heterozygous; M represents missense mutations; S represents synonymous mutations; L represents loss of function mutations. The p-value was calculated by the independent sample t-test.
Understanding the genetic status of threatened species could help us identify the gene pool for conservation efforts. But it is unclear the whole genomic status of captive populations of Brown Eared Pheasant. Here, we combined non-destructive sampling and 2b-RAD technique to evaluate their genetic status. The captive population of Brown Eared Pheasants in Taiyuan Zoo showed lower genetic diversity and higher inbreeding levels than the European population (Fig. 3). Brown Eared Pheasants are raised on several farms in Europe. Because the farmers have opportunities to exchange the birds, inbreeding can be avoided in this population. However, in Taiyuan Zoo, the Brown Eared Pheasants are bred in one feedlot, which increases the opportunities for inbreeding. Frequent inbreeding may be the reason for the low genetic diversity in the Taiyuan Zoo population. It is possible that the sampling process may also contribute to the current results as the possibility of samples being collected from closely related individuals in Taiyuan Zoo cannot be ruled out. Nevertheless, we need to select non-related individuals with high genetic diversity for breeding programs.
The Brown Eared Pheasant population in Taiyuan Zoo harbors recessive lethal mutations. This population harbors heterozygous loss of function mutations (Fig. 5), which suggests that these mutations are recessive lethal mutations. The absence of homozygous loss of function mutations in this population suggests that this mutation type reduces the survival rate. The Europe population harbored homozygous loss of function mutations (Fig. 5), suggesting that this mutation type did not have a deleterious effect on the survival of this population. The European population also harbored more heterozygous missense mutations than the Taiyuan Zoo population (Fig. 5), suggesting that part of the missense mutations in the European population are recessive deleterious mutations. Accurately identifying lethal mutations in threatened species is essential for conservation efforts as it could facilitate the expansion of their populations.
The current study provides insight into conservation management for breeding and future reintroduction process of Brown Eared Pheasants. First, the Taiyuan Zoo should improve genetic diversity of breeding population because the population has low genetic diversity (Fig. 3A). Because mutations in different populations are generally different, introducing Brown Eared Pheasants from other captive populations and wild populations into Taiyuan Zoo could improve genetic diversity of the captive population. Second, it is necessary to avoid inbreeding in captive populations, because the current project found both captive populations have relatively serious inbreeding (Fig. 3B). Inbreeding will lead to accumulation of deleterious mutations in the populations (Xue et al., 2015). Last but not least, evaluating the genetic diversity, inbreeding coefficient and the missense mutations is an important task before selecting individuals for reproduction and reintroduction. Establishing genetic information archive cards of captive individuals may help managers implement the above conservation suggestions.
The workflow of the current study (Fig. 1) could be used in conservation genetics. Since trace DNA (100–200 ng) can be used for constructing 2b-RAD DNA libraries (Wang et al., 2012; Cui et al., 2015). The degraded samples, such as feathers from birds, excrement and hair from mammals, and the skin shed by reptiles, may be used for constructing 2b-RAD DNA libraries (Barbanti et al., 2020). Collecting these kinds of samples will have minimal effects on the survival of threatened species. Researchers could pick up such samples without catching animals, which is benefit for the researchers and animals. Certainly, there will be duplicate samples if we pick up scattered samples. However, the King software could identify the duplicate samples through the relationship inference (Manichaikul et al., 2010). Moreover, the programs used for analyzing 2b-RAD data are commonly used software, such as vcftools. Conservation workers do not need specialized bioinformatics skills to use these programs to analyze the genetic status of endangered species. These advantages will facilitate the widespread use of our workflow in conservation biology. Researchers will obtain population genetic parameters such as genetic diversity following the workflow in the current project (Fig. 1). The whole genomic status of captive populations of threatened species could be evaluated for conservation management using the workflow developed in current study. The current study provides a paradigm for future conservation genetic studies on endangered species based on non-destructive sampling.
Availability of data and materials
The raw sequence data reported in this paper have been deposited in the Genome Sequence Archive in National Genomics Data Center, China National Center for Bioinformation (NGDC, CNCB, https://ngdc.cncb.ac.cn/) under the BioProject PRJCA014106.
Authors' contributions
PW conceived the experiments, analyzed the data, wrote the manuscript, and reviewed the drafts; PH and JZ analyzed the data and revised the drafts; LZ collected the samples; JZ and ZZ conceived and designed the experiments, and reviewed drafts of the paper. All authors read and approved the final manuscript.
Ethics statement
This study was examined and approved by the National Forestry and Grassland Administration of China and the Ethics and Animal Welfare Committee at the College of Life Science, Beijing Normal University, China (Approval Number CLS-EAW-2015-012).
Declaration of competing interest
The authors declare the following financial interests/personal relationships which may be considered as potential competing interests: Zhengwang Zhang reports financial support was provided by National Natural Science Foundation of China. Pengcheng Wang reports financial support was provided by Priority Academic Program Development of Jiangsu Higher Education Institutions, China. Jing Zhang reports financial support was provided by Beijing Zoo Management Office, China.
Acknowledgements
We give our best thanks to John Corder, World Pheasant Association (WPA), UK, and Ivan Roels, WPA, Benelux, for their help in collecting the samples in Europe. We also appreciate the WPA members who provided the samples for the project.
Alatalo RV, Lundberg A, Glynn C. Female pied flycatchers choose territory quality and not male characteristics. Nature. 1986;323:152-153
Amar, A., Hewson, C.M., Thewlis, R.M., Smith, K.W., Fuller, R.J., Lindsell, J.A., et al., 2006. What’s Happening to Our Woodland Birds?. Joint Report by the Royal Society for the Protection of Birds and the British Trust for Ornithology, Sandy and Thetford.
Bengtsson J, Nilsson SG, Franc A, Menozzi P. Biodiversity, disturbances, ecosystem function and management of European forests. For Ecol Manag. 2000;132:39-50
Bertolino S, Montezemoloa NC, Perrone A. Habitat use of coexisting introduced eastern cottontail and native European hare. Mamm Biol. 2013;78:235-240
Both C, van Turnhout CAM, Bijlsma RG, Siepel H, Van Strien AJ, Foppen RPB. Avian population consequences of climate change are most severe for long-distance migrants in seasonal habitats. Proc R Soc B. 2010;277:1259-1266
Briggs KB, Deeming DC. Use of materials in nest construction by Pied Flycatchers Ficedula hypoleuca reflects localized habitat and geographical location. Bird Study. 2016;63:516-524
Briggs KB, Mainwaring MC. Habitat geology influences intraspecific variation in the speckling patterns of Blue Tit Cyanistes caeruleus and Great Tit Parus major eggs. Acta Ornithol. 2017;52:11-20
Briggs KB, Mainwaring MC. Experimental evidence of non-random nest material selection in Pied Flycatchers. Behav Process. 2019;164:59-64
Brockerhoff EG, Barbaro L, Castagneyrol B, Forrester DI, Gardiner B, Gonzalez-Olabarria JR, et al. Forest biodiversity, ecosystem functioning and the provision of ecosystem services. Biol Cons. 2017;26:3005-3035
Buesching CD, Newman C, Jones JT, Macdonald DW. Testing the effects of deer grazing on two woodland rodents, bankvoles and woodmice. Basic Appl Ecol. 2011;12:207-214
Bugalho MN, Ibanez I, Clark JS. The effects of deer herbivory and forest type on tree recruitment vary with plant growth stage. For Ecol Manag. 2013;308:90-100
Chapman NG, Claydon K, Claydon M, Harris S. Distribution and habitat selection by muntjac and other species in a coniferous forest. Acta Theriol. 1985;30:287-303
Chollet S, Martin J-L. Declining woodland birds in North America: should we blame Bambi? Divers Distrib. 2013;19:481-483
Corbet, G.B., Harris, S., 1991. The Handbook of British Mammals, third ed. Blackwell Scientific Publications, London.
Emmering QC, Kelly JK, Ostfeld RS, Schmidt KA. Variation in coexisting birds to exploit spatial heterogeneity in small mammal activity. J Avian Biol. 2018;49:e01946
Fuller RJ. Responses of woodland birds to increasing numbers of deer: a review of evidence and mechanisms. Forestry. 2007;74:280-298
Fuller RJ, Gill RMA. Ecological impacts of increasing numbers of deer in British woodland. Forestry. 2001;74:193-199
Fuller RJ, Smith KW, Grice PV, Currie FA, Quine CP. Habitat change and woodland birds in Britain: implications for management and future research. Ibis. 2007;149:261-268
Fuller, R.J., Smith, K.W., Hinsley, S.A., 2012. Temperate western European woodland as a dynamic environment for birds: a resource-based view. In: Fuller, R.J. (Ed.), Birds and Habitat: Relationships in Changing Landscapes. Cambridge University Press, Cambridge, pp. 352–380.
Gill RMA, Beardall V. The impact of deer on woodlands: the effects of browsing and seed dispersal on vegetation structure and composition. Forestry. 2001;74:209-218
Goodenough AE, Elliot SL, Hart AG. The challenges of conservation for declining migrants: are reserve-based initiatives during the breeding season appropriate for the Pied Flycatcher Ficedula hypoleuca? Ibis. 2009;151:429-439
Gregory RD, Vorisek P, van Strien A, Gmelig Meyling AW, Jiguet F, Fornasari L, et al. Population trends of widespread woodland birds in Europe. Ibis. 2007;149:78-97
Hawkes RW, Smart J, Brown A, Jones H, Lane S, Wells D, et al. Multi-taxa consequences of management for an avian umbrella species. Biol Conserv. 2019;236:192-201
Hemami MR, Watkinson AR, Dolman PM. Habitat selection by sympatric muntjac (Muntiacus reevesi) and Roe Deer (Capreolus capreolus) in a lowland commercial pine forest. For Ecol Manag. 2004;194:49-60
Hemami MR, Watkinson AR, Dolman PM. Population densities and habitat associations of introduced muntjac Muntiacus reevesi and native Roe Deer Capreolus capreolus in a lowland pine forest. For Ecol Manag. 2005;215:224-238
Hewson CM, Amar A, Lindsell JA, Thewlis RM, Butler S, Smith K, et al. Recent changes in bird populations in British broadleaved woodland. Ibis. 2007;149:14-28
Hewson CM, Noble DG. Population trends of breeding birds in British woodlands over a 32-year period: relationships with food, habitat use and migratory behaviour. Ibis. 2009;151:464-486
Holt CA, Fuller RJ, Dolman PM. Breeding and post-breeding responses of woodland birds to modification of habitat structure by deer. Biol Cons. 2011;144:2151-2162
Jiang G, Zhang M, Ma J. Effects of human disturbance on movement, foraging and bed selection in red deer Cervus elaphus xanthopygus from the Wandashan Mountains, northeastern China. Acta Theriol. 2007;52:435-446
Joys AC, Fuller RJ, Dolman PM. Influences of deer browsing, coppice history and standard trees on the growth and development of vegetation structure in coppiced woods in lowland England. For Ecol Manag. 2004;202:23-37
Kirby KJ. The impact of deer on the ground flora of British woodland. Forestry. 2001;74:219-230
Lambrechts MM, Adriaensen F, Ardia DR, Artemyev AV, Atienzar F, Banbura J, et al. The design of artificial nestboxes for the study of secondary hole-nesting birds: a review of methodological inconsistencies and potential biases. Acta Ornithol. 2010;45:1-26
Linnell JDC, Nilsen EB, Andersen R. Selection of bed-sites by Roe Deer Capreolus capreolus fawns in an agricultural landscape. Acta Theriol. 2004;49:103-111
Martin PR, Martin TE. Ecological and fitness consequences of species coexistence: a removal experiment with Wood Warblers. Ecology. 2001;82:189-206
Millspaugh JJ, Raedeke KJ, Brundige GC, Willmott CC. Summer bed sites of Elk (Cervus elaphus) in the Black Hills, South Dakota: considerations for thermal cover management. Am Midl Nat. 1998;139:133-140
Morecroft MD, Taylor ME, Ellwood SA, Quinn SA. Impacts of deer herbivory on ground vegetation at Wytham Woods, central England. Forestry. 2001;74:251-257
Muller A, Dahm M, Boecher PK, Root-Bernstein M, Svenning J-C. Large herbivores in novel ecosystems - habitat selection by red deer (Cervus elaphus) in a former brown-coal mining area. PLoS One. 2017;12:e0177431
Mysterud A. Bed site selection by adult Roe Deer Capreolus capreolus in southern Norway during summer. Wildlife Biol. 1996;2:101-106
Palomares F, Fernandez N, Roques S, Chavez C, Silveira L, Keller C, et al. Fine-scale habitat segregation between two ecologically similar top predators. PLoS One. 2016;11:e0155626
Perrins CM, Overall R. Effect of increasing numbers of deer on bird populations in Wytham Woods, central England. Forestry. 2001;74:299-309
Rodwell, J.S., 1991. British Plant Communities, vol. 1. Cambridge University Press, Cambridge.
Sakata Y, Michimasa Y. Deer overbrowsing on autumn-flowering plants causes bumblebee decline and impairs pollination service. Ecosphere. 2015;6:274
Samplonius JM, Both C. Competitor phenology as a social cue in breeding site selection. J Anim Ecol. 2017;86:615-623
Samplonius JM, Kromhout Van Der Meer IM, Both C. Nest site preference depends on the relative density of conspecifics and heterospecifics in wild birds. Front Zool. 2017;14:56
Silva JS, Catry FX, Moreira F, Bugalo MN. The effects of deer exclusion on the development of a Mediterranean plant community affected by a wildfire. Restor Ecol. 2015;23:760-767
Tolvanen J, Seppanen J-T, Monkkonen M, Thomson RL, Ylonen H, Forsman JT. Interspecific information on predation risk affects nest site choice in a passerine bird. BMC Evol Biol. 2018;18:181
Tremblay I, Thomas D, Blondel J, Perret P, Lambrechts MM. The effect of habitat quality on foraging patterns, provisioning rate and nestling growth in Corsican Blue Tits Parus caeruleus. Ibis. 2005;147:17-24
Wilkin TA, King LE, Sheldon BC. Habitat quality, nestling diet, and provisioning behaviour in Great Tits Parus major. J Avian Biol. 2009;40:135-145


 DownLoad:


 Email Alerts
 RSS Feeds