Wendong Xie, Kai Song, Siegfried Klaus, Jon E. Swenson, Yue-Hua Sun. 2022: The past, present, and future of the Siberian Grouse (Falcipennis falcipennis) under glacial oscillations and global warming. Avian Research, 13(1): 100009. DOI: 10.1016/j.avrs.2022.100009
Citation:
Wendong Xie, Kai Song, Siegfried Klaus, Jon E. Swenson, Yue-Hua Sun. 2022: The past, present, and future of the Siberian Grouse (Falcipennis falcipennis) under glacial oscillations and global warming. Avian Research, 13(1): 100009. DOI: 10.1016/j.avrs.2022.100009
Wendong Xie, Kai Song, Siegfried Klaus, Jon E. Swenson, Yue-Hua Sun. 2022: The past, present, and future of the Siberian Grouse (Falcipennis falcipennis) under glacial oscillations and global warming. Avian Research, 13(1): 100009. DOI: 10.1016/j.avrs.2022.100009
Citation:
Wendong Xie, Kai Song, Siegfried Klaus, Jon E. Swenson, Yue-Hua Sun. 2022: The past, present, and future of the Siberian Grouse (Falcipennis falcipennis) under glacial oscillations and global warming. Avian Research, 13(1): 100009. DOI: 10.1016/j.avrs.2022.100009
Global climate change has a significant effect on species, as environment conditions change, causing many species' distributions to shift. During the last three million years, the earth has experienced glacial oscillations, forcing some species to survive in ice-free refugia during glacial periods and then disperse postglacially. In this study, by assessing the potential distribution of Siberian Grouse (Falcipennis falcipennis), we used Global Circular Models and Representative Concentration Pathways to model their pattern of range changes during glacial oscillations and the potential impact of present global warming. We used 158 location records of Siberian Grouse to generate a full climate model using 19 bioclimate variables in MaxEnt. We discarded variables with a correlation coefficient larger than 0.8 and relatively lower modeling contributions between each pair of correlated variables. Using the remaining variables, we created a normally uncorrelated simple climate model to predict the possible distribution of Siberian Grouse from the most recent Ice Age to present and to 2070. Then we added geographical data and the human interference index to construct a multiple factor full model to evaluate which were important in explaining the distribution of Siberian Grouse. The Total Suitability Zone (P ≥ 0.33) of Siberian Grouse is about 243,000 km2 and the Maximum Suitability Zone (P ≥ 0.66) is 36,000 km2 and is confined to the Russian Far East. Potential habitat modeling suggested that annual precipitation, annual mean temperature, and the distance from lakes are the most explanatory variables for the current distribution of Siberian Grouse. The distribution center moved to the southeast during the Last Glacial Maximum and spread back to the northwest after the ice melted and temperatures rose. The total area range of Siberian Grouse experienced a dramatic loss during the Last Glacial Maximum. Global warming is presently forcing the Siberian Grouse to migrate northward with a contraction of its range. There is an urgent need to protect its habitat, because little of its Maximum Sustainable Zone is protected, although there are some large reserves in that area.
Global climate has undergone rapid and significant changes since the Last Glacial Maximum (LGM, 26,000–19,000 years before present (BP)), with the maximum extent of ice sheets and cold conditions prevailing for more than 4500 years in East Asia, ending in a relatively warmer period during the Mid-Holocene (MID) (Clark et al., 2009). These relatively rapid and evident changes of climatic oscillations had a significant effect on biodiversity, including species' abundance and occupied ranges (Parmesan and Yohe, 2003; Parmesan, 2006). Climate has played a crucial role in defining the overall geographical pattern of biodiversity over time and space (Singh et al., 2020). As the climate changes, the species will have to adapt accordingly or migrate to other suitable environments (Hutchinson, 1959; Araújo et al., 2005; Guisan and Thuiller, 2005). Due to significant ecological niche changes during the rapidly changing climate conditions at the end of Pleistocene, a great number of species that were unable to adapt quickly enough became extinct or extremely rare, with restricted distributions (Prates and Perez, 2021).
Species inhabiting subarctic areas are particularly sensitive to climate change (Zhou et al., 2001; Bogaert et al., 2002; Lloyd et al., 2002; Lloyd and Fastie, 2003) and their distribution and population size can be severely reduced, if the climate they have adapted to no longer exists, due to climate warming (Hof et al., 2017). However, there are few studies on how population sizes and distributions of subarctic species change due to climatic oscillations and why some species have experienced minor negative effects and have dispersed rapidly after the glacial maximum period, whereas sibling species have become limited and relic species. In addition, according to the Intergovernmental Panel on Climate Change (IPCC) reports (Farias and Svensson, 2014), the world is currently experiencing an ongoing global warming with temperatures increasing by a minimum of 0.3–1.7 ℃ to a maximum of 2.6–4.8 ℃ by the end of the 21st century (Intergovernmental Panel on Climate, 2014; Zhao et al., 2020). This is an important and significant factor affecting not only the global distribution of birds (Hu et al., 2020), but also plants and other organisms (Fitzpatrick et al., 2013; Scheper et al., 2013; Dai et al., 2020). Establishing natural protected areas is often used as a strategy for species' conservation, but considering future regional changes (Tang et al., 2017), it will be crucial and instrumental for the protection of endangered species to precisely assess their potential distributional shifting (Parmesan and Yohe, 2003; Root et al., 2003; Opdam and Wascher, 2004).
Species distribution models (SDMs) have become a popular and widely used method to analyze and map the potential distribution of flora and fauna (Berry et al., 2004; Fitzpatrick et al., 2013), using a combination of species observation data and environmental variables to model past and future distribution shift (Summers et al., 2012; Brown and Yoder, 2015; Zacarias and Loyola, 2018). This has been applied to many avian species (Herkert, 1995; Engler et al., 2017; Prieto-Torres et al., 2020) and used for avian conservation purposes (Rodríguez et al., 2007). To simulate past and future climate, studies have relied on Global Circulation Models (GCMs), using the Global Climate Model and the Dynamic Ice Sheet Model, to simulate paleoclimate conditions (Otto-Bliesner et al., 2006) or different greenhouse gases concentrations, represented by Representative Concentration Pathways (RCPs) (Pachauri et al., 2014), to construct future climatic scenarios, attempting to account for all the physical and chemical processes influencing climate (Urvois et al., 2021). Different GCMs of past and future (with different RCPs) are available to explore the uncertainty and confidence of distribution estimates.
The Siberian Grouse (Falcipennis falcipennis) is endemic to a restricted range in far eastern Russia (Klaus and Andreev, 2003; Ludwig and Konovalenko, 2012). Its distribution range and population size are declining and it is listed as near threatened (NT) on the Red List of the International Union for Conservation of Nature (IUCN; latest assessment in 2016), due to forest fires and logging in the dense conifer forest that the grouse prefer (BirdLife International, 2017). Recent studies concluded that the Siberian Grouse is extinct in China, as there have been no records of its occurrence there for more than 35 years, as documented in National Red Data Books of China and Russia (Zheng and Wang, 1998; Klaus and Andreev, 2003). Compared to its sibling species Spruce Grouse (Canachites canadensis) in North America (Kimball et al., 2011, 2021; Persons et al., 2016), the Siberian Grouse is very rare, with estimated densities of 6–8 birds per km2 (Andreev et al., 2001; Andreev and Hafner, 2011), and is restricted to the Amurland taiga of East Siberia. It is strongly dependent on specific plants, like Ajan Spruce (Picea abies) (Klaus et al., 2018), Hinggan Fir (Abies nephrolepis), Dahurian Larch (Larix gmelinii), and Korean Pine (Pinus koraiensis) (Klaus and Andreev, 2003; Andreev and Hafner, 2011). This indicates that the grouse is particularly vulnerable to niche shifts related to climate change and forest clearcutting (Kondrashov, 2004; Konovalenko, 2012).
A study of the mitochondrial DNA phylogeny of grouse concluded that the Siberian Grouse was found to be closely related to its sibling Spruce Grouse species. However, a vicariance event, the rise of the Bering Sea, split a previously continuous falcipennis/canadensis stock, which originated during the lower Pleistocene (2,430,000–730,000 years BP), into two reproductively isolated populations (Lucchini et al., 2001). However, we do not know how the present geographical pattern of Siberian Grouse was affected by glacial oscillations and dispersal (Storch, 2007), nor whether the Siberian Grouse will be affected by the ongoing global warming.
To attempt to clarify these questions and determine how the Siberian Grouse's restricted distribution range was formed, we used the species distribution modeling method, applying models of climate change to the Pleistocene, and a repeated cold and warm loop, due to the “expansion and contraction” pattern of the glacial and interglacial period (Dong et al., 2017), particularly in three historical periods, Last interglacial, the Last Glacial Maximum and Mid-Holocene. We simulated the shifting of the grouse's potential historical distributions and applied different scenarios of future climate change in 2050 and 2070 to evaluate the impact of global warming (Wang and Overgaard, 2007). Considering the restricted distribution range and low density of Siberian Grouse with the deficiency of available occurrence records for the construction of SDMs, we chose the maximum entropy (MaxEnt) species distribution model. This is a well-suited model for species distribution modeling, compared to many other models (Phillips et al., 2006; Elith et al., 2006; Hijmans and Graham, 2006), and uses present-only data and environmental variables to simulate a species' potential distribution (Phillips et al., 2006). In this study, we intended to: 1) predict the Siberian Grouse's current potential sustainable distribution; 2) produce models with paleoclimatic variables to illustrate the grouse's diffusion and the formation of today's geographical pattern; 3) determine the impact of global warming on the grouse's potential distribution shift in 2050 and 2070 by adding multiple bioclimatic variables and multiple abiotic variables to the model; 4) identify multiple important factors impacting its distribution; and 5) provide insight that can be used for the protection of Siberian Grouse habitats and populations.
2.
Materials and methods
2.1
Species occurrence and study area
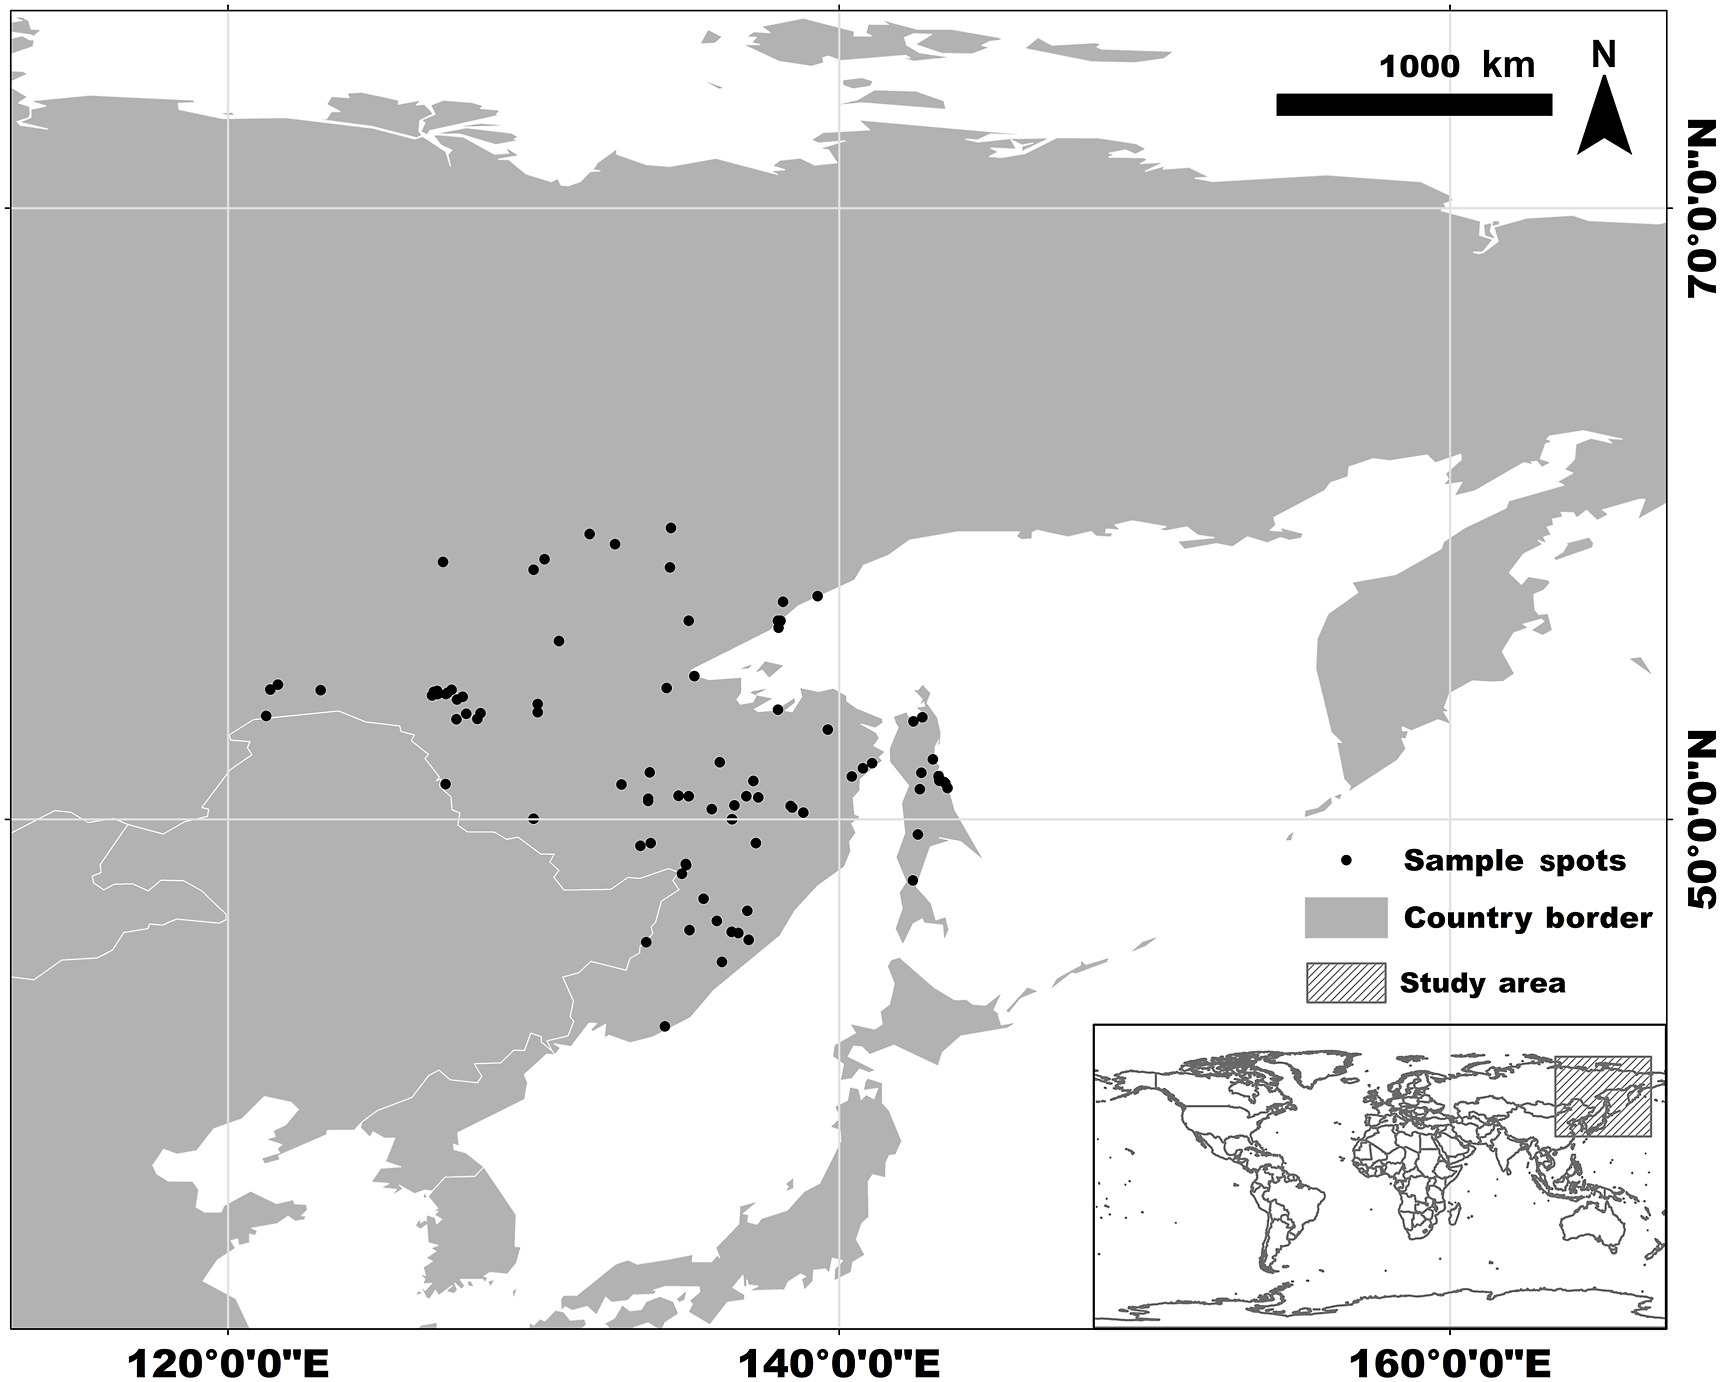
We collected 158 records of Siberian Grouse occurrence from the Global Biodiversity Information Facility (GBIF, 2021), bird watchers' reports, and published literature (Klaus and Andreev, 2003). After removing duplicated data by keeping one occurrence record per raster (2.5 arc-min), and deleting locations where grouse obviously do not exist, like in the ocean, using ArcGIS10.7 (Esri, Redlands, California, USA) and Google Earth, we ended up with 93 occurrence records that were restricted to the range of far eastern Russia and outside Northeast China (see Appendix Table S1). To include all of the occurrence records, to simulate the shifting distribution of the Siberian Grouse, and to reduce the uncertainty of the model predictions (Anderson and Raza, 2010; Acevedo et al., 2012), we chose a moderate study region of 30–80° N, 110–170° E, including northeastern China and Siberia and the Far East in Russia (Fig. 1).
Figure
1.
Study area and species occurrences of Siberian Grouse. The main figure shows the entire study area, which is also shown in the thumb panel in the hatched area.
We obtained the dataset of climate variables from WorldClim and modified it in ArcGIS. We obtained 19 bioclimate variables from Worldclim1.4 (WorldClim Version1, 2021) at a spatial resolution of 2.5 arc-min (about 4.5 km) representing LGM, MID, and Current and Future climate scenarios for 2050 and 2070. For the LIG (∼120–140 Kya) we downloaded data at a resolution of 30 arcsec and then transferred them to the resolution of 2.5 arc-min using ArcGIS10.7. We generated Paleoclimatic data from the Community Climate System Model (CCSM) and obtained future climate data for 2050 and 2070 from WorldClim with two Global Circular Models (GCMs), CCSM4 and GISS-E2-R, and two Representative Concentration Pathways (RCPs), RCP26, the most “benign” scenario, and RCP85, the most extreme scenario, as two future carbon emissions affecting the global warming scenario to simulate distribution change in the future. Slope and aspect data were generated from DEM data from WorldClim using ArcGIS10.7 and SDMToolbox v2.4 (Brown et al., 2017). The DEM data were used as the Altitude variable.
In order to assess human influence on the distribution of Siberian Grouse, we used the Human Influence Index (HII; WCS and CCU, 2005), which is a combined assessment of human-induced pressures on ecosystems, such as urban extent, human population density, and land cover, ranging from pristine to degraded (0–64). Data on global coastline, lakes, railways, rivers, and human populated places were downloaded from Natural Earth Dataset (Natural Earth, 2021), then we calculated Euclidean Distance for each variable in ArcGIS 10.7. The land use and land cover type used by the Siberian Grouse was analyzed with LULC data, acquired from IFORCE, GLC2000 (https://forobs.jrc.ec.europa.eu/products/glc2000/products.php). All environmental layers were transformed into 2.5 arc-min (about 4.5 km) spatial resolution.
2.3
SDM construction and evaluation
We modeled the species' distribution with MaxEnt (version 3.4.4; Phillips et al., 2021), in which the logistic output was selected to represent the probabilities of occurrence of the target species, with suitability values ranging from 0 to 1, using the subsample method (replicate sample sets chosen by removing random test percentage without replacement to be used for evaluation), with ten replicates averaged to assess the performance of each model. The whole presence records were partitioned as 80% training data and 20% testing data during each replicate.
Variables with correlation coefficients larger than 0.8 and relatively lower modeling contributions between each pair of correlated variables were discarded by generating a full climate model (climate model) using 19 bioclimate variables and using ArcGIS10.7 to calculate the correlation coefficient of each pair of the 19 bioclimates. With the rest of the variables, we created a normally uncorrelated model (simple climate model) to predicate the possible distribution of Siberian Grouse. Then we added geographical data and the human interference index (see Appendix Table S2) to construct a multiple factors model (full model) to evaluate the important factors related to the distribution of Siberian Grouse.
During the modeling process, we selected the jackknife analysis of the regularized gain with training data to examine the importance of different predictors and the area under the curve (AUC) of receiver operating characteristics (ROC; Fielding and Bell, 1997) to assess the accuracy of different models. The continuous distribution probability maps were reclassified into four classes; unsuitable zone (P < 0.05), low suitability zone (0.05 ≤ P < 0.33), suitability zone (0.33 ≤ P < 0.66), and maximum suitability zone (P ≥ 0.66), according to the possibility assessment method of future climate change from the International Panel of Climate Change (IPCC; Duan and Zhou, 2011), to analyze spatial range dynamics through time using the SDMToolbox v2.4.
3.
Results
3.1
Model evaluation and determination of important environmental variables
The three models, climate model, simple climate model, and full model, all provided excellent fits for Siberian Grouse data, with model AUCs of 0.94, 0.93, and 0.93, respectively. According to the MaxEnt modeling results, Bio12 and Bio1 were the most explanatory variables in both the simple climate model and full models, with the distance from a lake as the most contributing topographic variable (Table 1). From the results of the jackknife test of variable importance, the environmental variable with the highest gain when used in isolation was Bio12, suggesting that annual precipitation data had the most useful information by itself. The environmental variable that decreased the gain the most when omitted was Bio1, suggesting that annual mean temperature data had the most information that was not present in other variables. The evaluation values were averages over ten replicate runs for each model.
Table
1.
The contribution of environmental variables to the simple climate model and full model.
The distribution of Siberian Grouse apparently experienced huge changes due primarily to climate variables, but were also affected by other factors, like topographic and human influences. So, we constructed the full model to evaluate the importance of various factors to see how they affected the northward movement. We found that the spread of Siberian Grouse was confined by topographical and human influences, and, instead of becoming more geographically dispersed, the total distribution range decreased.
The Jackknife test of the full model showed that, besides the two most important climate variables Bio12 and Bio1, the distance from a lake, probably correlated with the need of water, also played an important role in modeling the distribution of Siberian Grouse. We found that the Siberian Grouse was adapted to a narrow range of precipitation and preferred staying near lakes. Siberian Grouse also preferred low HII, steeper slopes, and relayed on coniferous, deciduous, or mixed forests (see Appendix Fig. S1).
3.2
Spatial distribution shift under climate change
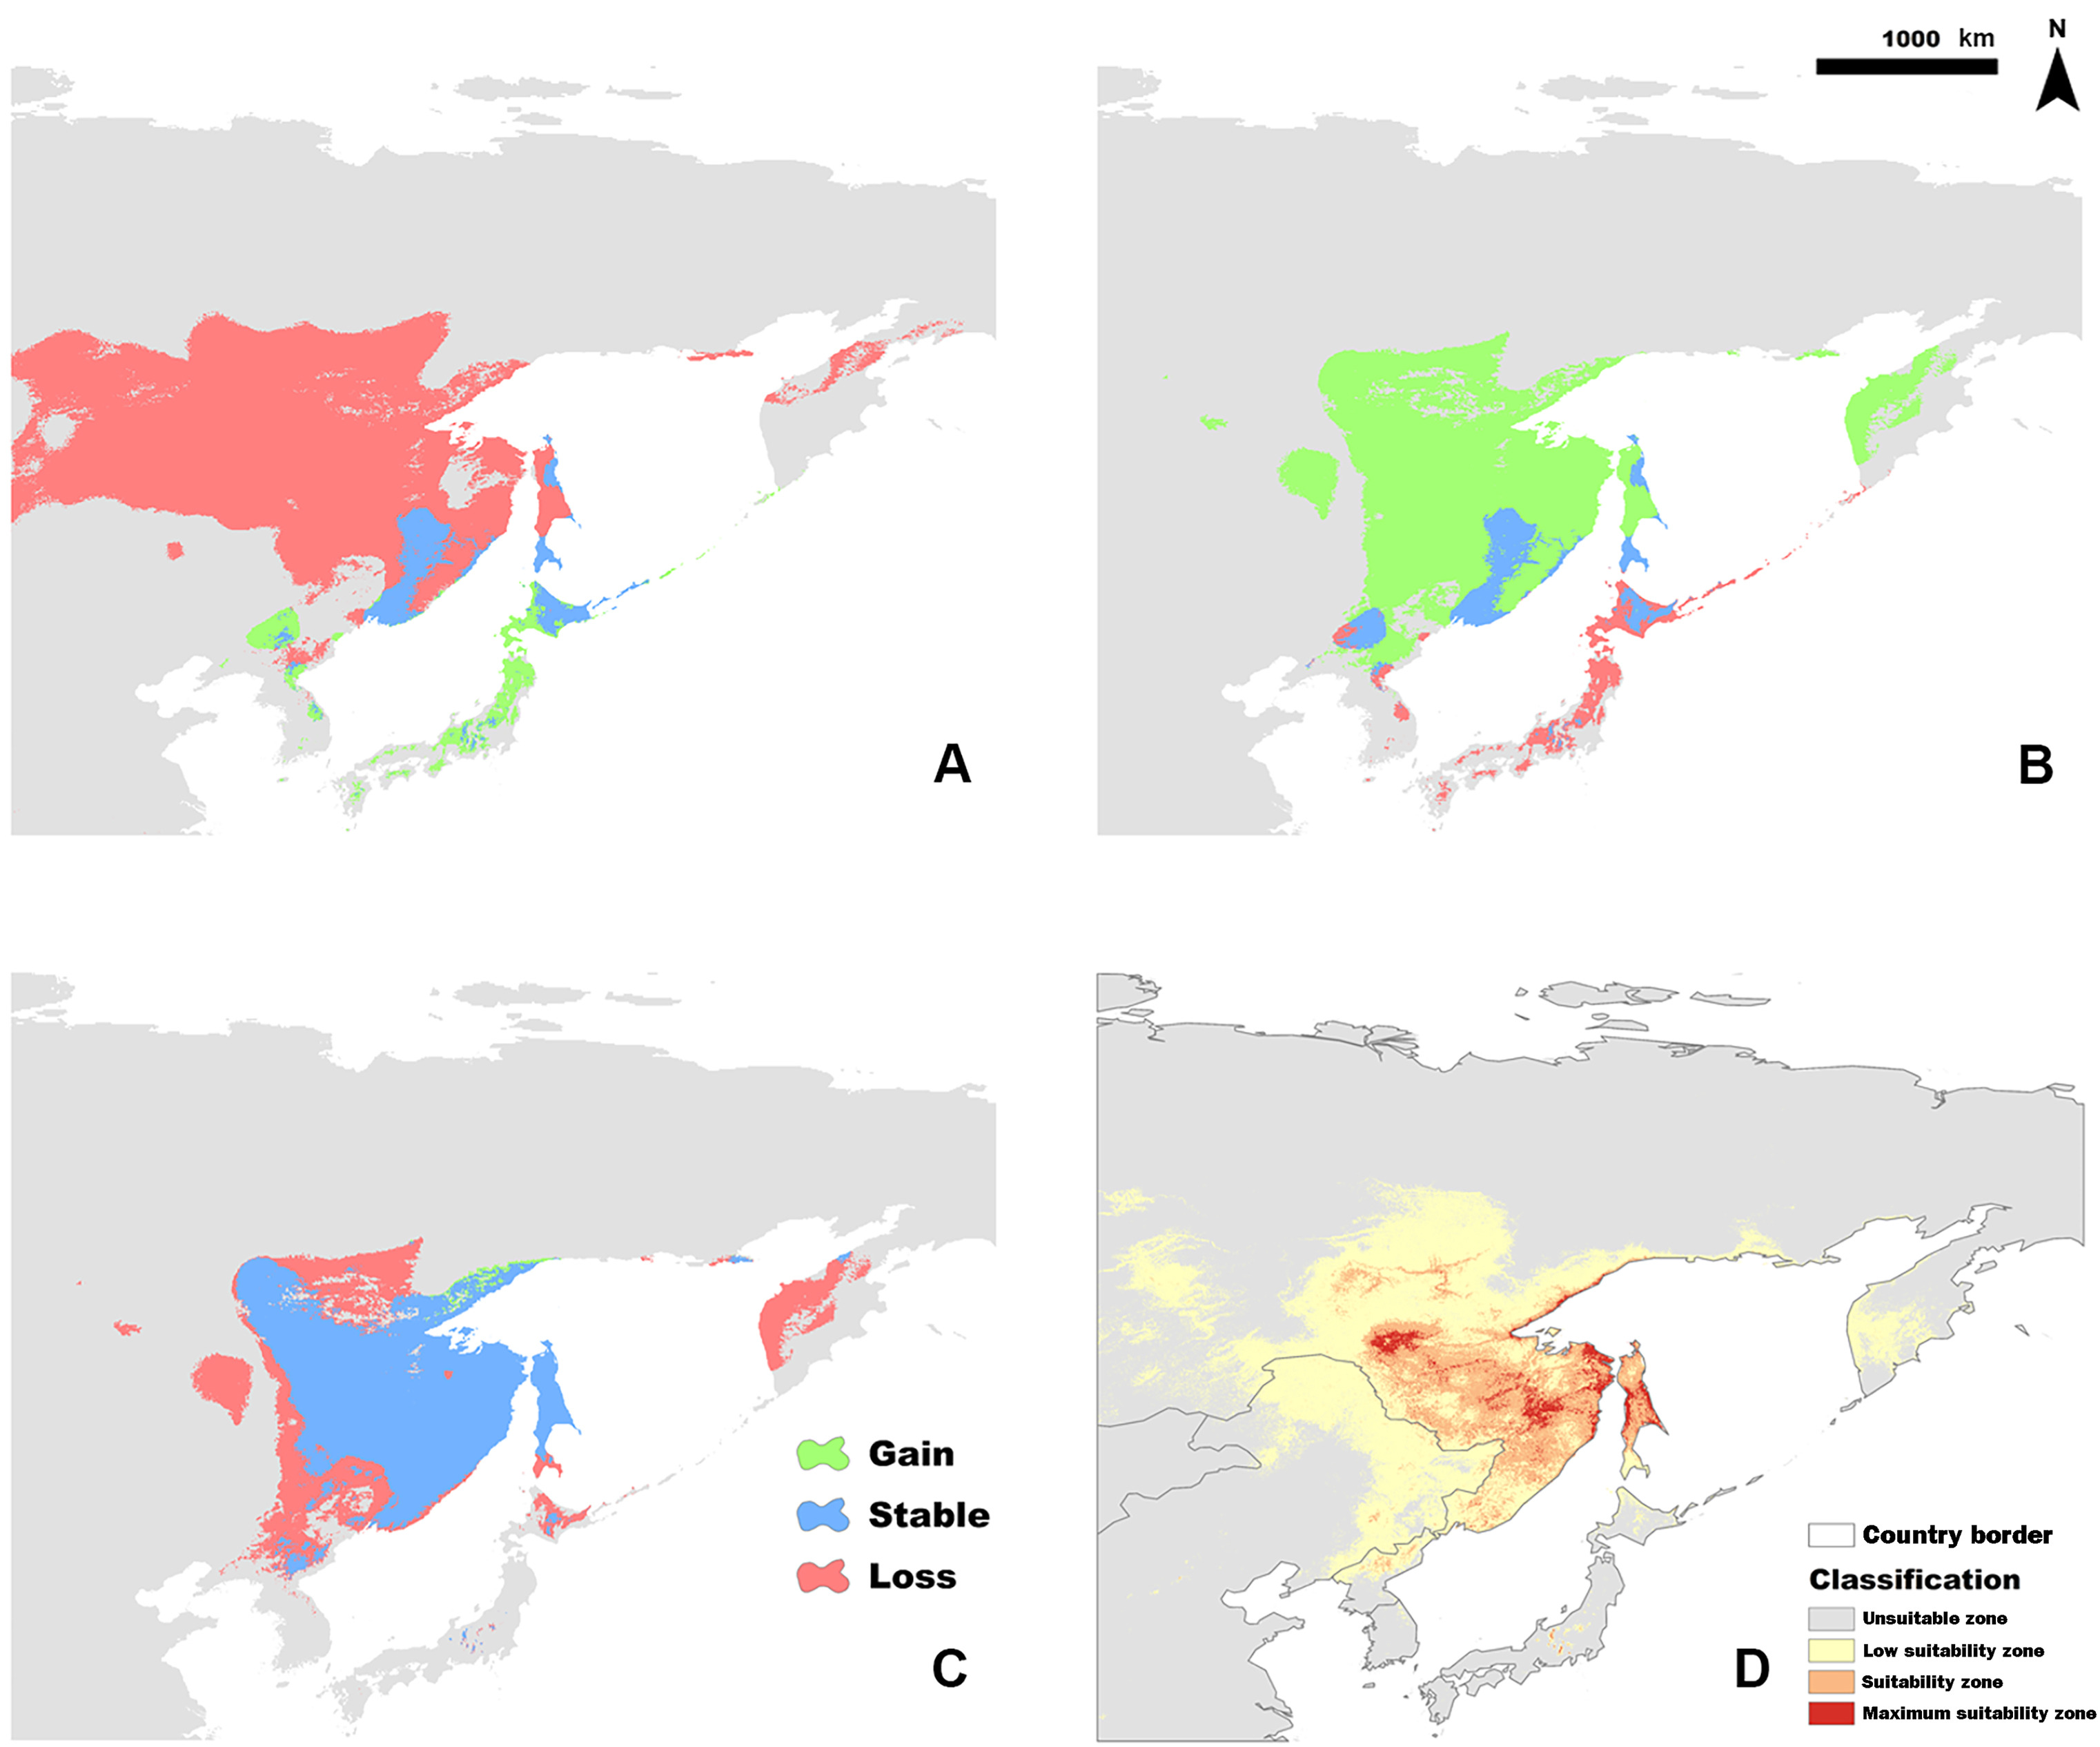
The current suitable habitat, determined from the full model (Fig. 2D) was extremely restricted to the far east of Russia, including Khabarovsk Territory, the Amur Region, and the Sakhalin Region, which is consistent with the literature. The calculated total suitability zone (P ≥ 0.33) of the Siberian Grouse was 243,342 km2 and the Maximum Suitability Zone was 35,833 km2 in the full model.
Figure
2.
The binary distribution change of Siberian Grouse in the simple climate model between LIG-LGM (A), LGM-MID (B) and MID-CUR (C). Loss of habitat is shown in red, stable habitat in blue, and newly gained range in green. The current potential distribution of Siberian Grouse in the full model is shown in the reclassified map (D) (Unsuitable zone (P < 0.05), Low suitability zone (0.05 ≤ P < 0.33), Suitability zone (0.33 ≤ P < 0.66) and Maximum suitability zone (P ≥ 0.66)).
In order to determine how glacial oscillations influenced the potential distribution of Siberian Grouse, the binary distribution maps of the three paleoclimate periods were calculated to show the variation of the occurrence range in different colors by SDMtoolbox (Fig. 2A–C). Under the climate of LIG period, the distribution of Siberian Grouse was relatively more dispersed, but as the glacial climate in LGM covered the vast land of north Asia, the dramatic climate change forced Siberian Grouse to find a glacial refugium with a suitable climate. According to the projection of the simple climate model into the LGM period, we found that the refugium was around the Sakhalin Region and northern Japan, from where, as the temperature rose into the MID period, the grouse gradually spread back to the inner continent.
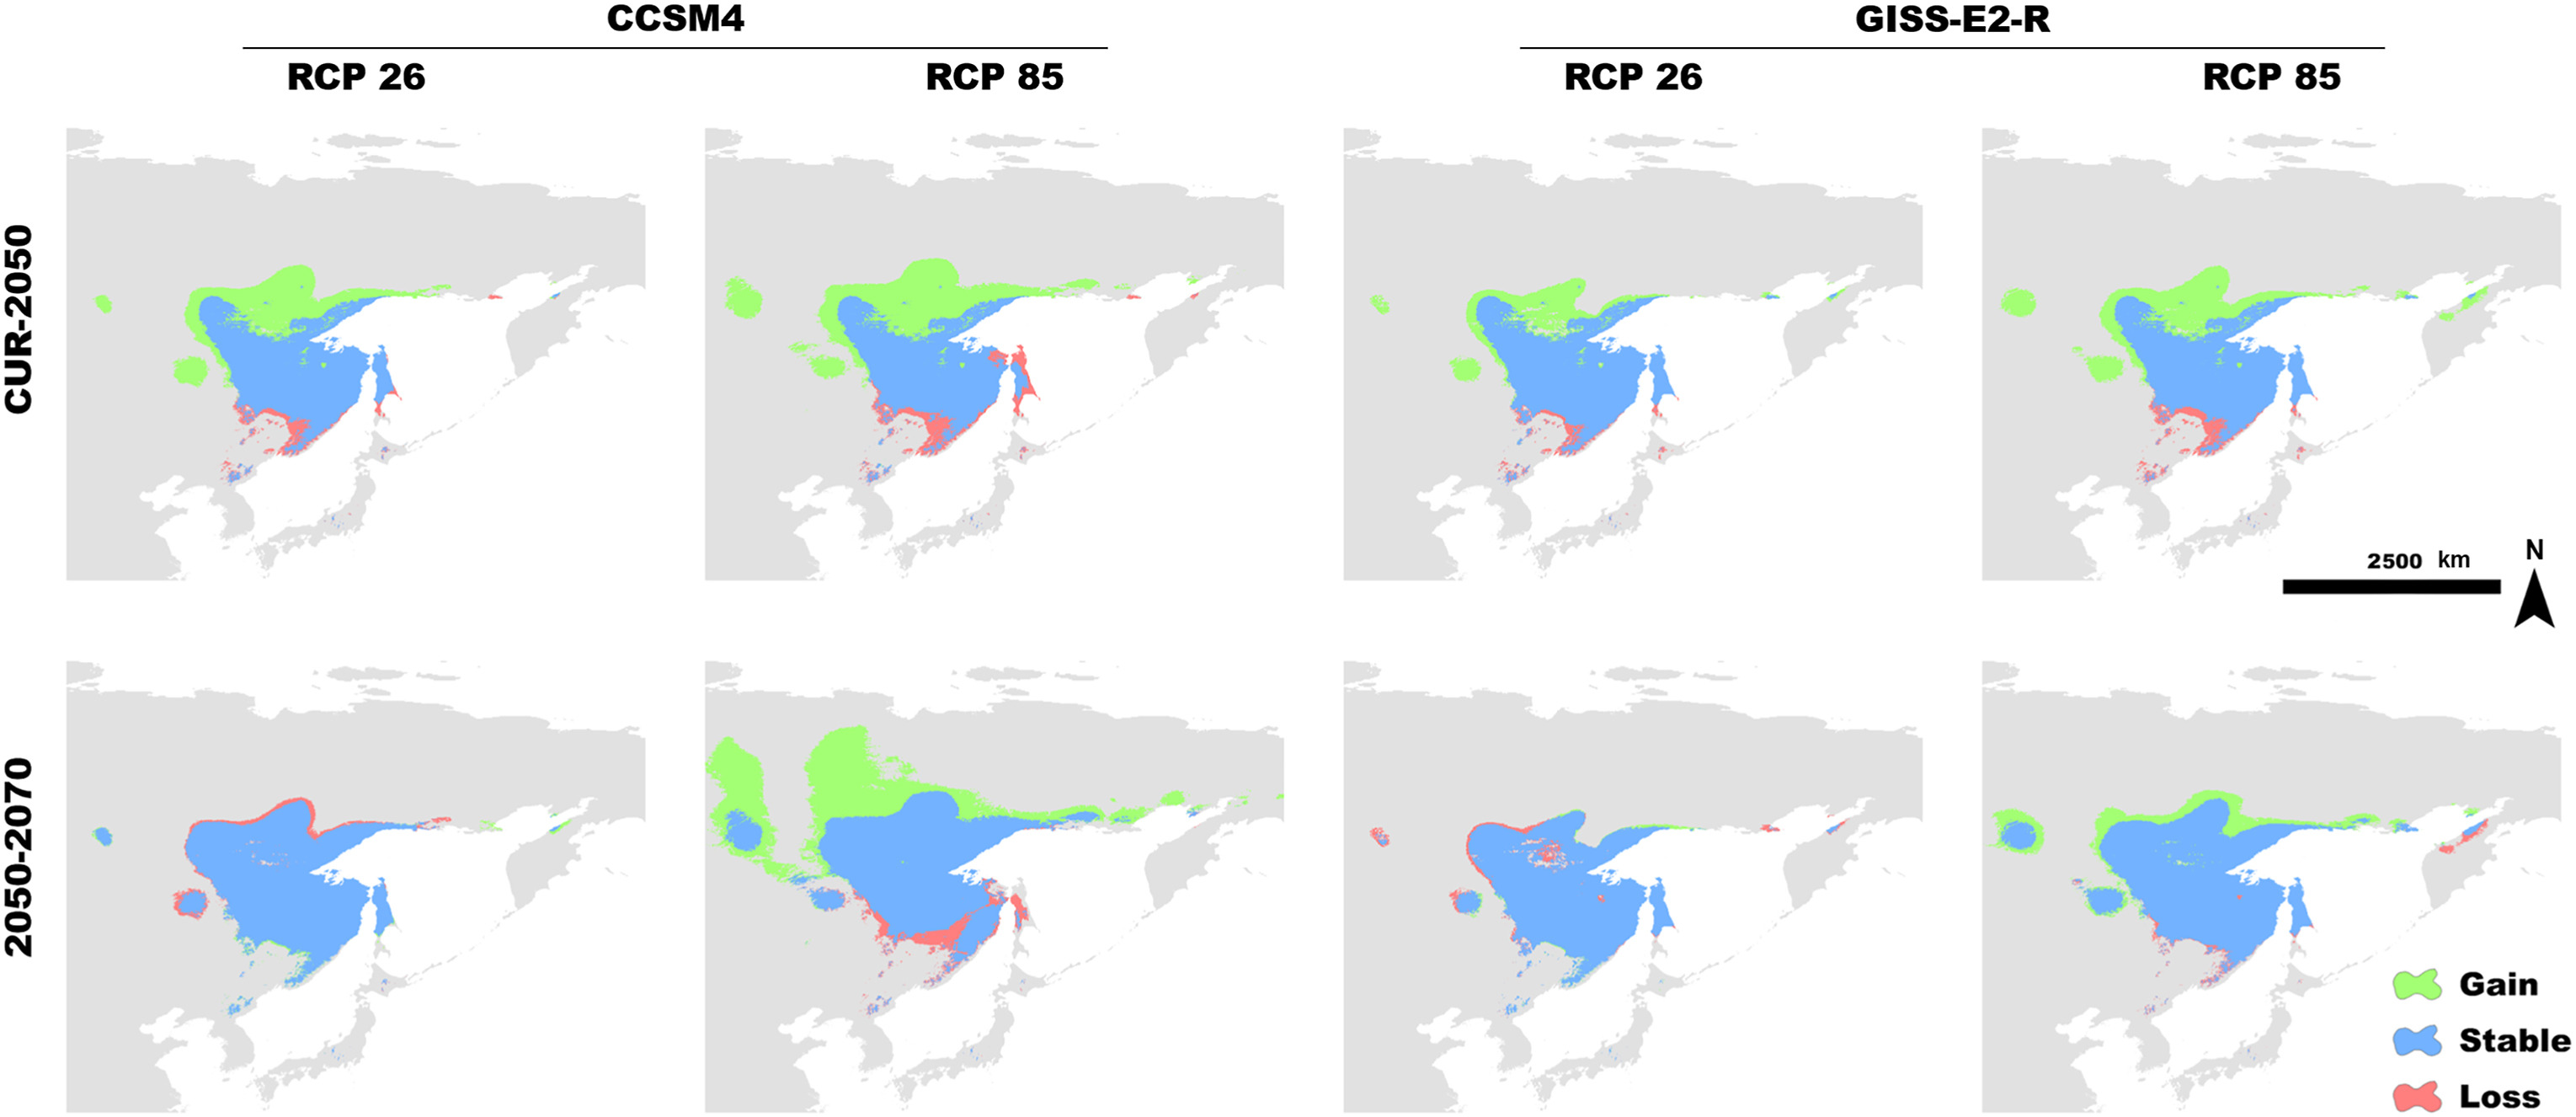
By projecting the simple climate model into the future, we analyzed the effect of global warming on the distribution of Siberian Grouse. The result of the model showed that, as the temperatures rose, the potential suitable habitat for Siberian Grouse became larger from now to 2050 and 2070, and the newly gained distribution was mainly in the north portion of its range, indicating that the Siberian Grouse would tend to move north to find suitable habitat (Fig. 3).
Figure
3.
Binary distribution change of Siberian Grouse in the simple climate model between the current time and 2050 and 2070 under two Global Climate Model and two Representative Concentration Pathways (RCPs). Loss of habitat is shown in red, stable habitat in blue, and newly gained range in green.
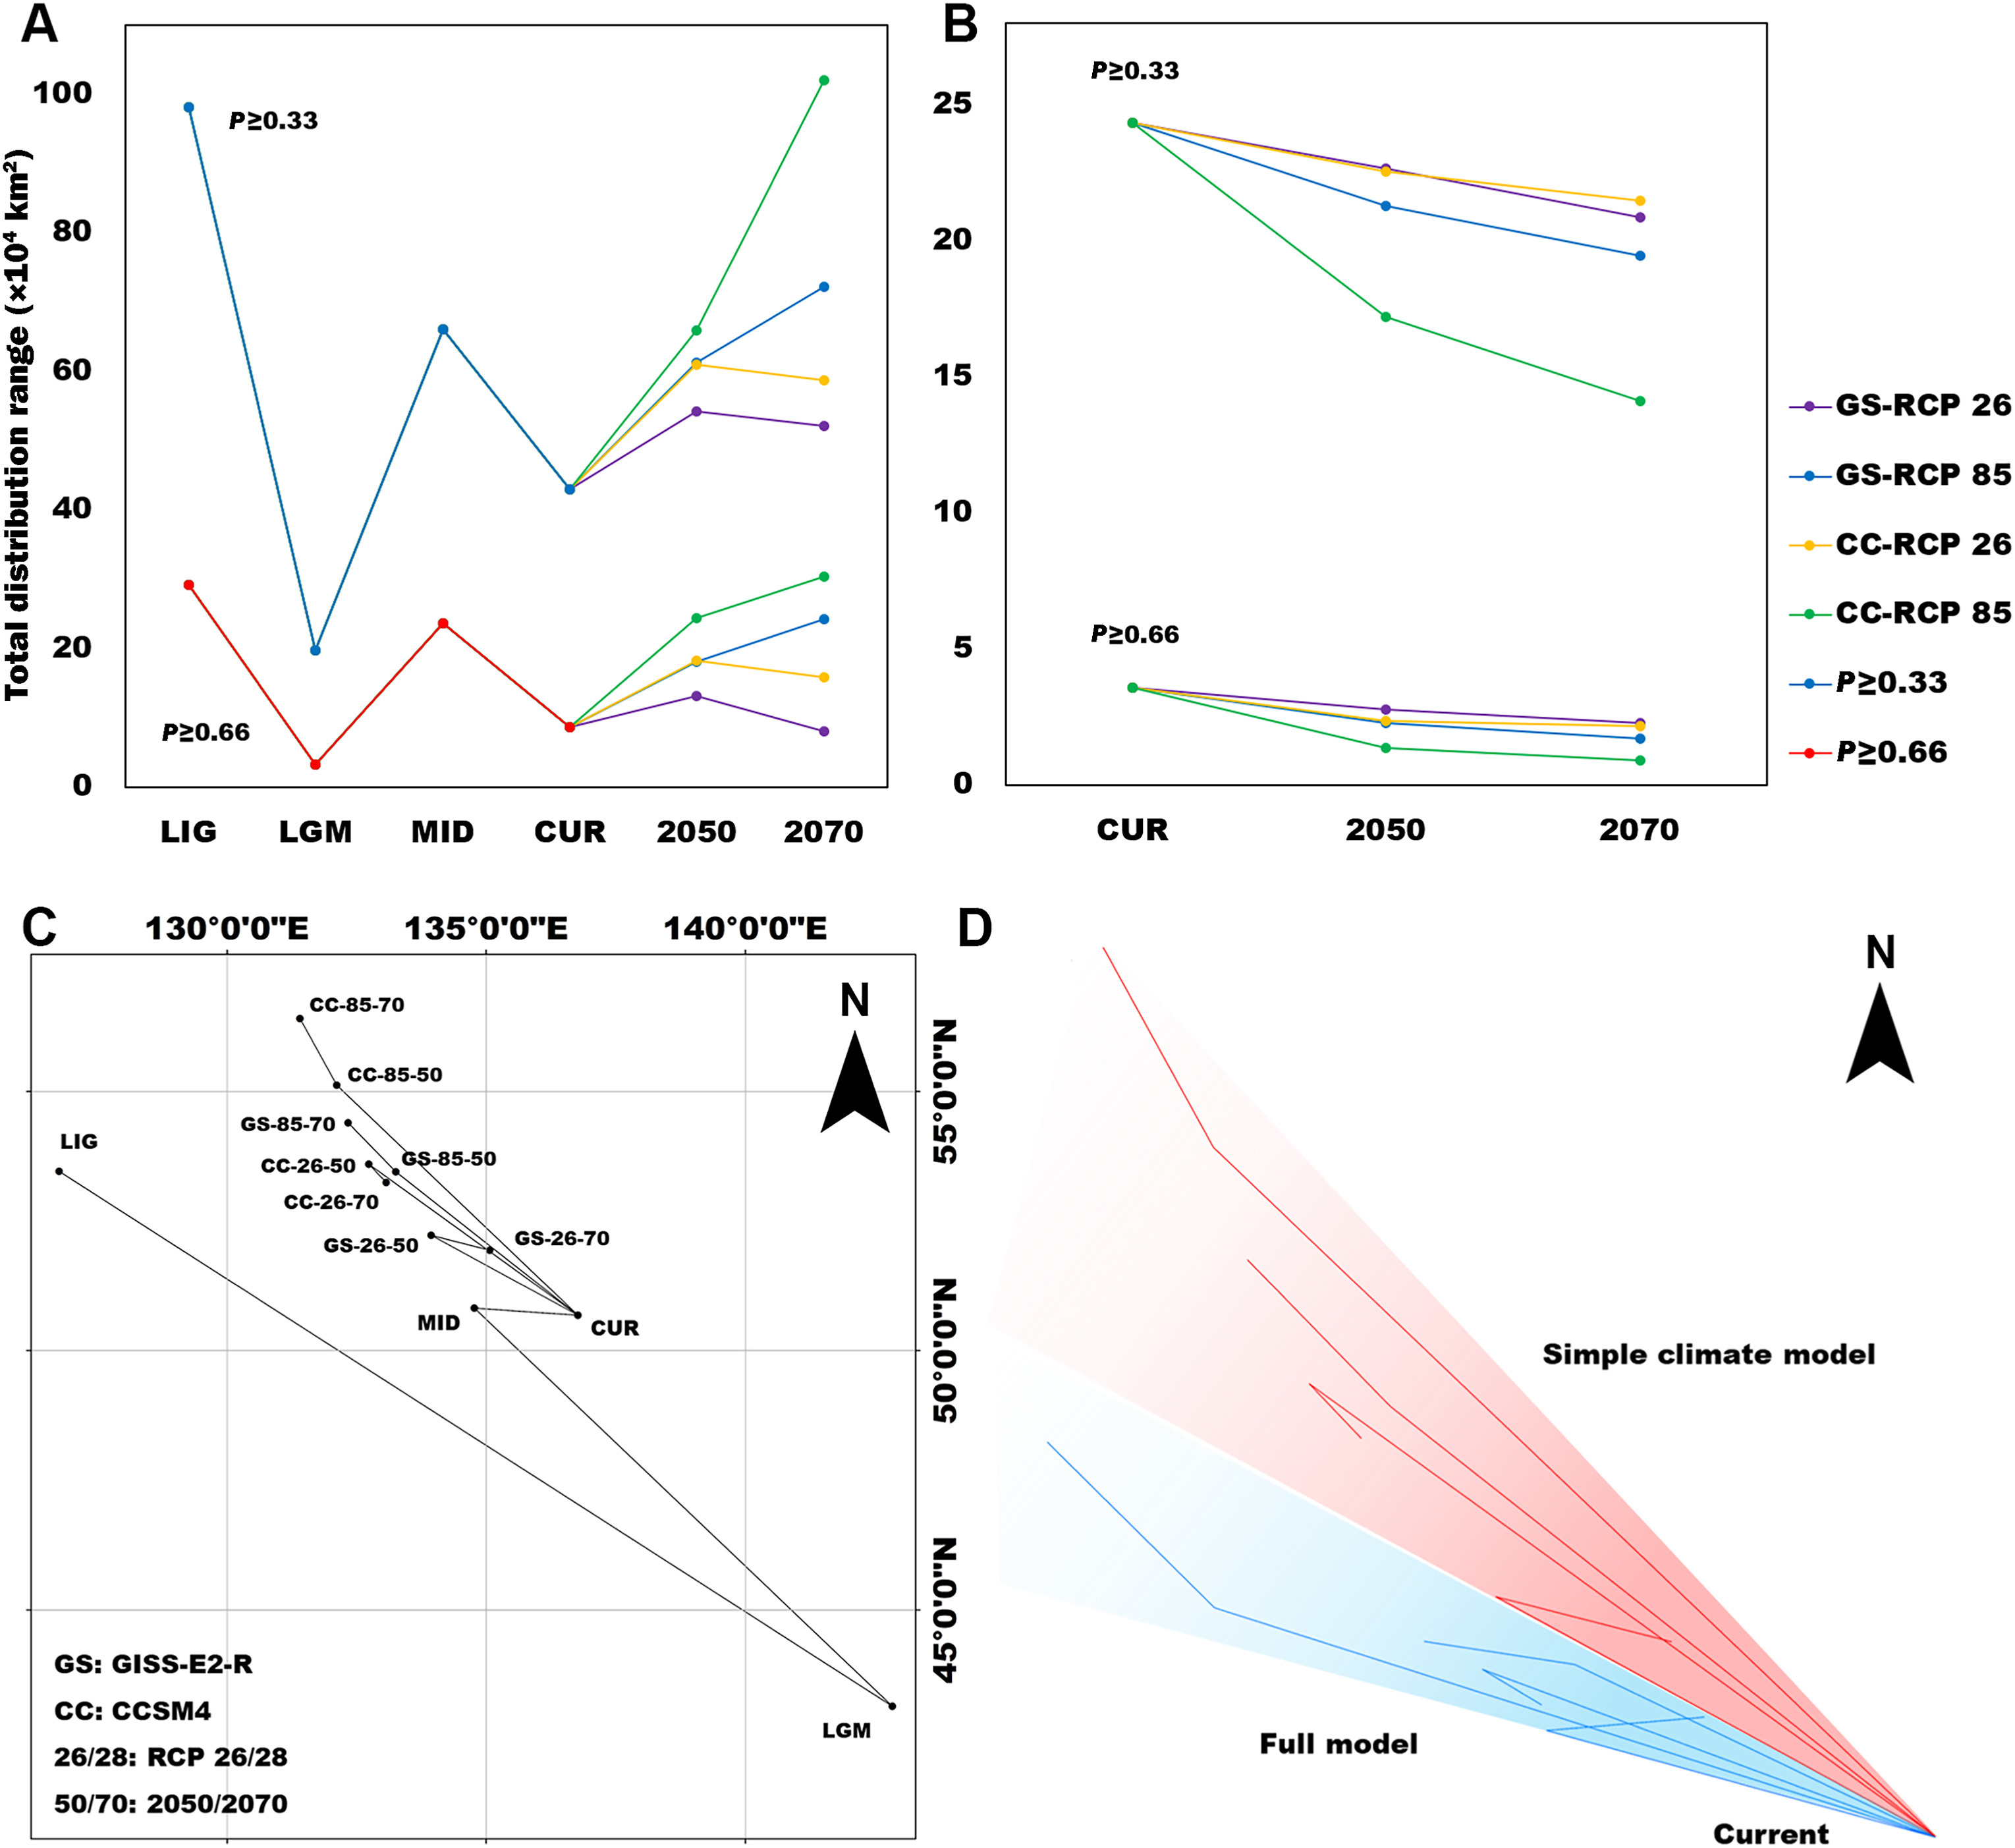
The centroid analysis of the simple climate model showed that, under the scenario of the climatic oscillations, the distribution center of Siberian Grouse moved southeast to survive the glacial period and spread back when the ice receded and temperatures rose (Fig. 4C). The total area range of Siberian Grouse experienced a dramatic loss during the LGM, and has been growing ever since the climate became warmer (Fig. 4A). Under the future climate scenario, the climate becomes warmer in the RCP85 scenario compared to RCP2.6, and the distribution center moves northward more dramatically in RCP85.
Figure
4.
Total distribution range change of Siberian Grouse through LIG, LGM, MID, current period, 2050, and 2070 from the simple climate model (A) and through the current and future in the full model (B). The vertical axis in (A) and (B) stands for the total distribution area (by 10,000 km2) of Siberian Grouse in different periods of time. Different changes under two Global Climate Models and two Representative Concentration Pathways (RCPs) are shown together. The series in the upper graphs represents the range change of the suitability zone (P ≥ 0.33) for Siberian Grouse, whereas the lower series represents the maximum suitability zone (P ≥ 0.66); (C) Distribution Centroid change of Siberian Grouse from the simple climate model through LIG, LGM, MID, current period, 2050, and 2070. Different changes under two Global Climate Models, and two Representative Concentration Pathways (RCPs) are shown together; (D) The comparison of general directions of Siberian Grouse's distribution center change, moving the current distribution center in the full model and the simple climate model to overlap as one point.
The formation of species distributions has become a widely discussed subject, especially for endangered species (Zhao et al., 2019). Our modeling suggested that climate change during the last three million years has influenced the distribution of Siberian Grouse dramatically, causing the species to lose most of its habitat and to live in a small refugium. Our results suggested that a northward trend of the Siberian Grouse's distribution has been restricted by variables like forest type. After the LGM, the Siberian Grouse stopped spreading after a relatively short distance, unlike some other species of grouse, which spread over much of northern Eurasia or the entire northern Palearctic. This suggests that some critical factors stopped Siberian Grouse from doing this also. Based on the projection of simple climate model into 2050 and 2070, we predict that the ongoing global warming will have a profound influence on the change of the species' potential distribution. With increasing temperatures, Siberian Grouse will be forced to move northward to find suitable habitat (Fig. 4D). However, when we add limitations, such as topography, land cover, and human influence into the full model, this trend to go north becomes limited.
Our results indicated that the Siberian Grouse has a strong preference for high precipitation and the cold annual mean temperature. These weather conditions only occur in a relatively small area around the Sea of Okhotsk, which was the refugium for Siberian Grouse during LGM. Therefore, climate change may not only have forced Siberian Grouse to change its habitat, but also formed a dependency on the vegetation or forest found in its LGM refugium. Our findings confirmed that the Siberian Grouse relies heavily on the climate condition and vegetation type of its habitat. The Siberian Grouse feeds exclusively on spruce needles, mainly Ajan Spruce, in winter, and young needles of Dahurian Larch in May (Klaus and Andreev, 2003). Although it also feeds on moss, forbs, grass, ants, and other insects, Ajan Spruce and Dahurian Larch are the crucial food sources and these two plants are also restricted to northeastern Asia, which is similar to the Siberian Grouse's occupied range (see Appendix Fig. S2A). But due to the limitation of data, we could not include all environmental variables in our models, while some of the variables like the vicinity of bogs, creeks and river valleys may also be important, due to resistance of these habitats to forest fires. Future study is needed for more thorough consideration of the potential ecological requirement.
This raises the question that whether the confinement of the crucial land cover type restricted the spreading distance of the Siberian Grouse. Revisiting our result, we find that the Siberian Grouse's distribution relies heavily on the annal mean precipitation, instead of temperature, which means that either it is the direct limitation to Siberian Grouse's spreading or it is an integrated demand for survival for some plants that are necessary for the grouse and would be important to be protected to benefit the conservation of Siberian Grouse. The results of the full model showed that the potential distribution of Siberian Grouse in China is very small and is decreasing rapidly, losing nearly 60% of the potential range, with only 3600 km2 of suitability zone and 50 km2 of maximum suitability zone in the next 30 years (see Appendix Fig. S3). Although conservation efforts have already been made in Russia to experimentally breed and introduce Siberian Grouse to Novosibirskaya Oblast and Altaiskiy Kray (Vladimir and Svetlana, 2010), protected natural areas only included 12.7% of the Maximum Suitability Zone of Siberian Grouse in Russia and even less in China, according to the data of the World Database on Protected Areas (UNEP-WCMC and IUCN, 2021). The reintroduction of Siberian Grouse by human effort probably will be a necessary or alternative measure to bring Siberian Grouse back into China, for it will be difficult to expect the grouse to spread back itself, considering the Siberian Grouse's northward shifting trend in the future and declining potential range in China.
5.
Conclusions
We modeled species distribution models for the Siberian Grouse, which is endemic to a narrow distribution in the Russian Far East. Our results suggested clearly that the Siberian Grouse is declining in distribution and that climate change has a great influence on this species. During the last glacial oscillations, the distribution range of Siberian Grouse experienced a dramatic decrease during the Last Glacial Maximum, when its distribution centroid moved southeastward to a glacial refugium. We confirmed a relationship between the shift of the species' distribution and the accelerated vegetation change over the past 18,000 years (Mottl et al., 2021), indicating that it may be helpful for species modeling if we consider the shifting pattern for plants also. Following deglaciation, the grouse dispersed back, but was restricted by climate and ecological conditions, especially precipitation and vegetation. The shifting distribution pattern for the boreal Siberian Grouse differed from previous studies on species living near the equator (Zacarias and Loyola, 2018), whose distribution ranges enlarged during LGM, indicating the glacial oscillation had a unique effect on Siberian Grouse. Global warming probably will have a dramatic impact on Siberian Grouse and cause great loss to its potential range, unless measures are taken to protect the species. There is an urgent need to protect its habitat, because little of its Maximum Sustainable Zone is protected, although there are some large reserves in that area.
Author contributions
KS and YHS conceived and designed the experiments. WX and KS performed the experiment in the field and analyzed the data. WX wrote the manuscript. KS, YHS, SK and JS revised the paper. All authors read and approved the final manuscript.
Declaration of competing interests
The authors declare that they have no competing interests.
Acknowledgements
We would like to thank A. V. Andreev for the help in the contribution of the distribution locations. The project is funded by National Natural Science Foundation of China and Russian Foundation for Basic Research (NSFC-RFBR: 32011530077 to YHS).
Acevedo P, Jimenez-Valverde A, Lobo JM, Real R. Delimiting the geographical background in species distribution modelling. J Biogeogr. 2012;39:1383-1390
Anderson RP, Raza A. The effect of the extent of the study region on GIS models of species geographic distributions and estimates of niche evolution: preliminary tests with montane rodents (genus Nephelomys) in Venezuela. J Biogeogr. 2010;37:1378-1393
Andreev AV, Hafner F, Klaus S, Gossow H. Displaying behaviour and mating system in the Siberian Spruce Grouse (Falcipennis falcipennis Hartlaub 1855). J Ornithol. 2001;142:404-424
Andreev AV, Hafner F. Winter Biology of the Siberian Grouse Falcipennis falcipennis. Ornithol Sci. 2011;10:101-111
Araujo MB, Pearson RG, Rahbek C. Equilibrium of species’ distributions with climate. Ecography. 2005;28:693-695
Berry, M.W., Dayal, U., Kamath, C., Skillicorn, D., 2004. Proceedings of the 2004 SIAM International Conference on Data Mining. Society for Industrial and Applied Mathematics, Philadelphia.
BirdLife International, 2017. Falcipennis falcipennis (amended version of 2016 assessment). The IUCN Red List of Threatened Species 2017: e.T22679446A112117355. . (Accessed 17 May 2021).
Bogaert J, Zhou L, Tucker CJ, Myneni RB, Ceulemans R. Evidence for a persistent and extensive greening trend in Eurasia inferred from satellite vegetation index data. J Geophys Res. 2002;107:ACL4-1-ACL4-14
Brown JL, Bennett JR, French CM. SDMtoolbox 2.0: the next generation Python-based GIS toolkit for landscape genetic, biogeographic and species distribution model analyses. PeerJ. 2017;5:e4095
Brown JL, Yoder AD. Shifting ranges and conservation challenges for lemurs in the face of climate change. Ecol Evol. 2015;5:1131-1142
Clark PU, Dyke AS, Shakun JD, Carlson AE, Clark J, Wohlfarth B, et al. The Last Glacial Maximum. 2009;325:710-714
Dai J, Roberts DA, Stow DA, An L, Hall SJ, Yabiku ST, et al. Mapping understory invasive plant species with field and remotely sensed data in Chitwan, Nepal. Rem Sens Environ. 2020;250:112037
Dong F, Hung CM, Li XL, Gao JY, Zhang Q, Wu F, et al. Ice age unfrozen: severe effect of the last interglacial, not glacial, climate change on East Asian avifauna. BMC Evol Biol. 2017;17:244
Duan J, Zhou G. Potential distribution of rice in china and its climate characteristics. Acta Ecol Sinica. 2011;31:6659-6668
Elith JH, Graham CP, Anderson R, Dudik M, Ferrier S, Guisan A, et al. Novel methods improve prediction of species’ distributions from occurrence data. Ecography. 2006;29:129-151
Engler JO, Stiels D, Schidelko K, Strubbe D, Quillfeldt P, Brambilla M. Avian SDMs: current state, challenges, and opportunities. J Avian Biol. 2017;48:1483-1504
Farias AA, Svensson GL. Ecoregional vulnerability assessment for the functional richness of South American Carnivorans (Mammalia: Carnivora). J Mamm Evol. 2014;21:437-450
Fielding AH, Bell JF. A review of methods for the assessment of prediction errors in conservation presence/absence models. Environ Conserv. 1997;24:38-49
Fitzpatrick MC, Gotelli NJ, Ellison AM. MaxEnt versus MaxLike: empirical comparisons with ant species distributions. Ecosphere. 2013;4:1-15
GBIF, 2021. Global Biodiversity Information Facility. . (Accessed 8 May 2021).
Guisan A, Thuiller W. Predicting species distribution: offering more than simple habitat models. Ecol Lett. 2005;8:993-1009
Herkert JR. An analysis of midwestern breeding bird population trends: 1966-1993. Am Midl Nat. 1995;134:41-50
Hijmans RJ, Graham CH. The ability of climate envelope models to predict the effect of climate change on species distributions. Global Change Biol. 2006;12:2272-2281
Hof AR, Rodriguez-Castaneda G, Allen AM, Jansson R, Nilsson C. Vulnerability of Subarctic and Arctic breeding birds. Ecol Appl. 2017;27:219-234
Hu R, Gu Y, Luo M, Lu Z, Wei M, Zhong J. Shifts in bird ranges and conservation priorities in China under climate change. PLoS One. 2020;15:e0240225
Hutchinson GE. Homage to Santa Rosalia or Why Are There So Many Kinds of Animals? Am Nat. 1959;93:145-159
Intergovernmental Panel on Climate, 2014. Climate Change 2013 – the Physical Science Basis: Working Group I Contribution to the Fifth Assessment Report of the Intergovernmental Panel on Climate Change. Cambridge University Press, Cambridge.
Kimball RT, Hosner PA, Braun EL. A phylogenomic supermatrix of Galliformes (Landfowl) reveals biased branch lengths. Mol Phylogenet Evol. 2021;158:1-10
Kimball RT, St. Mary CM, Braun EL. A macroevolutionary perspective on multiple sexual traits in the Phasianidae (Galliformes). Int J Evol Biol. 2011;2011:1-16
Klaus, S., Andreev, A.V., 2003. Falcipennis falcipennis (Hartlaub, 1855) Sichelhuhn. Atlas der Verbreitung Palaearktischer Vogel Akademie Verlag, Berlin € .
Kondrashov LG. Russian Far East Forest disturbances and socio-economic problems of restoration. Forest Ecol Manag. 2004;201:65-74
Konovalenko, K., 2012. The Influence of Forest Cover Changes in Russian Far East on the Population of Siberian Spruce Grouse. Master thesis. Albert-Ludwigs-Universität Freiburg, Freiburg, Germany.
Lloyd AH, Fastie CL. Recent changes in treeline forest distribution and structure in interior Alaska. Ecoscience. 2003;10:176-185
Lloyd AH, Rupp TS, Fastie CL, Starfield AM. Patterns and dynamics of treeline advance on the Seward Peninsula, Alaska. J Geophys Res. 2002;107:ALT2-1-ALT2-15
Lucchini V, Hoglund J, Klaus S, Swenson J, Randi E. Historical biogeography and a mitochondrial DNA phylogeny of Grouse and Ptarmigan. Mol Phylogenet Evol. 2001;20:149-162
Ludwig T, Konovalenko K. Siberian Grouse in the Russian Far East: data deficient. Grouse News. 2012;43:11-15
Mottl O, Flantua SGA, Bhatta KP, Felde VA, Giesecke T, Goring S, et al. Global acceleration in rates of vegetation change over the past 18,000 years. Science. 2021;372:860-864
Natural Earth. . (Accessed 8 May 2021).
Opdam P, Wascher D. Climate change meets habitat fragmentation: linking landscape and biogeographical scale levels in research and conservation. Biol Conserv. 2004;117:285-297
Otto-Bliesner BL, Marshall SJ, Overpeck JT, Miller GH, Hu A. Simulating Arctic Climate Warmth and Icefield Retreat in the Last Interglaciation. Science. 2006;311:1751-1753
Pachauri, R.K., Allen, M.R., Barros, V.R., Broome, J., Cramer, W., Christ, R., et al., 2014. Climate change 2014: synthesis report. In: Pachauri, R.K., Meyer, L. (Eds.), Contribution of Working Groups Ⅰ, Ⅱ and Ⅲ to the Fifth Assessment Report of the Intergovernmental Panel on Climate Change. IPCC, Geneva, p. 151.
Parmesan C, Yohe G. A globally coherent fingerprint of climate change impacts across natural systems. Nature. 2003;421:37-42
Parmesan C. Ecological and evolutionary responses to recent climate change. Ann Rev Ecol Evol Syst. 2006;37:637-669
Persons NW, Hosner PA, Meiklejohn KA, Braun EL, Kimball RT. Sorting out relationships among the grouse and ptarmigan using intron, mitochondrial, and ultra-conserved element sequences. Mol Phylogenet Evol. 2016;98:123-132
Phillips SJ, Anderson RP, Schapire RE. Maximum entropy modeling of species geographic distributions. Ecol Model. 2006;190:231-259
Phillips, S.J., Dudík, M., Schapire, R.E., 2021. Maxent software for modeling species niches and distributions (Version 3.4.1). . (Accessed 17 May 2021).
Prates L, Perez SI. Late Pleistocene South American megafaunal extinctions associated with rise of Fishtail points and human population. Nature Commun. 2021;12:2175
Prieto-Torres, D.A., Rojas-Soto, O., Lira-Noriega, A., 2020. Ecological niche modeling and other tools for the study of avian malaria distribution in the Neotropics: a short literature review. In: Santiago-Alarcon, D., Marzal, A. (Eds.), Avian Malaria and Related Parasites in the Tropics: Ecology, Evolution and Systematics. Springer International Publishing, Chambridge, pp. 251–280.
Rodriguez JP, Brotons L, Bustamante J, Seoane J. The application of predictive modelling of species distribution to biodiversity conservation. Divers Distrib. 2007;13:243-251
Root TL, Price JT, Hall KR, Schneider SH, Rosenzweig C, Pounds JA. Fingerprints of global warming on wild animals and plants. Nature. 2003;421:57-60
Scheper J, Holzschuh A, Kuussaari M, Potts SG, Rundlof M, Smith HG, et al. Environmental factors driving the effectiveness of European agri-environmental measures in mitigating pollinator loss - a meta-analysis. Ecol Lett. 2013;16:912-920
Singh PB, Mainali K, Jiang Z, Thapa A, Subedi N, Awan MN, et al. Projected distribution and climate refugia of endangered Kashmir musk deer Moschus cupreus in greater Himalaya, South Asia. Sci Rep. 2020;10:1511
Storch, I., 2007. Grouse: Status Survey and Conservation Action Plan 2006–2010. IUCN, Gland, Switzerland and World Pheasant Association, Fordingbridge, UK.
Summers DM, Bryan BA, Crossman ND, Meyer WS. Species vulnerability to climate change: impacts on spatial conservation priorities and species representation. Global Change Biol. 2012;18:2335-2348
Tang CQ, Dong Y-F, Herrando-Moraira S, Matsui T, Ohashi H, He L-Y, et al. Potential effects of climate change on geographic distribution of the Tertiary relict tree species Davidia involucrata in China. Sci Rep. 2017;7:43822
UNEP-WCMC, 2021. IUCN. Protected Planet: the World Database on Protected Areas (WDPA) and World Database on Other Effective Area-Based Conservation Measures (WD-OECM). UNEP-WCMC and IUCN, Cambridge.
Urvois T, Auger-Rozenberg MA, Roques A, Rossi JP, Kerdelhue C. Climate change impact on the potential geographical distribution of two invading Xylosandrus ambrosia beetles. Sci Rep. 2021;11:1339
Vladimir S, Svetlana K. Experiment on creatiing west Siberian Grouse reserve population (Falcipennis falcipennis). Tomsk State Univ J Biol. 2010;12:60-67
Wang T, Overgaard J. The heartbreak of adapting to global warming. Science. 2007;315:49-50
Wildlife Conservation Society (WCS), Center for International Earth Science Information Network (CCU), 2005. Last of the Wild Project, Version 2, 2005 (LWP-2): Global Human Influence Index (HII) Dataset (IGHP). NASA Socioeconomic Data and Applications Center (SEDAC), Palisades, NY.
WorldClim Version 1, 2021. Global Climate Data. . (Accessed 8 May 2021).
Zacarias D, Loyola R. Distribution modelling and multi-scale landscape connectivity highlight important areas for the conservation of savannah elephants. Biol Conserv. 2018;224:1-8
Zhao H, Zhang H, Xu C. Study on Taiwania cryptomerioides under climate change: MaxEnt modeling for predicting the potential geographical distribution. Global Ecol Conserv. 2020;24:e01313
Zhao M, Chang Y, Kimball RT, Zhao J, Lei F, Qu Y. Pleistocene glaciation explains the disjunct distribution of the Chestnut-vented Nuthatch (Aves, Sittidae). Zool Scripta. 2019;48:33-45
Zheng, G.M., Wang, Q.S., 1998. China Red Data Book of Endangered Animals: Aves. Science Press, Beijing.
Zhou L, Tucker CJ, Kaufmann RK, Slayback D, Shabanov NV, Myneni RB. Variations in northern vegetation activity inferred from satellite data of vegetation index during 1981 to 1999. J Geophys Res. 2001;106:20069-20083

 DownLoad:


 Email Alerts
 RSS Feeds