Key Laboratory of Zoological Systematics and Evolution, Institute of Zoology, Chinese Academy of Sciences, Beijing 100101, China
2.
School of Chemistry and Life Sciences, Guizhou Normal College, Guiyang 550001, China
3.
Department of Ornithology, American Museum of Natural History, Central Park West at 79th Street, New York, NY 10024-5192, USA
4.
Key Laboratory of Ecological Impacts of Hydraulic-Projects and Restoration of Aquatic Ecosystem of Ministry of Water Resources, Institute of Hydroecology, Ministry of Water Resources and Chinese Academy of Sciences, Wuhan 430079, China
5.
Department of Life Science, National Taiwan Normal University, Taipei, Taiwan
6.
University of Chinese Academy of Sciences, Beijing 100049, China
Although a growing number of both sequence-based and microsatellite nuclear loci have been used to infer genetic structures, their relative efficiencies remain poorly understood. In our study, we used the Green-backed Tit (Parus monticolus) to explore the resolving ability of these two types of markers. The south-western and central mitochondrial DNA (mtDNA) phylogroups were divergent to some extent in sequence-based nuclear data, while mixed together in microsatellites data. The FST values among clades were about four times lower in microsatellite loci than those in sequence-based nuclear loci. We are of the opinion that size homoplasy may have contributed to the inability of microsatellites to uncover differentiation. Our results suggest that sequence-based nuclear loci outperformed microsatellite loci in detecting population structures, especially those focused on populations with large effective population sizes. There was no significant correlation between FST values and allelic size variability, which suggested that the efficiency of microsatellite loci in detecting genetic structure may be independent of their polymorphism. FST is better than RST in detecting intraspecific divergence due to the high variance of RST. In agreement with sequence-based nuclear loci, microsatellite loci did resolve the genetic distinctness of the Taiwanese phylogroup. The genetic differentiation between the Taiwanese and continental clades may involve allopatric divergence without gene flow.
One of the primary goals of phylogeography is to discover genetic lineages within and among closely related species (Avise et al., 1987). At the beginning of a phylogeographic study, investigators are typically faced with making a decision about which type of molecular marker to use. The three most commonly used DNA markers in phylogeography are mitochondrial DNA (mtDNA), sequence-based nuclear markers and microsatellite markers. mtDNA has been widely used in phylogeography for almost two decades (Avise, 2009). It is a leading indicator of genetic structures, especially for populations with relatively short periods of isolation (Zink and Barrowclough, 2008). However, using mtDNA alone has been criticized recently because of some shortcomings, such as evolutionary linkage and maternal inheritance (Edwards and Bensch, 2009). It now seems that multiple, unlinked nuclear loci are essential for better understanding the complex evolutionary history of species (Ballard and Whitlock, 2004; Brito and Edwards, 2008). Still, another question that needs to be addressed is whether sequence-based nuclear markers or frequency-based microsatellite markers are more suitable for detecting genetic structures.
Both sequence-based nuclear markers and microsatellite markers have their advantages and disadvantages. Many microsatellite markers have high mutation rates (between 10-2 and 10-5 mutations per locus per generation (Estoup and Angers, 1998)); this high mutation rate improves the power of these markers to distinguish populations (Schlötterer, 2000). It has been suggested that fewer unlinked microsatellite markers than sequence-based nuclear markers are needed to achieve the same precision (Haasl and Payseur, 2010). However, the extremely high mutation rate of microsatellite markers may lead to size homoplasy, which means allelic size is identical in state but not identical by descent (Estoup et al., 2002). Size homoplasy can underestimate population differentiation (Hedrick, 1999; Li et al., 2010b). Although a fraction of size homoplasy could be detected by single-strand conformation polymorphism (SSCP) and DNA sequencing, the detectable homoplasy could improve only a slight underestimation of genetic differentiation (Adams et al., 2004). Most size homoplasy is undetectable when two alleles are identical in sequence but not identical by descent [i.e. they have different genealogical histories (Selkoe and Toonen, 2006)]. In addition, the complex mutation models of microsatellite data further complicate the power to detect population structures (Balloux and Lugon-Moulin, 2002; Haasl and Payseur, 2010). The drawbacks of allele-frequency based markers in recognizing historical grouping of populations, calculating gene flow and estimating divergence times have led some researchers to suggest that sequence-based markers are superior to microsatellites in evolutionary studies (Brito and Edwards, 2008; Zink, 2010). Sequence-based nuclear markers have lower mutation rates (10-8 to 10-9, e.g. Axelsson et al., 2004) and thus lower levels of homoplasy. Mutation models are much simpler and the exploration of genealogical patterns is easier (Zhang and Hewitt, 2003). Moreover, it is convenient to compare the parameters estimated using sequence-based nuclear data with those estimated using mtDNA data (Brito and Edwards, 2008). However, the low mutation rate of sequence-based nuclear markers restricts the resolving power to discover shallower genetic structures.
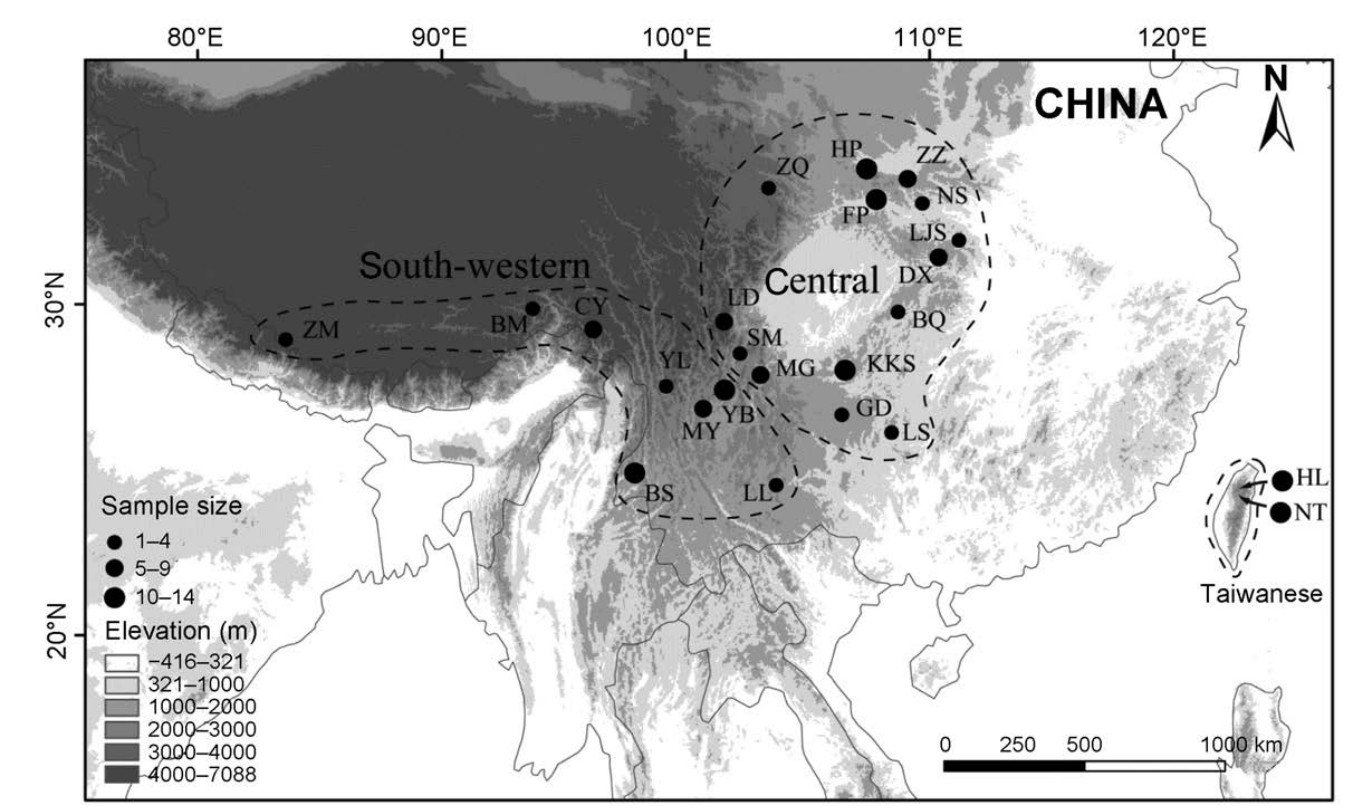
In this study, we selected the Green-backed Tit (Parus monticolus), an East Asian endemic bird species, to resolve which maker is more suitable for revealing genetic structures within species. Our previous work (Wang et al., 2013) revealed three mtDNA phylogroups in China and adjacent areas: a south-western phylogroup including samples from the Himalayas, southwest China and northeast India, a central phylogroup containing samples from central China and a Taiwanese phylogroup, restricted to Taiwan Island (Fig. 1). A species tree analysis including both mtDNA and sequence-based nuclear loci, revealed that the ancestral population of the Greenbacked Tit, in first instance, splits into the Taiwanese phylogroup and the ancestral population of the southwestern /central phylogroup, which further splits into the south-western and the central phylogroups. The genetic diversification within the Green-backed Tit is relatively recent. All diversification probably occurred within the last 0.9 million years. Haplotype networks based on sequence-based nuclear loci revealed fixed base pair differences between the Taiwanese and other phylogroups. However, the genetic divergence between the southwestern and central phylogroups was shallower, with shared nuclear haplotypes. Given their higher mutation rate, microsatellite markers might resolve divergence patterns within these more recently divergent phylogroups. Besides, previous studies have successfully utilized microsatellite markers to reveal genetic divergence within species when sequence-based nuclear markers failed (Brunner et al., 1998; Tonione et al., 2010).
Figure
1.
Topological map of East Asia showing sampling sites and the three phylogroups revealed by mitochondrial DNA (mtDNA, data from Wang et al., 2013). Circles represent sampling sites where the size of the circles is proportional to the sample size. Dashed lines show the three mtDNA phylogroups: the south-western, central and Taiwanese phylogroups. Elevation is represented by shading: lower elevations are shown lighter and higher elevations are shown darker. The Green-backed Tit is distributed from approximately 1000 to 3000 m in elevation. See Table 1 for details of population codes.
We used two Z-linked sequence loci and nine microsatellite loci in this study. We first describe the genetic structure revealed by microsatellite data. Second, we compare the genetic structures revealed by sequencebased nuclear loci and microsatellite loci and address the resolving ability of these two types of markers. Third, given the genetic distinctiveness of the Taiwanese population, we also explored whether allopatric divergence without gene flow or isolation with migration might result in this genetic pattern.
Methods
Sample collection, DNA amplification and microsatellite genotyping
We used 154 samples from 24 sites across most of the range of the Green-backed Tit (Fig. 1). Samples included three of the four described subspecies (we lacked samples of P. m. legendrei, which is restricted to southern Vietnam on the Da Lat plateau). Gross genomic DNA was extracted using the DNeasy Tissue kit (QIAGEN) following the instructions of the manufacturer. Two Z-linked sequence loci and nine microsatellite loci were used in this study. The two Z-linked sequence loci were MUSK (muscle-specific tyrosine kinase) and Z-185 (similar to a transient receptor potential cation channel, subfamily M, member 3, ShouHsien Li, unpublished data). These sequences were used in our previous work (Wang et al., 2013, GenBank number JQ324378–JQ324420, JQ324466–JQ324472, JQ324475, JQ324479, JQ324481–JQ324499, JQ324501, JQ324506–JQ324513, JX849802–JX849862). Among the nine microsatellite loci, four loci (Titgata02, Titgata67, Titgata87, Titgata89; Wang et al., 2005) were developed specifically for the Green-backed Tit and five additional loci (PmaGAn27, PmaTAGAn71, PmaTGAn45, Pma48m, Pma69u; Kawano, 2003; Saladin et al., 2003) for its closest relative Parus major (Gill et al., 2005; Dai et al., 2010). We started with the original PCR conditions described in these three papers and then the adjusted MgCl2, template DNA concentrations and annealing temperatures to amplify our target loci. Microsatellites were amplified with fluorescent labeled forward primers (FAM and HEX dyes). Fragment lengths were analyzed with the internal size marker GENESCAN-500 ROX (Applied Biosystems) and scored with GENEMARKER 3.7 (SoftGenetics).
Data analysis
For microsatellite data, a Hardy-Weinberg equilibrium (HWE) and linkage disequilibrium (LD) were tested using GENEPOP 4.0 (Raymond and Rousset, 1995), with a sequential Bonferroni correction for assessing statistical significance. Basic population genetic parameters (number of alleles, private alleles, observed and expected heterozygosity per locus) were estimated with MSTools (Park, 2001). To correct for sample size differences, we calculated allelic richness using FSTAT 2.9.3 (Goudet, 2001). Null alleles were examined with MicroChecker (Van Oosterhout et al., 2004).
We used three methods to identify genetically distinct groups in microsatellites. First, PHYLIP 3.6 (Felsenstein, 1989) was utilized to construct a neighbor-joining tree using Cavalli-Sforza's chord distance (Dc), with 1000 bootstrap replicates. A Dc distance based tree was utilized because this has been suggested to be robust to null alleles (Chapuis and Estoup, 2007) and is suitable for allele frequency data (Takezaki and Nei, 1996). Second, we used a Bayesian approach implemented in STRUCTURE 2.3.3 (Falush et al., 2007) to assign individuals to clusters without prior information. Analyses were run using an admixture and correlated allele frequency model. The number of groups (K) was varied from 1 to 10, with 5 runs for each K value. The burning length and MCMC iterations were set to 500000 and 5000000, respectively. We used the Evanno et al. (2005) method implemented in the program STRUCTURE HARVESTER (Earl, 2012) in order to determine the most likely value of K and DISTRUCT 1.1 (Rosenberg, 2004) to display the results. Third, pairwise FST (Wright, 1965) and RST (Slatkin, 1995) values among clades were calculated for individual microsatellite loci as well as all loci combined using FSTAT. We also calculated pairwise GST (Nei, 1978) and D (Jost, 2008) values among clades for all loci combined using GENODIVE 2.0b20 (Meirmans, 2009), because combined utilization of FST with GST and D has been recommended (Jost, 2009; Leng and Zhang, 2011; Meirmans and Hedrick, 2011).
For the two sequence-based nuclear loci, the Ewens-Watterson (Ewens, 1972; Watterson, 1974) and Chakraborty's Amalgamation (Chakraborty, 1990) tests implemented in ARLEQUIN 3.5 (Excoffier et al., 2005), were used to test for selective neutrality. Haplotype networks were reconstructed using TCS 1.21 (Clement et al., 2000). In order to compare the genetic differentiation between microsatellite and sequence-based nuclear data, we also calculated FST values among clades at each locus.
Results
For microsatellite data, no evidence emerged for linkage disequilibrium between any pair of loci across all populations. Locus Titgata67 significantly deviated from the Hardy-Weinberg equilibrium (p < 0.05) and was excluded from all further analyses. There were null alleles for populations BS and KKS at locus Pma69u, with frequencies of 0.25 and 0.18 respectively. The number of alleles per locus ranged from seven in Pma48m to 22 in Titgata87. Allelic richness ranged from 1.56 to 1.79 (Table 1). All the continental populations had limited private alleles, with less than two alleles in each population. However, NT and HL, the two Taiwanese populations, exhibited high levels of private alleles, with five and 14 alleles in each population, respectively. For sequence-based nuclear data, Chakraborty's amalgamation test and the Ewens-Watterson test were not significant for any locus.
Table
1.
Summary of genetic diversity in the Green-backed Tit (Parus monticolus)
Population code
Location
Longitude (°)
Latitude (°)
n
A
PA
AR
HO
HE
South-western
42
3.33
4
7.75
0.62
0.66
ZM
Zhangmu
85.988
27.989
4
3.75
1
1.67
0.66
0.67
MY
Miyi
101.899
27.127
5
4.13
0
1.67
0.55
0.67
YB
Yanbian
101.535
27.106
13
6.00
1
1.68
0.70
0.68
YL
Yulong
100.261
27.097
2
2.63
0
1.67
0.69
0.67
BS
Baoshan
98.783
24.820
11
5.38
1
1.64
0.57
0.64
BM
Bomi
95.759
29.873
2
2.25
0
1.58
0.56
0.58
CY
Chayu
97.084
28.562
5
4.00
0
1.64
0.53
0.64
Central
88
3.27
12
9.88
0.67
0.72
ZQ
Zhouqu
104.171
33.697
2
2.38
1
1.56
0.56
0.56
ZZ
Zhouzhi
108.221
34.160
9
5.38
0
1.71
0.66
0.71
FP
Foping
107.768
33.596
10
5.75
0
1.72
0.67
0.72
NS
Ningshan
108.318
33.313
3
3.50
0
1.76
0.71
0.76
HP
Haoping
107.711
34.088
12
6.50
1
1.68
0.66
0.68
MG
Meigu
103.308
28.518
7
5.63
2
1.72
0.73
0.72
DX
Dingxi
110.195
31.566
8
5.00
0
1.69
0.73
0.69
BQ
Banqiao
108.638
29.933
4
3.63
0
1.66
0.70
0.66
LJS
Laojunshan
110.918
31.880
4
4.50
0
1.76
0.66
0.76
LD
Luding
102.277
29.920
6
4.50
0
1.70
0.63
0.70
SM
Shimian
102.338
29.100
4
3.63
1
1.69
0.59
0.69
LL
Longlin
104.871
24.666
1
1.63
0
1.63
0.63
0.63
GD
Guiding
107.135
26.582
3
3.63
0
1.76
0.67
0.76
KKS
Kuankuoshui
107.190
27.947
13
6.50
1
1.74
0.66
0.74
LS
Leishan
108.078
26.384
2
2.88
0
1.79
0.81
0.79
Taiwanese
24
2.90
18
6.88
0.60
0.64
NT
Nantou
121.182
23.977
14
5.13
5
1.56
0.53
0.58
HL
Hualian
121.388
24.192
10
5.50
14
1.61
0.71
0.61
Note: n, sample size; A, average number of alleles per locus; PA, private allele; AR, allelic richness; HO, observed heterozygosity; and HE, expected heterozygosity.
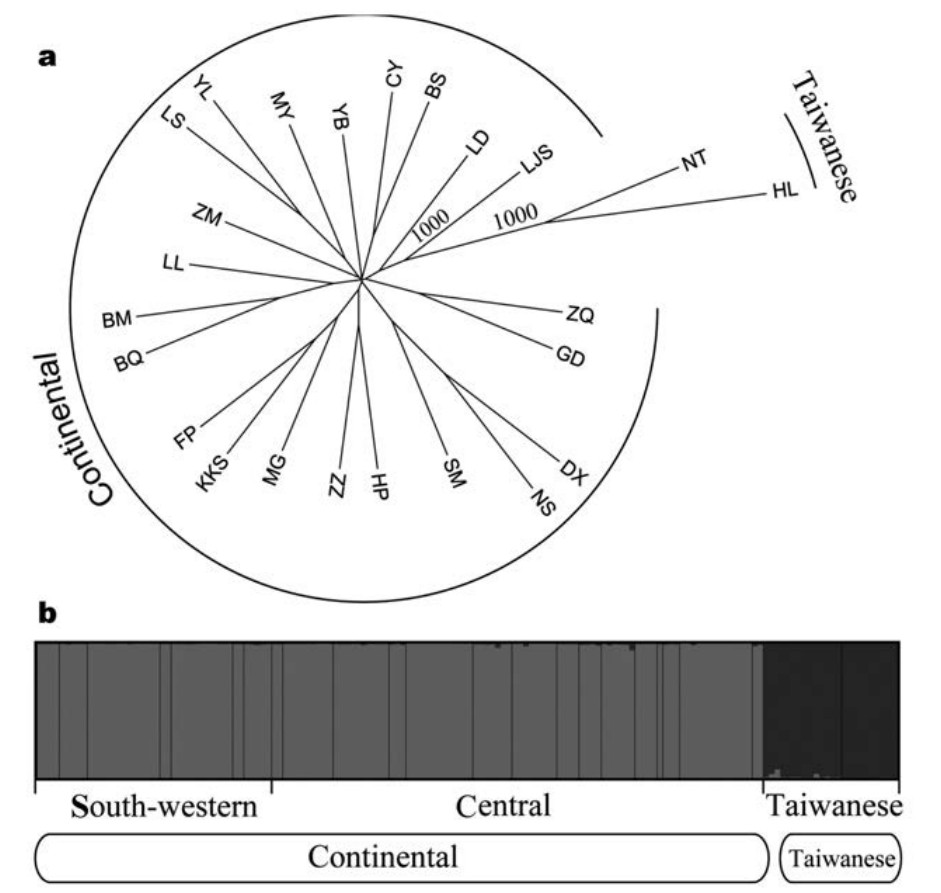
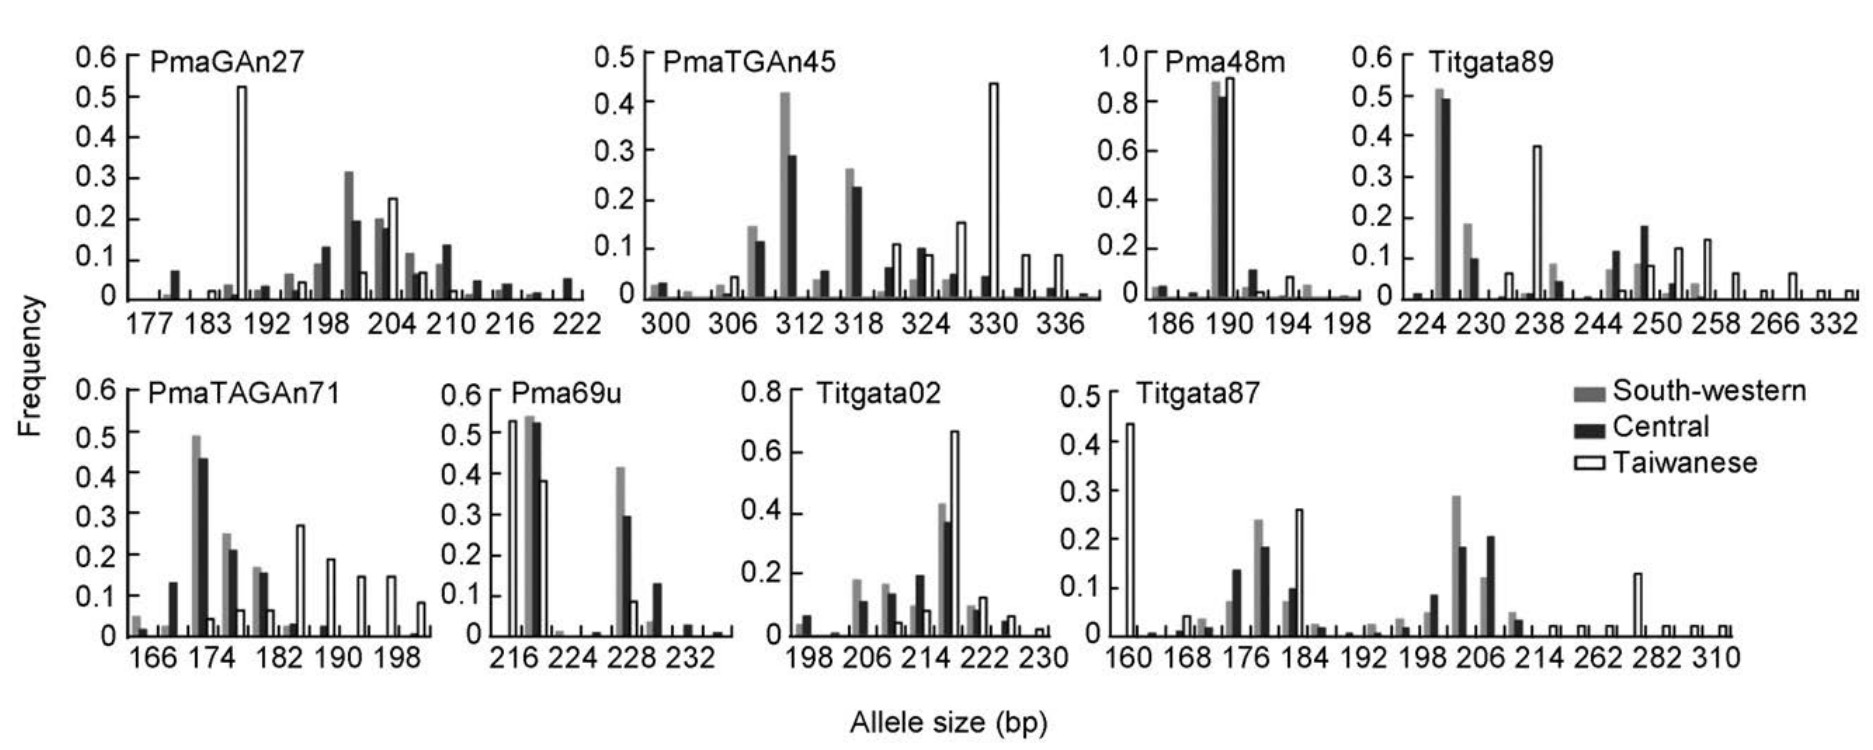
The neighbor-joining tree constructed with microsatellite data (Fig. 2a) identified two genetic clades: a continental clade (south-western + central mtDNA phylogroups) containing samples from the Asian continent and a Taiwanese clade was restricted to Taiwan. This was consistent with the STRUCTURE result (Fig. 2b). The Evanno et al. (2005) method indicated the optimal number of clusters as K = 2. STRUCTURE analyses did not resolve any genetic structure within the Asian continent. Allelic size frequencies were similar between the south-western and central phylogroups, but significantly different between the Taiwanese and continental clades (Fig. 3). The weighted RST values were 0.01 between the south-western and central phylogroups, 0.25 between the central and Taiwanese phylogroups, and 0.22 between the south-western and Taiwanese phylogroups. GST values were 0.00 between the south-western and central phylogroups, 0.01 between the central and Taiwanese phylogroups, and 0.10 between the south-western and Taiwanese phylogroups. In general, estimated D values were higher than the estimated GST values. D values were 0.02 between the south-western and central phylogroups, 0.42 between the central and Taiwanese phylogroups, and 0.44 between the south-western and Taiwanese phylogroups.
FST between the south-western and central clades for the eight microsatellite loci combined was 0.01 (ranging from 0.00 to 0.01). In contrast, FST was much higher for individual sequence-based loci (MUSK: FST = 0.03, Z185: FST = 0.04). FST between the south-western and Taiwanese clades for the eight microsatellite loci combined (average: 0.17, ranging from 0.01 to 0.24) was much lower than that for the two nuclear loci (MUSK:
FST = 0.61, Z185: FST = 0.89), so was FST between the central and Taiwanese clades [microsatellite: FST = 0.15 (ranging from 0.03 to 0.22), MUSK: FST = 0.54, Z185:
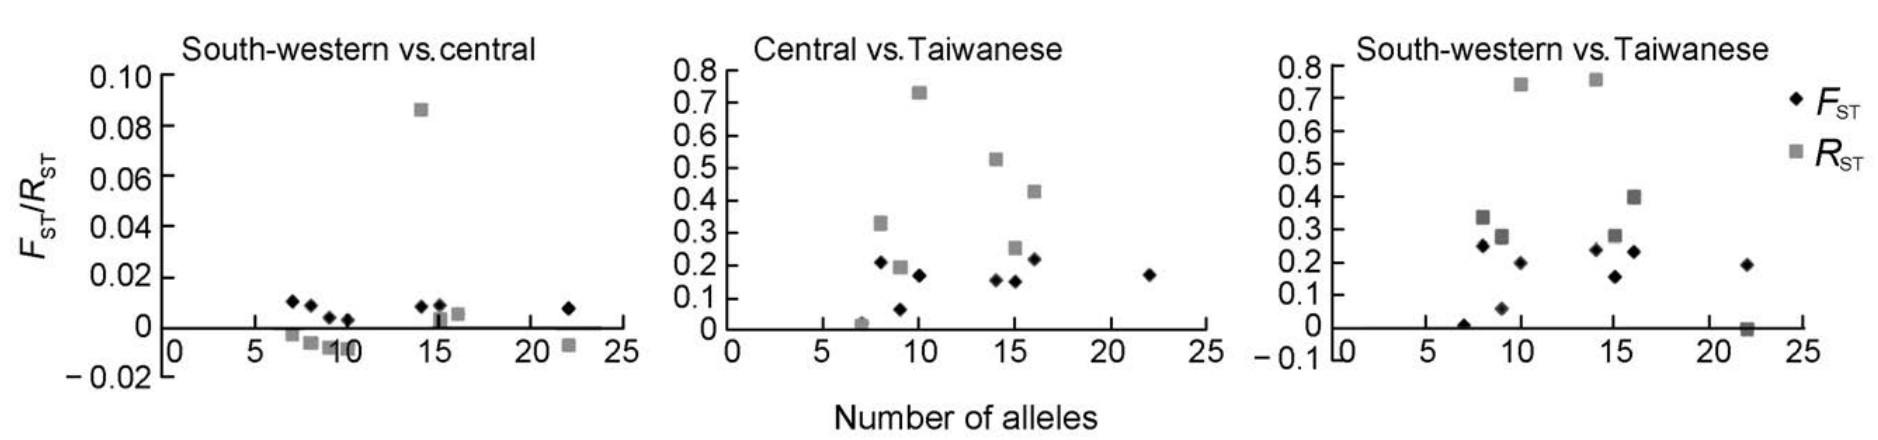
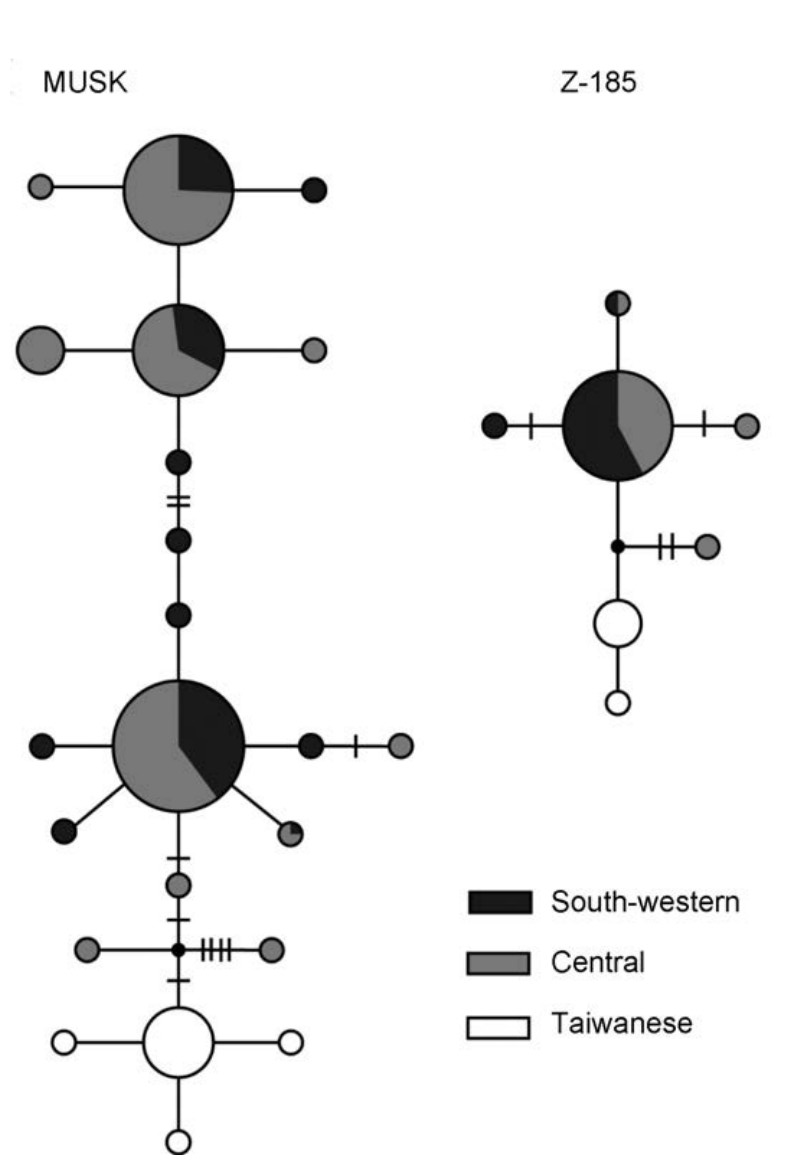
FST = 0.77]. The single-locus estimates of FST among clades were similar across the eight microsatellite loci, while RST showed high variance (Fig. 4). Haplotype networks revealed fixed base pair differences between the Taiwanese and south-western/central mtDNA phylogroups, while haplotypes were shared between the south-western and central phylogroups (Fig. 5). Both south-western and central phylogroups contained private haplotypes, suggesting that the two mtDNA phylogroups also diverged to some extent in sequencebased nuclear loci.
Figure
2.
Neighbor-joining tree and population structure based on allelic frequencies of microsatellite data. (a) Neighbor-joining tree based on Cavalli-Sforza's chord distance (Dc). Numbers above branches are percentage bootstrap support values from 1000 replicates (only values > 75% shown). (b) Bayesian-based cluster analysis implemented in STRUCTURE. Each vertical bar represents one individual and its probability of being assigned to clusters (K = 2).
Figure
5.
Haplotype networks of the two sequence-based nuclear loci. Each circle represents a haplotype; the size of the circle is proportional to the frequency of the haplotype. Dots represent unsampled haplotypes and dashes their corresponding mutation steps.
Suitability of microsatellite markers in resolving genetic structures
The mutation rates of microsatellite markers are several orders of magnitude higher than sequence-based nuclear markers and are expected therefore to have higher resolving power of genetic structures (Estoup and Angers, 1998). However, inconsistent with the expectation, the estimates of genetic divergence among mtDNA phylogroups of Green-backed Tit were much lower in microsatellites than in sequence-based nuclear data. Specifically, the south-western and central mtDNA phylogroups each contained private nuclear haplotypes, which suggested that the two phylogroups were also divergent to some extent in sequence-based nuclear loci (Fig. 5). Nevertheless, the microsatellite data failed to detect any genetic divergence across the Asian continent (Fig. 2). The allelic size distributions between the southwestern and central phylogroups were similar across the eight microsatellite loci, and limited private alleles were found in continental populations (Fig. 3, Table 1). The RST, GST and D values between the south-western and central phylogroups were small. FST values among clades were about four times lower in microsatellite loci than that in sequence-based loci.
Two possible reasons may explain the lower genetic structure in the microsatellite data: size homoplasy of microsatellites and strong selection pressure on sequence-based loci (Epperson, 2005; Li et al., 2010b; Storchová et al., 2010). The Chakraborty's amalgamation and Ewens-Watterson tests did not show significant differences for any sequence-based nuclear loci, which suggests that neutral selection may not be the cause. Therefore, we think that reduced genetic differentiation in microsatellite loci may result from size homoplasy. In agreement with this explanation, we found that observed heterozygosity per locus was lower than expected for most sampling sites (Table 1).
Size homoplasy is closely related to effective population size (Nauta and Weissing, 1996). Populations with a large effective population tend to have higher size homoplasy than populations with a small effective population (Estoup et al., 2002). The effective population size of the continental clade was larger than that of the Taiwanese clade. Therefore, it is likely that the continental clade was more affected by size homoplasy and the Taiwanese clade to a lesser extent. In agreement with this expectation, the genetic distinctiveness of the Taiwanese phylogroup was resolved, while no genetic distinct group was uncovered in the Asian continent. The ranges of allele sizes largely overlapped between the south-western and central phylogroups, with only partial overlapping between the Taiwanese and continental clades. As well, it should be noted that the two Taiwanese populations (NT and HL) have a much higher level of private alleles than the continental populations.
Based on these results, we suggest that our microsatellite markers are less suitable than sequence-based nuclear markers in resolving genetic divergence, especially for populations with large effective population sizes. However, when effective population size is small, differences among marker types are less pronounced. Besides effective population size, size homoplasy also depends on the mutation rates of microsatellite loci (Estoup et al., 2002). The large variation in the number of alleles, detected across the eight microsatellite loci (from seven in Pma48m to 22 in Titgata87), represents large differences in rates of mutation. The relationship between locus variability (typically represented as allele diversity) and the magnitude of population differentiation is under debate. Some suggest that highly variable loci could increase the power for estimating genetic structures (Epperson, 2004), while others argue that high levels of locus polymorphism may underestimate population differentiation because of size homoplasy (Estoup et al., 2002; O'Reilly et al., 2004). Previous studies revealed a negative relationship between allele diversity and estimated FST values (O'Reilly et al., 2004; Olsen et al., 2004). However, our study did not find a significant correlation between FST values and allelic size variability (Fig. 4), which indicates that the efficiency of microsatellite loci in detecting genetic structure may be independent of their polymorphism.
RST is an FST-analogue, but this statistic takes into account the difference in repeat numbers and assumes a stepwise mutation model. It has been suggested that RST provides less biased estimates of population divergence than FST under the stepwise mutation model (Slatkin, 1995). However, this feature no longer holds when the stepwise model is violated (Slatkin, 1995). This is likely the case of microsatellite loci with rather complex mutation models (Angers and Bernatchez, 1997). It has also been suggested that even under the strict stepwise mutation model, FST is better than RST when sample sizes are moderate and small and the number of loci scored is low due to the high variance of RST (Gaggiotti et al., 1999; Balloux and Lugon-Moulin, 2002). In contrast to the stable FST, our results revealed that the variance of RST across microsatellite loci was high (Fig. 4). Therefore, in agreement with previous studies, our study shows that high variance restricts the suitability of RST.
Role of geographical isolation in genetic diversification
Although genetic diversification within the Asian continent has not been resolved, our microsatellite data did recover the genetic distinctness of the Taiwanese clade. In agreement with the microsatellite results, the Taiwanese clade had fixed base pair differences in mtDNA as well as in sequence-based nuclear loci (Wang et al., 2013). The genetic distinctiveness of the Taiwanese population has been found in other studies of birds (Song et al., 2009; Liu et al., 2012), plants (Gao et al., 2007; Chou et al., 2011) and insects (Lee and Lin, 2012). Taiwan has also been regarded as an important zoogeographic region (Zheng and Zhang, 1959; Zhang, 1999) and an area of endemism (Lei et al., 2007; López-Pujol et al., 2011). All these observations suggest the evolutionary peculiarity of Taiwanese taxa.
It has been suggested that most Taiwanese taxa colonized the island from the Asian continent during land bridge connections when the climate was cooler (Kano, 1940). Geographical isolation has been emphasized as the most important factor for intraspecific and interspecific diversification between Taiwan and continental taxa (Grant and Grant, 1998; Lei et al., 2007). However, the land bridge between Taiwan and the adjacent Asian continent formed and submerged intermittently during Pleistocene glacial cycles (Voris, 2000). Therefore, the geographical barrier was restricted largely to interglacial periods. When the land bridge formed during glacial periods, gene exchange between Taiwan and continental taxa was possible. Recent studies, using coalescentbased methods [e.g. isolation with migration (IM; Hey, 2005) and approximate Bayesian computation (ABC; Pritchard et al., 1999)], have revealed that bidirectional gene flow existed in the sibling hwamei species (Li et al., 2010a) and Euphaea damselflies species (Lee and Lin, 2012) during land bridge connections. These studies suggest that the role of geographical barriers in genetic differentiation may not be as important as previously suggested. Other factors which can counter the homogenizing effect of gene flows, such as natural selection and sexual selection, may be important drivers of genetic diversification (Li et al., 2010a; Lee and Lin, 2012). The interconnected area between Taiwanese and continental taxa is much larger in the Green-backed Tit than that in the hwameis and Euphaea damselflies species. The disjunct area in both the hwameis and Euphaea damselflies species is restricted to the Taiwan land bridge. There is no unsuitable habitat on the Asian continent. Nevertheless, there is a large area in southeastern China without Green-backed Tits. Therefore, it is less likely that the Taiwanese and the continental populations of the Green-backed Tit would experience gene exchange during glacial periods. In addition, the ecological niche of the Green-backed Tit is different from that of the hwameis and Euphaea damselflies species. The Green-backed Tit is a montane species that generally occupies higher elevations, with an approximate range of 1000 to 3000 m (Li et al., 1982). Palaeovegetation maps of the Last Glacial Maximum indicate the interconnected land bridge area was covered by steppes, semi-arid temperate woodland or scrub habitats (Harrison et al., 2001; Ray and Adams, 2001), currently not suitable for the Green-backed Tit. Moreover, the results of ecological niche modeling have suggested that there was no habitat suitable for the Green-backed Tit on the interconnected area during the Last Glacial Maximum (Wang et al., 2013). Therefore, in contrast to the divergence with our gene flow scenario, genetic differentiation in the Green-backed Tit may involve allopatric divergence without gene flows. Nevertheless, to resolve the history of divergence between the Taiwanese and continental populations properly, coalescent-based analyses are required in further investigations.
Acknowledgments
We thank Zuohua YIN, Gang SONG, Wulin LIU, Huatao LIU and Bin GAO for field assistance and Chunlan ZHANG, Ruiying ZHANG, Yongjie WU, Deyan GE and Baoyan LIU for assistance with data analyses. This study was supported by the National Science Fund for Distinguished Young Scientists (No. 30925008), the Major International (Regional) Joint Research Project (No. 31010103901), the CAS-IOZ Innovation Program (KSCX2-EW-J-2) and by a grant (No. O529YX5105) from the Key Laboratory of the Zoological Systematics and Evolution of the Chinese Academy of Sciences to F.M. Lei.
Adams RI, Brown KM, Hamilton MB. 2004. The impact of microsatellite electromorph size homoplasy on multilocus population structure estimates in a tropical tree (Corythophora alta) and an anadromous fish (Morone saxatilis). Mol Ecol, 13: 2579–2588.
Angers B, Bernatchez L. 1997. Complex evolution of a salmonid microsatellite locus and its consequences in inferring allelic divergence from size information. Mol Biol Evol, 14: 230–238.
Avise JC, Arnold J, Ball RM, Bermingham E, Lamb T, Neigel JE, Reeb CA, Saunders NC. 1987. Intraspecific phylogeography: the mitochondrial DNA bridge between poulation genetics and systematics. Annu Rev Ecol Syst, 18: 489–522.
Axelsson E, Smith NGC, Sundström H, Berlin S, Ellegren H. 2004. Male-biased mutation rate and divergence in autosomal, Z-linked and W-linked introns of chicken and turkey. Mol Biol Evol, 21: 1538.
Ballard JWO, Whitlock MC. 2004. The incomplete natural history of mitochondria. Mol Ecol, 13: 729–744.
Balloux F, Lugon-Moulin N. 2002. The estimation of population differentiation with microsatellite markers. Mol Ecol, 11: 155–165.
Brito PH, Edwards SV. 2008. Multilocus phylogeography and phylogenetics using sequence-based markers. Genetica, 135: 439–455.
Brunner P, Douglas M, Bernatchez L. 1998. Microsatellite and mitochondrial DNA assessment of population structure and stocking effects in Arctic charr Salvelinus alpinus (Teleostei: Salmonidae) from central Alpine lakes. Mol Ecol, 7: 209–223.
Chakraborty R. 1990. Mitochondrial DNA polymorphism reveals hidden heterogeneity within some Asian populations. Am J Hum Genet, 47: 87.
Chapuis MP, Estoup A. 2007. Microsatellite null alleles and estimation of population differentiation. Mol Biol Evol, 24: 621.
Chou YW, Thomas PI, Ge XJ, LePage BA, Wang CN. 2011. Refugia and phylogeography of Taiwania in East Asia. J Biogeogr, 38: 1992–2005.
Clement M, Posada D, Crandall KA. 2000. TCS: a computer program to estimate gene genealogies. Mol Ecol, 9: 1657–1659.
Dai C, Chen K, Zhang R, Yang X, Yin Z, Tian H, Zhang Z, Hu Y, Lei F. 2010. Molecular phylogenetic analysis among species of Paridae, Remizidae and Aegithalos based on mtDNA sequences of COI and cyt b. Chinese Birds, 1: 112–123.
Earl DA. 2012. STRUCTURE HARVESTER: a website and program for visualizing STRUCTURE output and implementing the Evanno method. Conserv Genet Resour, 4: 359–361.
Edwards S, Bensch S. 2009. Looking forwards or looking backwards in avian phylogeography? A comment on Zink and Barrowclough 2008. Mol Ecol, 18: 2930–2933.
Epperson BK. 2004. Multilocus estimation of genetic structure within populations. Theoret Popul Biol, 65: 227–237.
Epperson BK. 2005. Mutation at high rates reduces spatial structure within populations. Mol Ecol, 14: 703–710.
Estoup A, Angers B. 1998. Theoretical and empirical considerations. Adv Mol Ecol, 306: 55.
Estoup A, Jarne P, Cornuet JM. 2002. Homoplasy and mutation model at microsatellite loci and their consequences for population genetics analysis. Mol Ecol, 11: 1591–1604.
Evanno G, Regnaut S, Goudet J. 2005. Detecting the number of clusters of individuals using the software STRUCTURE: a simulation study. Mol Ecol, 14: 2611–2620.
Ewens WJ. 1972. The sampling theory of selectively neutral alleles. Theor Popul Biol, 3: 87–112.
Excoffier L, Laval G, Schneider S. 2005. Arlequin version 3.0: an integrated software package for population genetics data analysis. Evol Bioinform Online, 1: 47–50.
Falush D, Stephens M, Pritchard JK. 2007. Inference of population structure using multilocus genotype data: dominant markers and null alleles. Mol Ecol Notes, 7: 574–578.
Felsenstein J. 1989. PHYLIP-phylogeny inference package version 3.2. Cladistics, 5: 164–166.
Gaggiotti O, Lange O, Rassmann K, Gliddon C. 1999. A comparison of two indirect methods for estimating average levels of gene flow using microsatellite data. Mol Ecol, 8: 1513–1520.
Gao LM, Möller M, Zhang XM, Hollingsworth ML, Liu J, Mill RR, Gibby M, Li DZ. 2007. High variation and strong phylogeographic pattern among cpDNA haplotypes in Taxus wallichiana (Taxaceae) in China and North Vietnam. Mol Ecol, 16: 4684–4698.
Gill FB, Slikas B, Sheldon FH, Fleischer. 2005. Phylogeny of titmice Paridae: Ⅱ. Species relationships based on sequences of the mitochondrial cytochrome-b gene. Auk, 122: 121–143.
Goudet J. 2001. FSTAT, a program to estimate and test gene diversities and fixation indices version 2.9.3. http://www2.unil.ch/popgen/softwares/fstat.htm.
Grant PR, Grant BR. 1998. Speciation and hybridization of birds on islands. In: Grant PR (ed) Evolution on Islands. Oxford University Press, Oxford, pp 142–162.
Haasl RJ, Payseur BA. 2010. Multi-locus inference of population structure: a comparison between single nucleotide polymorphisms and microsatellites. Heredity, 106: 158–171.
Harrison S, Yu G, Takahara H, Prentice I. 2001. Diversity of temperate plants in east Asia. Nature, 413: 129–130.
Hedrick PW. 1999. Perspective: highly variable loci and their interpretation in evolution and conservation. Evolution, 53: 313–318.
Hey J. 2005. On the number of New World founders: a population genetic portrait of the peopling of the Americas. PLoS Biol, 3: e193.
Jost L. 2008. GST and its relatives do not measure differentiation. Mol Ecol, 17: 4015–4026.
Jost L. 2009. D vs. GST: response to Heller and Siegismund (2009) and Ryman and Leimar (2009). Mol Ecol, 18: 2088–2091.
Kano T. 1940. Zoogeographical Studies of the Tsugitaka Mountains of Formosa. Shibusawa Institute for Ethnographical Researches, Tokyo.
Kawano KM. 2003. Isolation of polymorphic microsatellite markers in the great tit Parus major minor. Mol Ecol Notes, 3: 314–315.
Lee YH, Lin CP. 2012. Pleistocene speciation with and without gene flow in Euphaea damselflies of subtropical and tropical East Asian islands. Mol Ecol, 21: 3739–3756.
Lei FM, Wei GA, Zhao HF, Yin ZH, Lu JL. 2007. China subregional avian endemism and biodiversity conservation. Biodiver Conserv, 16: 1119–1130.
Leng L, Zhang DX. 2011. Measuring population differentiation using GST or D? A simulation study with microsatellite DNA markers under a finite island model and nonequilibrium conditions. Mol Ecol, 20: 2494–2509.
Li G, Zheng B, Liu G. 1982. Aves Vol. 13 Passeriformes: Paridae - Zosteropidae. Fauna Sinica. Science Press, Beijing.
Li JW, Yeung CKL, Tsai PW, Lin RC, Yeh CF, Yao CT, Han L, Hung LM, Ding P, Wang Q, Li SH. 2010a. Rejecting strictly allopatric speciation on a continental island: prolonged postdivergence gene flow between Taiwan (Leucodioptron taewanus, Passeriformes Timaliidae) and Chinese (L. canorum canorum) hwameis. Mol Ecol, 19: 494–507.
Li SH, Yeung CKL, Han L, Le MH, Wang C, Ding P, Yao C. 2010b. Genetic introgression between an introduced babbler, the Chinese hwamei Leucodioptron c. canorum, and the endemic Taiwan hwamei L. taewanus: a multiple marker systems analysis. J Avian Biol, 41: 64–73.
Liu H, Wang W, Song G, Qu Y, Li SH, Fjelds J, Lei F. 2012. Interpreting the process behind endemism in china by integrating the phylogeography and ecological niche models of the Stachyridopsis ruficeps. PLoS ONE, 7: e46761.
López-Pujol J, Zhang FM, Sun HQ, Ying TS, Ge S. 2011. Centres of plant endemism in China: places for survival or for speciation? J Biogeogr, 38: 1267–1280.
Meirmans PG. 2009. GenoDive version 2.0b14. Computer software distributed by the author. Available from: .
Meirmans PG, Hedrick PW. 2011. Assessing population structure: FST and related measures. Mol Ecol Resour, 11: 5–18.
Nauta MJ, Weissing FJ. 1996. Constraints on allele size at microsatellite loci: implications for genetic differentiation. Genetics, 143: 1021.
Nei M. 1978. Estimation of average heterozygosity and genetic distance from a small number of individuals. Genetics, 89: 583–590.
Olsen JB, Habicht C, Reynolds J, Seeb JE. 2004. Moderately and highly polymorphic microsatellites provide discordant estimates of population divergence in sockeye salmon, Oncorhynchus nerka. Environ Biol Fishes, 69: 261–273.
O'Reilly PT, Canino MF, Bailey KM, Bentzen P. 2004. Inverse relationship between FST and microsatellite polymorphism in the marine fish, walleye pollock (Theragra chalcogramma): implications for resolving weak population structure. Mol Ecol, 13: 1799–1814.
Park SDE. 2001. Trypanotolerance in West African Cattle and the Population Genetic Effects of Selection. Ph. D. thesis. University of Dublin, Dublin.
Pritchard JK, Seielstad MT, Perez-Lezaun A, Feldman MW. 1999. Population growth of human Y chromosomes: a study of Y chromosome microsatellites. Mol Biol Evol, 16: 1791–1798.
Ray N, Adams JM. 2001. A GIS-based vegetation map of the world at the last glacial maximum (25, 000–15, 000 BP). Int Archaeol, 11: 1–44.
Raymond M, Rousset F. 1995. GENEPOP version 1.2: population genetics software for exact tests and ecumenicism. J Heredity, 86: 248.
Rosenberg NA, 2004. DISTRUCT: a program for the graphical display of population structure. Mol Ecol Notes, 4: 137–138.
Saladin V, Bonfils D, Binz T, Richner H. 2003. Isolation and characterization of 16 microsatellite loci in the Great Tit Parus major. Mol Ecol Notes, 3: 520–522.
Schlötterer C. 2000. Evolutionary dynamics of microsatellite DNA. Chromosoma, 109: 365–371.
Selkoe KA, Toonen RJ. 2006. Microsatellites for ecologists: a practical guide to using and evaluating microsatellite markers. Ecol Lett, 9: 615–629.
Slatkin M. 1995. A measure of population subdivision based on microsatellite allele frequencies. Genetics, 139: 457.
Song G, Qu Y, Yin Z, Li S, Liu N, Lei F. 2009. Phylogeography of the Alcippe morrisonia (Aves: Timaliidae): long population history beyond late Pleistocene glaciations. BMC Evol Biol, 9: 143.
Storchová R, Reif J, Nachman MW. 2010. Female heterogamety and speciation: reduced introgression of the Z chromosome between two species of nightingales. Evolution, 64: 456–471.
Takezaki N, Nei M. 1996. Genetic distances and reconstruction of phylogenetic trees from microsatellite DNA. Genetics, 144: 389.
Tonione M, Johnson JR, Routman EJ. 2010. Microsatellite analysis supports mitochondrial phylogeography of the hellbender (Cryptobranchus alleganiensis). Genetica, 139: 209–219.
Van Oosterhout C, Hutchinson WF, Wills DPM, Shipley P. 2004. MICRO-CHECKER: software for identifying and correcting genotyping errors in microsatellite data. Mol Ecol Notes, 4: 535–538.
Voris HK. 2000. Maps of Pleistocene sea levels in Southeast Asia: shorelines, river systems and time durations. J Biogeogr, 27: 1153–1167.
Wang MT, Hsu YC, Yao CT, Li SH. 2005. Isolation and characterization of 12 tetranucleotide repeat microsatellite loci from the green-backed tit (Parus monticolus). Mol Ecol Notes, 5: 439–442.
Wang WJ, McKay BD, Dai CY, Zhao N, Zhang RY, Qu YH, Song G, Li SH, Liang W, Yang XJ, Pasquet E, Lei FM. 2013. Glacial expansion and diversification of an East Asian montane bird, the green-backed tit (Parus monticolus). J Biogeogr, 40: 1156–1169.
Watterson G. 1974. The sampling theory of selectively neutral alleles. Advances Appl Probab, 6: 463–488.
Wright S. 1965. The interpretation of population structure by F-statistics with special regard to systems of mating. Evolution, 19: 395–420.
Zhang DX, Hewitt GM. 2003. Nuclear DNA analyses in genetic studies of populations: practice, problems and prospects. Mol Ecol, 12: 563–584.
Zhang RZ. 1999. Zoogeographic Regions of China. Science Press, Beijing.
Zheng ZX, Zhang RZ. 1959. Delimitation of Zoogeographic Regions and Insect Zoogeographic Regions of China. Science Press, Beijing
Zink RM, Barrowclough GF. 2008. Mitochondrial DNA under siege in avian phylogeography. Mol Ecol, 17: 2107–2121.
Zink RM. 2010. Drawbacks with the use of microsatellites in phylogeography: the song sparrow Melospiza melodia as a case study. J Avian Biol, 41: 1–7.
Carles Tobella, Marc Franch, Josep M. Bas, et al. Spatial Dynamics and Lifespan of Adult Cicadas After Fire and Logging: A Radiotracking Study. Integrative Zoology, 2025.
DOI:10.1111/1749-4877.12970
2.
Jonas Bush, Cynthia Webster, Jill Wegrzyn, et al. Chromosome-Level Genome Assembly and Annotation of a Periodical Cicada Species: Magicicada septendecula. Genome Biology and Evolution, 2024, 16(1)
DOI:10.1093/gbe/evae001
3.
Shohei G. Tsujimoto, Dai Koide, Naoki H. Kumagai, et al. Exploring the factors influencing the first singing date of a cicada, Graptopsaltria nigrofuscata: How will it be affected by climate change?. Ecological Entomology, 2024, 49(6): 837.
DOI:10.1111/een.13357
4.
Xingcheng Xie, Han Guo, Juan Liu, et al. Edible and Medicinal Progress of Cryptotympana atrata (Fabricius) in China. Nutrients, 2023, 15(19): 4266.
DOI:10.3390/nu15194266
5.
Pere Pons, Roger Puig-Gironès, Carles Tobella, et al. Cicada-MET: an efficient ecological monitoring protocol of cicada populations. Frontiers in Ecology and Evolution, 2023, 11
DOI:10.3389/fevo.2023.1219636
6.
Ivan Sazima, Marlies Sazima. Cicada feast and food links: Grey-headed flying fox preys on black prince in south-East Australia. Food Webs, 2023, 37: e00318.
DOI:10.1016/j.fooweb.2023.e00318
7.
Raquel Mendes, Vera L. Nunes, Eduardo Marabuto, et al. Testing drivers of acoustic divergence in cicadas (Cicadidae: Tettigettalna). Journal of Evolutionary Biology, 2023, 36(2): 461.
DOI:10.1111/jeb.14133
8.
Yuya Suzuki, Wataru Mukaimine. Prey–predator interactions and body size relationships between annual cicadas and spiders in Japan. Journal of Natural History, 2021, 55(43-44): 2749.
DOI:10.1080/00222933.2021.2019340
9.
K. Tomita, T. Hiura. Reforestation provides a foraging habitat for brown bears (Ursus arctos) by increasing cicada Lyristes bihamatus density in the Shiretoko World Heritage site. Canadian Journal of Zoology, 2021, 99(3): 205.
DOI:10.1139/cjz-2020-0222
10.
Kanji Tomita. Camera traps reveal interspecific differences in the diel and seasonal patterns of cicada nymph predation. The Science of Nature, 2021, 108(6)
DOI:10.1007/s00114-021-01762-w
Table
1.
Summary of genetic diversity in the Green-backed Tit (Parus monticolus)
Population code
Location
Longitude (°)
Latitude (°)
n
A
PA
AR
HO
HE
South-western
42
3.33
4
7.75
0.62
0.66
ZM
Zhangmu
85.988
27.989
4
3.75
1
1.67
0.66
0.67
MY
Miyi
101.899
27.127
5
4.13
0
1.67
0.55
0.67
YB
Yanbian
101.535
27.106
13
6.00
1
1.68
0.70
0.68
YL
Yulong
100.261
27.097
2
2.63
0
1.67
0.69
0.67
BS
Baoshan
98.783
24.820
11
5.38
1
1.64
0.57
0.64
BM
Bomi
95.759
29.873
2
2.25
0
1.58
0.56
0.58
CY
Chayu
97.084
28.562
5
4.00
0
1.64
0.53
0.64
Central
88
3.27
12
9.88
0.67
0.72
ZQ
Zhouqu
104.171
33.697
2
2.38
1
1.56
0.56
0.56
ZZ
Zhouzhi
108.221
34.160
9
5.38
0
1.71
0.66
0.71
FP
Foping
107.768
33.596
10
5.75
0
1.72
0.67
0.72
NS
Ningshan
108.318
33.313
3
3.50
0
1.76
0.71
0.76
HP
Haoping
107.711
34.088
12
6.50
1
1.68
0.66
0.68
MG
Meigu
103.308
28.518
7
5.63
2
1.72
0.73
0.72
DX
Dingxi
110.195
31.566
8
5.00
0
1.69
0.73
0.69
BQ
Banqiao
108.638
29.933
4
3.63
0
1.66
0.70
0.66
LJS
Laojunshan
110.918
31.880
4
4.50
0
1.76
0.66
0.76
LD
Luding
102.277
29.920
6
4.50
0
1.70
0.63
0.70
SM
Shimian
102.338
29.100
4
3.63
1
1.69
0.59
0.69
LL
Longlin
104.871
24.666
1
1.63
0
1.63
0.63
0.63
GD
Guiding
107.135
26.582
3
3.63
0
1.76
0.67
0.76
KKS
Kuankuoshui
107.190
27.947
13
6.50
1
1.74
0.66
0.74
LS
Leishan
108.078
26.384
2
2.88
0
1.79
0.81
0.79
Taiwanese
24
2.90
18
6.88
0.60
0.64
NT
Nantou
121.182
23.977
14
5.13
5
1.56
0.53
0.58
HL
Hualian
121.388
24.192
10
5.50
14
1.61
0.71
0.61
Note: n, sample size; A, average number of alleles per locus; PA, private allele; AR, allelic richness; HO, observed heterozygosity; and HE, expected heterozygosity.

 DownLoad:


 Email Alerts
 RSS Feeds