D.C. Deeming, E.P. Bayliss, E. Ketley. 2025: Size of the ulna and taxonomic order affect vane dimensions of secondary remiges in birds. Avian Research, 16(1): 100245. DOI: 10.1016/j.avrs.2025.100245
Citation:
D.C. Deeming, E.P. Bayliss, E. Ketley. 2025: Size of the ulna and taxonomic order affect vane dimensions of secondary remiges in birds. Avian Research, 16(1): 100245. DOI: 10.1016/j.avrs.2025.100245
D.C. Deeming, E.P. Bayliss, E. Ketley. 2025: Size of the ulna and taxonomic order affect vane dimensions of secondary remiges in birds. Avian Research, 16(1): 100245. DOI: 10.1016/j.avrs.2025.100245
Citation:
D.C. Deeming, E.P. Bayliss, E. Ketley. 2025: Size of the ulna and taxonomic order affect vane dimensions of secondary remiges in birds. Avian Research, 16(1): 100245. DOI: 10.1016/j.avrs.2025.100245
The number of secondary feathers varies among orders of birds with some orders exhibiting a positive relationship with ulna length, whereas in other orders secondary number is invariant. This difference has implications for scaling of the width of the feather vane within orders. In those species where the number of secondary remiges is invariant with ulna length, vane width should scale isometrically with ulna size to maintain an aerodynamic flight surface. Where feather count increases with increasing ulna length then vane width should exhibit negative allometry. Vane length should also correlate with ulna length, irrespective of the number of feathers. Data were compiled from an online library of images for the vane length and the width of the vane at 50% of the vane length for the fifth secondary feather for 209 bird species from 24 different orders. The results supported the hypotheses that vane width is a function of ulna size, and the number of secondary feathers as associated with different orders. Vane length was unaffected by the number of secondaries but varied between orders. The results suggest that birds have solved the problem of maintaining the aerodynamic surface of the proximal wing in two ways. Hence as ulna length increases the first solution involves more feathers that exhibit negative allometry for vane width, or in the second where feather count doesn’t change, the vane width simply scales isometrically. The implications for the mechanical properties of the vane, and how it affects wing function, have not yet been explored in a range of birds.
Avian flight is made possible because of the combination of a specialised forelimb skeleton associated with feathers that form a flight surface, and the musculature that powers wing movement (Ritchison, 2023). The size and number of the feathers constituting the wing will affect the dimensions and shape of the aerofoil surface and this can affect flight styles (Ritchison, 2023). Recently, the number of flight feathers (remiges) has been investigated in relation to elements of skeletal size of the forelimb. There are typically ten primary remiges attached to the manus in many species (Deeming et al., 2024a) although this can vary from nine to eleven in a few species (Kiat and O’Connor, 2024). The number of primary remiges was unrelated to manus length (Deeming et al., 2024a). By contrast, the number of secondary remiges exhibited a positive relationship with ulna length (to which they are attached) when all birds are considered together (Deeming et al., 2024a; Kiat and O’Connor, 2024). However, there were orders, e.g., the Passeriformes and Psittaciformes, where the number of secondaries did not vary among species despite several orders of magnitude change in ulna length (Deeming et al., 2024a). Given that the secondaries form a significant part of the aerodynamic surface of the proximal wing (Able, 2004; Sullivan et al., 2017; Ritchison, 2023) the differences in number of these remiges may have implications for flight ability of individual species. For example, fewer secondaries may restrict the area or structural integrity of the aerofoil surface.
Deeming et al. (2024a) suggested that in orders where secondary number was invariant the width and/or structural characteristics of the feather vane must change as the ulna length increases, to maintain a functional aerofoil. Where the number of secondaries increased with increasing ulna length, presumably the width of the vane would not have to increase to the same extent because the flight surface would be maintained by more but narrower feathers. Kiat and O’Connor (2024) also concluded that the number of secondary remiges was related to flight ability because the number of feathers is reduced in flightless ratites, or it increases in penguins. In other words, contrary to observations by Deeming et al. (2024a), Kiat and O’Connor (2024) concluded that the relationship between ulna length and the number of secondary feathers appears to remain constant in flying taxa, but it varies in flightless taxa.
In parrots (Psittaciformes), vane width for the fifth secondary feather (S5) did not vary to any great extent (±8–10%) among the ten secondary feathers but exhibited positive allometry with body mass in species ranging from 48 to 1200 g (Deeming et al., 2024b). Moreover, vane widths of secondary feathers exhibited highly significant correlations among all secondary feathers from 19 species of parrots (all Pearson r-values ≥0.893 and all p-values <0.001; Deeming unpublished analysis, 2024). Data on the width of secondary feather vanes in other birds are largely unavailable, so this study investigated the relationships between vane width and length with ulna length in birds. The focus was on S5 because this lies centrally on the ulna and was similar in dimensions to adjacent secondaries (in parrots at least). It was considered that investigating all secondaries for all species would not yield any particularly different pattern to that for S5. Collecting data for a large, diverse sample of bird species was, therefore, prioritised over measuring all secondary feathers for fewer species.
Feather vanes are made up of barbs that extend from the central rachis, and which support interlocking barbules that create a surface that is resistant to air movement. Despite this importance, there has been only limited research into barb morphology, density and angle variation across primary flight feathers and how variability of these factors affects the functionality of the vane in flight (Feo et al., 2015; Pap et al., 2019). In particular, previous research has concentrated on exploring the mechanical characteristics of individual barbs (Butler and Johnson, 2004; Sullivan et al., 2016) rather than looking at how feathers interact to form a flight surface.
The analysis described here tested various hypotheses. Firstly, it was predicted that vane width would exhibit isometric scaling with ulna length in those orders where secondary number was invariant (Deeming et al., 2024a), i.e., vane width would increase in proportion as ulna length increased. Secondly, for other orders, where secondary number increased with ulna size (Deeming et al., 2024a), it was predicted that there would be negative allometric scaling, i.e., vane width would get relatively narrower as ulna length increased. Thirdly, because vane length is an important contributor to wing chord length (Fraigneau, 2017; Ritchison, 2023), which is turn reflects other wing dimensions which correlate with body size, it was predicted that the relationship between ulna length and vane length would scale isometrically for any order. Fourthly, since wing shape varies between species because of variation between feather size and number among orders (Deeming et al., 2024a), it was predicted that the relationship between vane length and vane width would be isometric, but the intercepts would vary between orders. Finally, the ratio of vane length to vane width was predicted to be unrelated to ulna length but given variation in wing shape (Ritchison, 2023) would vary among orders.
2.
Materials and methods
Data for the length of the ulna were derived from Nudds (2007). The number of secondary feathers (attached to the ulna) for each species were from a dataset analysed by Deeming et al. (2024a), which had been collated from the featherbase website (Schlusen et al., no date). Additional data for species of parrot (Psittaciformes) were from Deeming et al. (2024b). The working dataset included 209 species from 24 different orders (defined according to del Hoyo (2020)), some of which were only represented by a single species whereas the Passeriformes were represented by 76 species (Appendix Table S1).
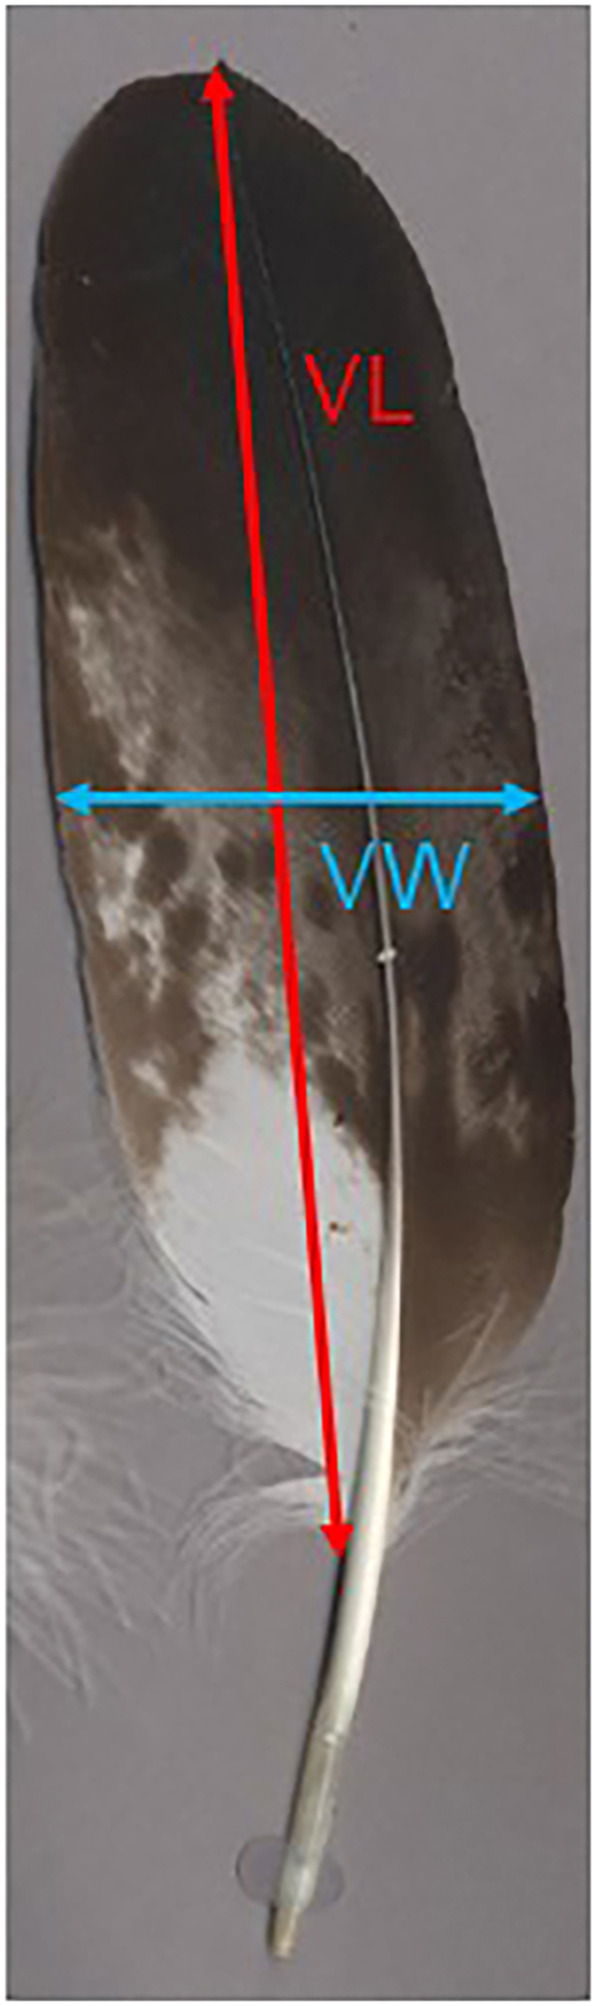
For each species, the fifth secondary feather (S5) was identified on images of feathers available on the featherbase website (Schlusen et al., no date). Using the measurement tool on the website, a measurement was taken between two known points to act as a scale on the image of the feathers. ImageJ (Schneider et al., 2012) was calibrated using the scale and the linear measurement tool was used to determine the length of the vane (in mm) and the width of the vane at 50% the vane length (hereafter, vane width) in mm (Fig. 1).
Figure
1.
Fifth secondary feather showing the measurements for vane width (VW) at 50% of the vane length (VL).
All data were log10-transformed prior to analysis. Phylogenetically controlled generalised linear modelling was performed in R version 4.2.3 (R Development Core Team, 2024) as described previously (Deeming et al., 2022, 2024a). Using the packages ape (Paradis and Schliep, 2019), mvtnorm (Genz et al., 2021), and MASS (Venables and Ripley, 2002), the analysis used code provided by Carl Soulsbury (pers. comm.). A phylogenetic tree of the species in the dataset was produced by pruning a tree of all bird species based on the Hackett backbone using vertlife.org (Jetz et al., 2014). The analysis calculated a phylogenetic signal (λ); a λ value of zero indicated no covariance in the residuals and a shared ancestry, whereas a value of one indicated that a Brownian motion model of trait evolution predicts the observed covariance in residuals (Freckleton et al., 2002).
Initial analysis explored phylogenetically controlled regression estimates for data from all species for the relationship between ulna length with vane width or vane length, and for the relationship between vane length and vane width. The ratio of vane length to width was also calculated and analysed relative to ulna length. Additional analysis explored the data using phylogenetically controlled analysis of covariance that tested the effect of order as a factor whilst controlling for ulna length, or vane length, as a covariate. For these analyses the dataset was edited to only include the 11 orders represented by at least 5 species (186 species from 11 orders, see Appendix Table S1). Analyses were phylogenetically controlled because there was considerable within-order variation in ulna size, which could have biased the results.
Further analysis determined the phylogenetically controlled regression estimates between variables for species in individual orders. Slopes of regression analyses were compared against an isometric relationship with a slope of one using a one-sample, two-tailed t-test (Bailey, 1981). Note that the slopes of the regression analyses between the log value for the number of secondary feathers and the log of ulna length for individual orders (n > 5 species), and whether these relationships exhibited a significant departure from a slope of zero, are shown in Appendix Table S1.
3.
Results
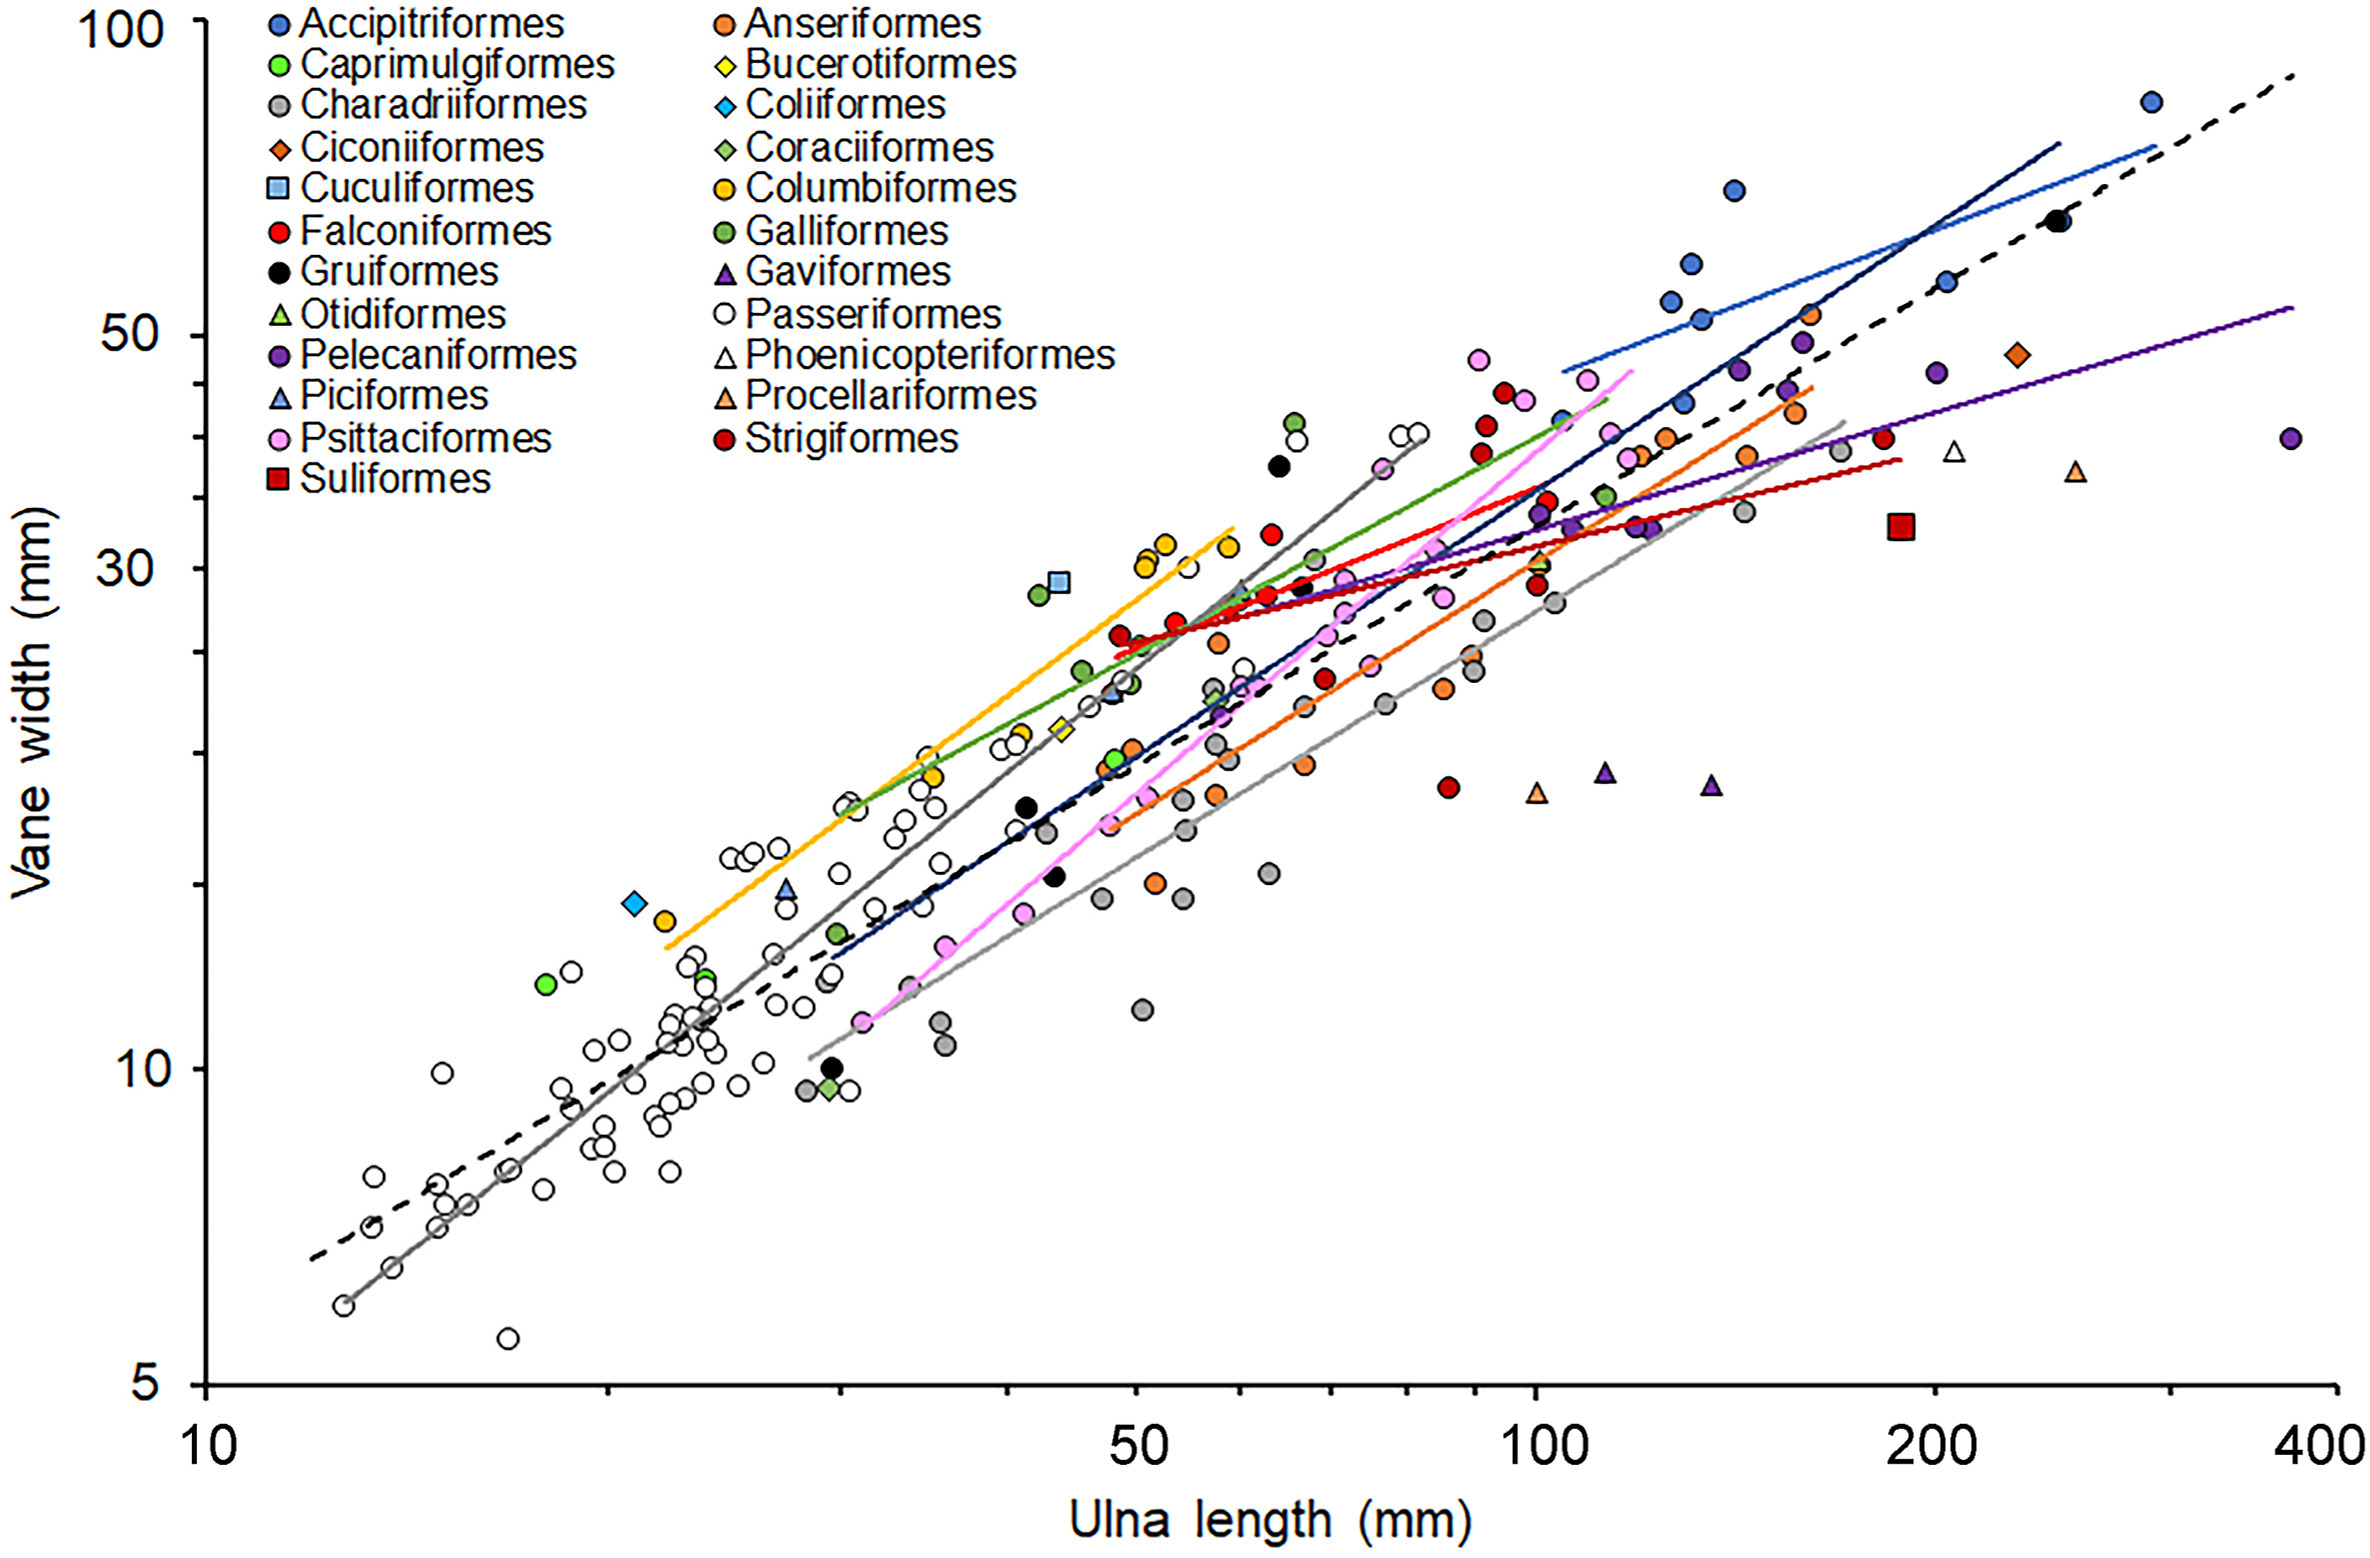
There was a highly significant positive relationship between vane width and ulna length for all species combined (Fig. 2) with a moderate R2 and a high phylogenetic signal (λ; Table 1). The phylogenetically controlled slope of 0.757 was significantly lower than an isometric slope of 1.0 (t207 = −7.15, P < 0.001). However, relationships between these variables varied among orders (Fig. 2) with some having relationships close to parallel to the overall relationship, whereas other orders had steeper slopes (e.g., Passeriformes) and the slopes were quite shallow for several other orders (e.g., Pelecaniformes). Analysis of the subset of the vane width data, where orders were represented by at least five species, showed that there was a significant interaction between log ulna length and order (F10,164 = 5.37, P < 0.0001) confirming that the observed variation in slopes was important. The model also showed a significant positive relationship between log vane width and log ulna length (Fig. 1; F1,164 = 2104.39, P < 0.0001) and order was a significant categorical factor (F10,164 = 11.94, P < 0.0001). The model had an R2 high value of 0.933, and λ was very low (<0.0001) because order explained the phylogenetic relationships.
Figure
2.
Relationships between the length of the ulna and the width of the fifth secondary feather for 209 species representing 24 orders. Dashed line is the phylogenetically controlled regression relationship for all species and coloured lines are relationships for orders represented in the dataset by more than five species (see Table 2 for more details).
Table
1.
Results of phylogenetically controlled generalised linear modelling of the relationships between log ulna length and log values for vane width and length. Data were available for 209 species from 24 orders.
Table
2.
Results of phylogenetically controlled generalised linear modelling of the log:log relationships between width of the fifth secondary feather vane and the length of the ulna for individual orders that were represented by at least five species.
Order
Slope (SE)
t-value (P-value)
Intercept (SE)
t-value (P-value)
R2
λ
Comparison with isometric slope of 1.0
Falconiformes
0.225 (0.191)
1.179 (0.304)
1.032 (0.344)
2.99 (0.040)
0.258
<0.001
t4 = −4.06 (0.015)*
Pelecaniformes
0.373 (0.126)
2.95 (0.018)
0.767 (0.274)
2.83 (0.022)
0.522
<0.001
t8 = −5.00 (0.001)*
Strigiformes
0.418 (0.299)
1.40 (0.211)
0.674 (0.586)
1.15 (0.294)
0.246
<0.001
t6 = −1.95 (0.100)
Accipitriformes
0.483 (0.150)
3.22 (0.015)
0.687 (0.331)
2.07 (0.077)
0.597
<0.001
t7 = −3.45 (0.011)*
Galliformes
0.687 (0.211)
3.25 (0.017)
0.227 (0.367)
0.62 (0.558)
0.638
<0.001
t6 = −1.48 (0.189)
Charadriiformes
0.778 (0.075)
10.32 (<0.001)
−0.121 (0.135)
−0.90 (0.378)
0.835
<0.001
t21 = −2.96 (0.008)*
Anseriformes
0.799 (0.088)
9.07 (<0.001)
−0.115 (0.171)
−0.67 (0.513)
0.873
<0.001
t7 = −2.28 (0.041)*
Gruiformes
0.824 (0.167)
5.05 (0.007)
−0.134 (0.303)
−0.44 (0.682)
0.864
<0.001
t4 = −0.95 (0.398)
Columbiformes
0.941 (0.099)
9.52 (<0.001)
−0.152 (0.162)
−0.94 (0.390)
0.948
<0.001
t5 = −0.60 (0.577)
Passeriformes
1.016 (0.045)
22.81 (<0.0001)
−0.345 (0.063)
−5.47 (<0.001)
0.875
<0.001
t74 = 0.04 (0.397)
Psittaciformes
1.022 (0.065)
15.84 (<0.0001)
−0.453 (0.186)
−2.44 (0.026)
0.937
0.949
t17 = 0.34 (0.370)
Results are ordered in in relation to size for the slope of the regression estimates. The final column indicates the results of a one-way t-test (Bailey, 1981) to compare the slope against an isometric slope of 1.0. *Significant departure from isometry.
Regression relationships between vane width and ulna length for individual orders (Fig. 3) were almost all significant (Table 2). For some orders, notably Passeriformes and Psittaciformes, the relationships were isometric but for other orders, e.g., Anseriformes and Charadriiformes, relationships exhibited significant negative allometry (Table 2).
Figure
3.
Relationships between the length of the ulna and the length of the vane of the fifth secondary feather for 209 species representing 24 orders. Dashed line is the phylogenetically controlled regression relationship for all species and coloured lines are relationships for orders represented in the dataset by more than five species (see Table 3 for more details).
Table
3.
Results of phylogenetically controlled generalised linear modelling of the log:log relationships between the length of the fifth secondary feather vane and the length of the ulna for individual orders that were represented by at least five species.
Order
Slope (SE)
t-value (P-value)
Intercept (SE)
t-value (P-value)
R2
λ
Comparison with isometric slope of 1.0
Falconiformes
0.184 (0.176)
1.04 (0.356)
1.545 (0.317)
4.87 (0.008)
0.214
<0.001
t4 = −4.64 (0.010)*
Pelecaniformes
0.692 (0.089)
7.74 (<0.001)
0.679 (0.192)
3.53 (0.008)
0.882
<0.001
t8 = −3.46 (0.009)*
Gruiformes
0.737 (0.106)
6.92 (0.002)
0.631 (0.193)
3.26 (0.031)
0.923
<0.001
t4 = −2.48 (0.068)
Columbiformes
0.748 (0.254)
2.94 (0.032)
0.689 (0.416)
1.65 (0.159)
0.634
<0.001
t5 = −0.99 (0.367)
Charadriiformes
0.760 (0.078)
9.68 (<0.001)
0.381 (0.140)
2.73 (0.013)
0.817
<0.001
t21 = −3.08 (0.006)*
Accipitriformes
0.763 (0.051)
15.09 (<0.001)
0.588 (0.112)
5.27 (0.001)
0.970
0.983
t17 = 0.34 (0.370)
Passeriformes
0.837 (0.036)
23.05 (<0.0001)
0.538 (0.051)
10.44 (<0.001)
0.878
<0.001
t74 = −4.53 (<0.001)*
Anseriformes
0.873 (0.097)
9.00 (<0.001)
0.265 (0.188)
1.41 (0.185)
0.871
<0.001
t12 = −1.31 (0.215)
Galliformes
0.917 (0.263)
3.47 (0.013)
0.357 (0.457)
0.78 (0.465)
0.668
<0.001
t6 = −0.31 (0.763)
Strigiformes
0.961 (0.177)
5.43 (0.002)
0.133 (0.347)
0.38 (0.715)
0.838
<0.001
t6 = 0.21 (0.837)
Psittaciformes
1.074 (0.060)
17.87 (<0.0001)
0.081 (0.111)
0.73 (0.477)
0.949
<0.001
t17 = 1.23 (0.182)
Results are ordered in in relation to size for the slope of the regression estimates. The final column indicates the results of a one-way t-test (Bailey, 1981) to compare the slope against an isometric slope of 1.0. *Significant departure from isometry.
The relationship between vane length and ulna length was also highly significant (Fig. 3; Table 1) and showed a significant negative allometry (t207 = −7.90, P < 0.001). Slopes of individual orders were similar to the slope for all data with the exception of the relationship for the Falconiformes, which was noticeably shallower (Fig. 3). Phylogenetically controlled regression analyses of the relationship between ulna length and vane length found a significant interaction between log ulna length and order (F10,164 = 2.05, P = 0.031) with a high R2 (0.938) and a low λ (<0.0001). The positive relationship between log vane length and log ulna length was also significant (Fig. 3; F1,164 = 2061.11, P < 0.0001) and order was a significant categorical factor (F10,164 = 37.88, P < 0.0001). To determine whether the interaction was associated with the shallow slope for Falconiformes (Fig. 3), data for this order were excluded from the dataset and the analysis was re-run. The new analysis showed that the interaction term was no longer significant (F9,160 = 1.50, P = 0.150) so the model was simplified (by removing the interaction term) and run again. The data for all birds in orders represented by at least five species now had a common slope of 0.832 (SE = 0.027) for the highly significant relationship between ulna length and vane length (F1,160 = 2045.12, P < 0.0001) and this exhibited significant negative allometry (t207 = −5.81, P < 0.001). The intercepts were significantly different for the various orders (F9,160 = 41.22, P < 0.0001).
There were significant positive relationships between vane length and ulna length for all orders except the Falconiformes (Fig. 3; Table 3). Over half of the orders did not show a significant departure from isometry although some, notably the Falconiformes, exhibited significant negative allometry (Table 3).
There was a highly significant positive relationship between vane length and vane width (Fig. 4; F1,207 = 967.6, P < 0.001, R2 = 0.824; λ = 0.628). The slope of the line was 0.948 (SE = 0.0300), which was not significantly different from an isometric slope of 1.0 (t207 = −1.90, P = 0.091). Closer examination of Fig. 4 showed that for given vane lengths there were noticeably different vane lengths depending on order and for some orders, e.g., Accipitriformes and Pelecaniformes, the slopes of lines were shallower that the relationship for all the data (Fig. 4). Moreover, for any given vane length species of the Passeriformes had narrower vanes than species of the Charadriiformes (Fig. 4). Phylogenetically controlled regression analyses of the relationship between vane length and vane width found a significant interaction between log vane length and order (F10,164 = 2.95, P = 0.002) with a high R2 (0.941) and a low λ (<0.0001). The positive relationship between log vane width and log ulna length was also highly significant (Fig. 4; F10,164 = 2399.87, P < 0.0001) and order was a significant categorical factor (F10,164 = 18.22, P < 0.0001).
Figure
4.
Relationships between the length and the width of the vane of the fifth secondary feather for 209 species representing 24 orders. Dashed line is the phylogenetically controlled regression relationship for all species and coloured lines are relationships for orders represented in the dataset by more than five species (see Table 4 for more details).
Table
4.
Results of phylogenetically controlled generalised linear modelling of the log:log relationships between the length and width of the fifth secondary feather vane for individual orders that were represented by at least five species.
Order
Slope (SE)
t-value (P-value)
Intercept (SE)
t-value (P-value)
R2
λ
Comparison with isometric slope of 1.0
Pelecaniformes
0.595 (0.131)
4.54 (0.002)
0.280 (0.284)
0.99 (0.353)
0.721
<0.001
t8 = −3.09 (0.015)*
Accipitriformes
0.620 (0.196)
3.17 (0.016)
0.345 (0.444)
0.78 (0.463)
0.589
<0.001
t17 = −1.94 (0.0.094)
Strigiformes
0.633 (0.199)
3.18 (0.019)
0.217 (0.402)
0.54 (0.610)
0.627
<0.001
t6 = −1.84 (0.115)
Galliformes
0.731 (0.096)
7.61 (<0.001)
−0.004 (0.187)
−0.02 (0.985)
0.906
<0.001
t6 = −2.80 (0.031)*
Columbiformes
0.848 (0.260)
3.26 (0.023)
−0.236 (0.498)
−0.47 (0.656)
0.680
<0.001
t5 = −0.58 (0.584)
Anseriformes
0.869 (0.083)
10.51 (<0.001)
−0.267 (0.162)
−1.64 (0.126)
0.902
<0.001
t12 = −1.58 (0.140)
Falconiformes
0.944 (0.298)
3.17 (0.034)
−0.333 (0.559)
−0.60 (0.583)
0.715
<0.001
t4 = −1.89 (0.860)
Charadriiformes
0.976 (0.059)
16.62 (<0.001)
−0.429 (0.102)
−4.21 (<0.001)
0.929
<0.001
t21 = −0.41 (0.688)
Psittaciformes
1.001 (0.009)
18.30 (<0.0001)
−0.653 (0.143)
−4.57 (<0.001)
0.952
<0.001
t17 = 1.11 (0.209)
Passeriformes
1.109 (0.058)
19.25 (<0.0001)
−0.819 (0.099)
−8.25 (<0.001)
0.834
<0.001
t74 = 1.88 (0.069)
Gruiformes
1.151 (0.130)
8.87 (0.001)
−0.873 (0.255)
−3.42 (0.027)
0.952
<0.001
t4 = 1.16 (0.181)
Results are ordered in in relation to size for the slope of the regression estimates. The final column indicates the results of a one-way t-test (Bailey, 1981) to compare the slope against an isometric slope of 1.0. *Significant departure from isometry.
There were significant positive relationships between vane length and vane width for all orders except the Falconiformes and Strigiformes (Fig. 4; Table 4). Only two orders had a significant departure from isometry, both Pelecaniformes and Galliformes exhibited significant negative allometry (Table 4).
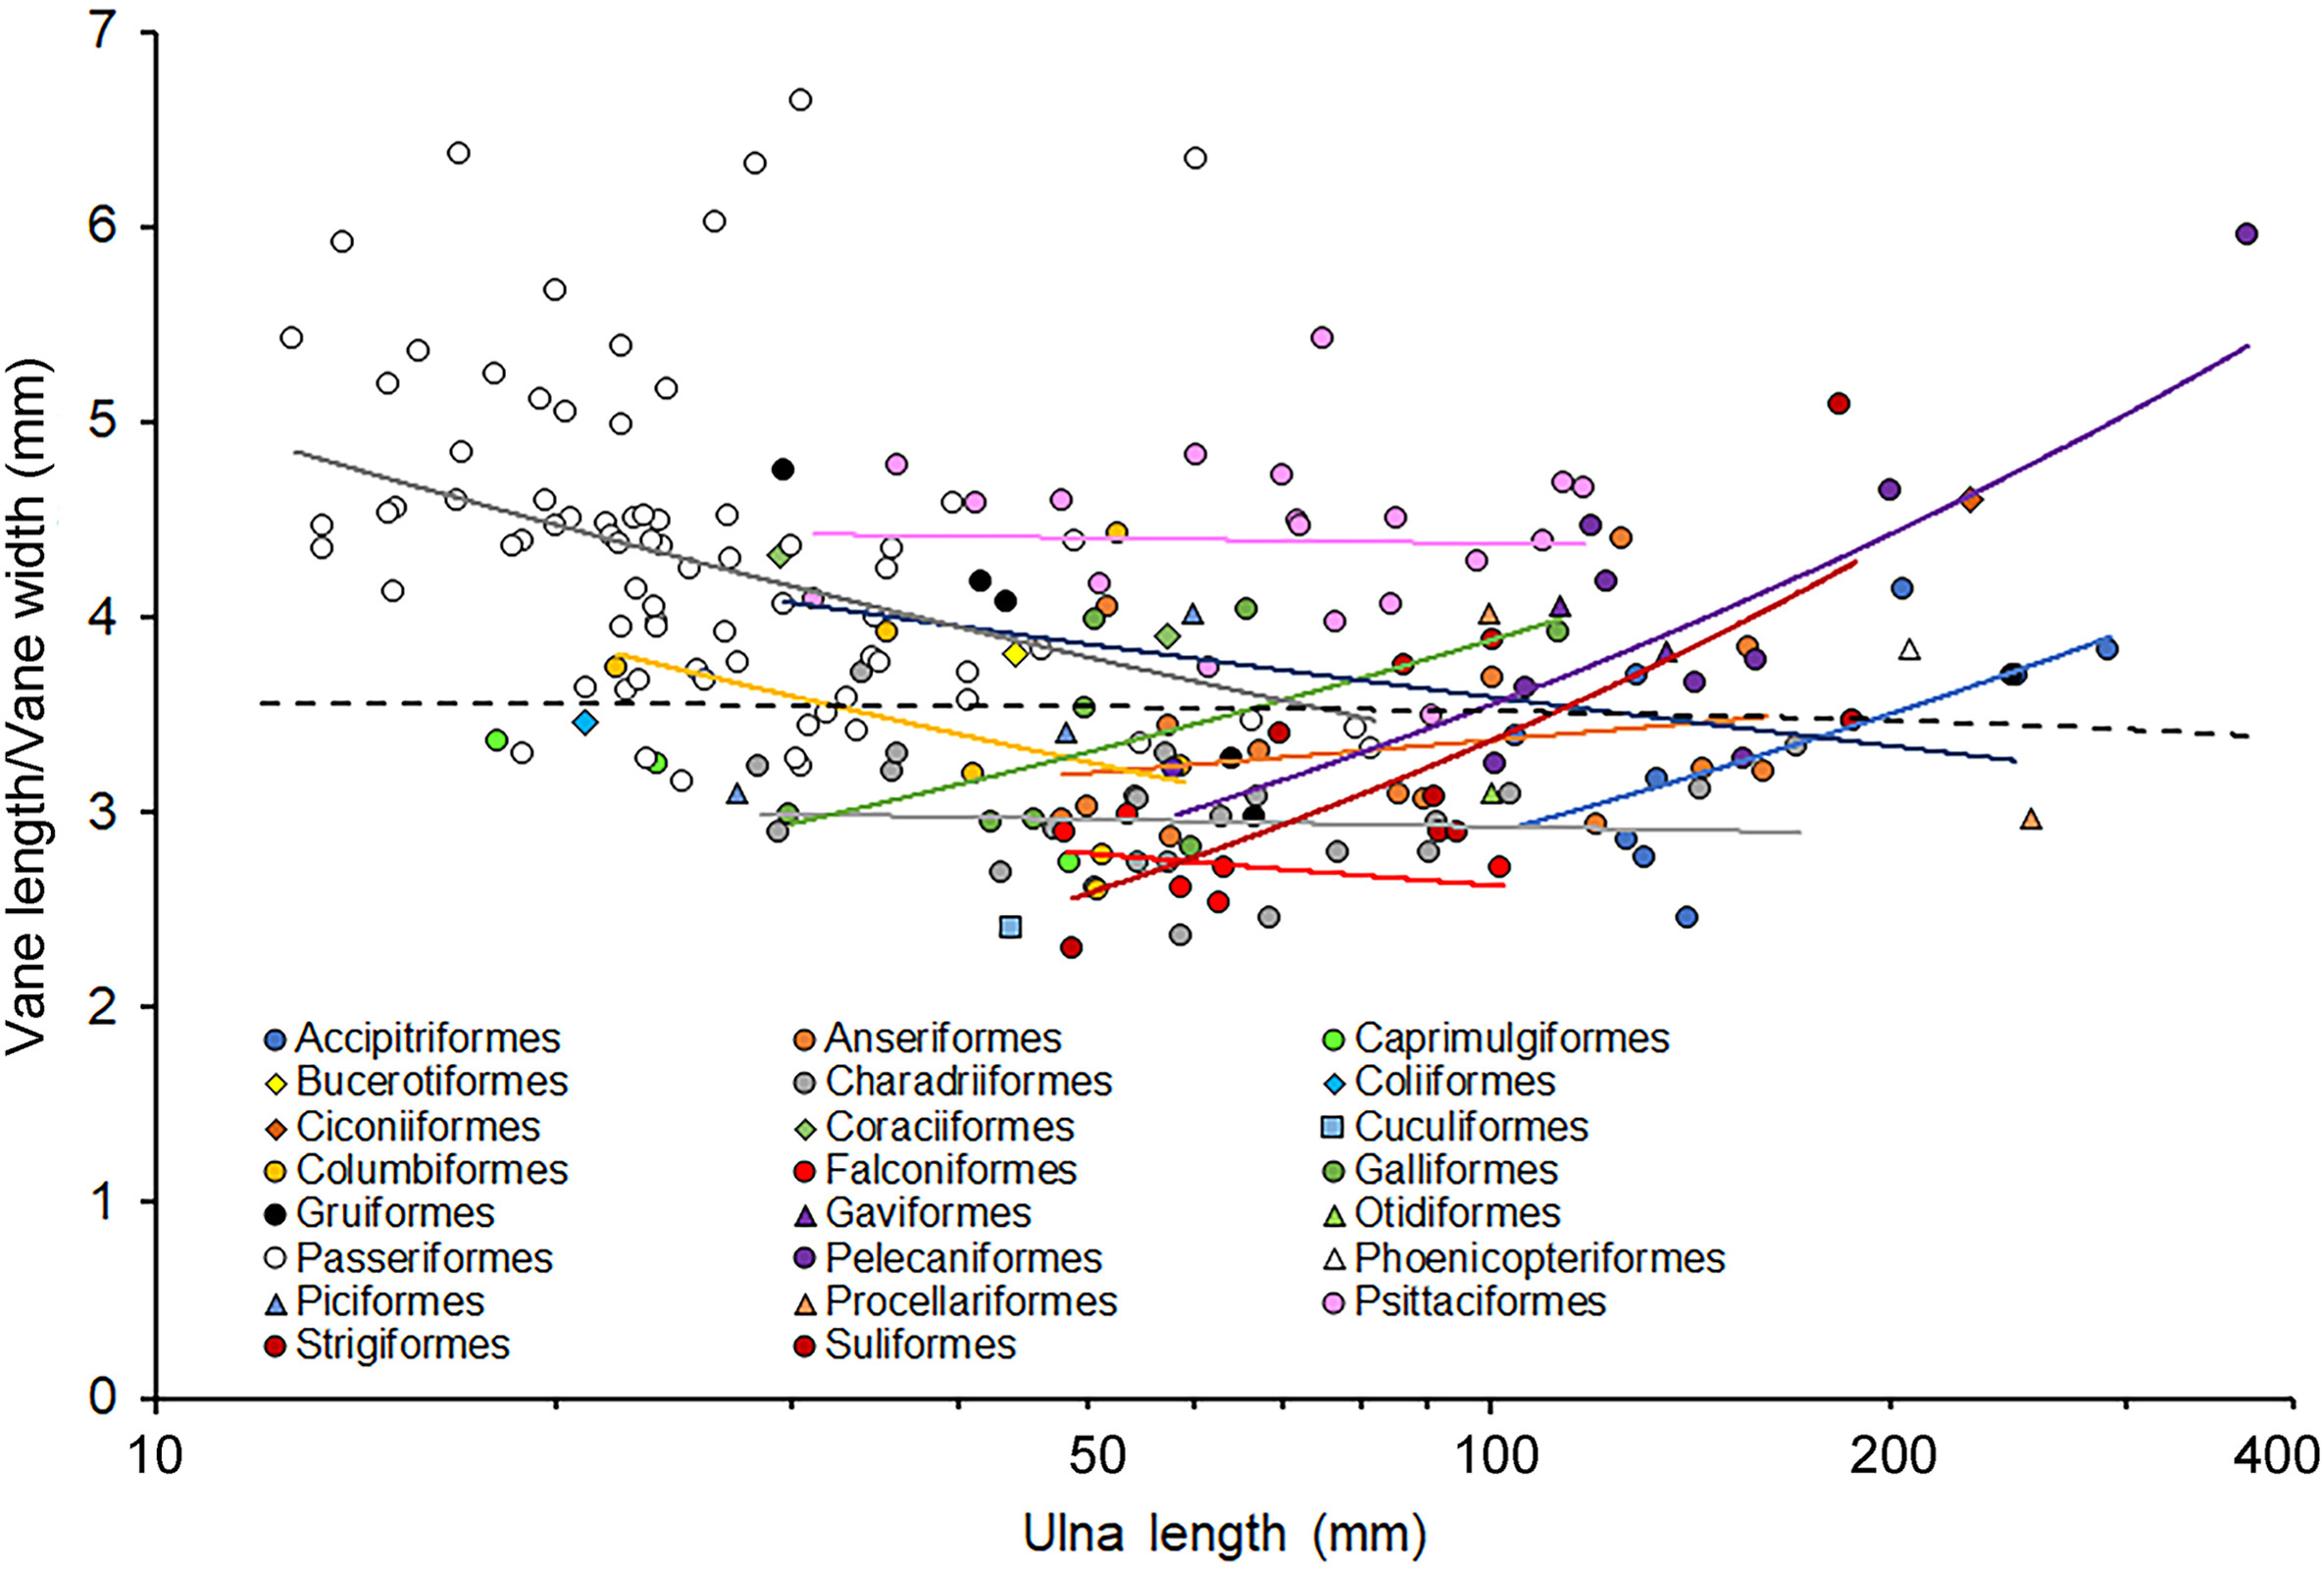
The ratio of vane length to width varied from values around 2.5 to between 6 and 7 with the highest values being observed for species of passerine with short ulnae and Pelecaniformes and Strigiformes with long ulnae (Fig. 5). Overall, there was no significant relationship between the ratio and ulna length (F1,184 = 0.26, P = 0.613) but within orders there seemed to be relationships that were either positive or negative (Fig. 5). Analysis of the relationship for orders represented by five or more species revealed a significant interaction between ratio and log ulna length (F10,164 = 4.25, P < 0.0001) and both long ulna and order were also significant (F1,164 = 42.69, P < 0.0001 and F10,164 = 11.69, P < 0.0001, respectively). For individual orders, most relationships were not significant and only the Passeriformes exhibited a significant negative relationship, whereas the Pelecaniformes and Strigiformes exhibited significant positive relationships (Fig. 5; Table 5).
Figure
5.
Relationships between the ratio of vane length divided by vane width for the fifth secondary feather and ulna length for 209 species representing 24 orders. Dashed line is the phylogenetically controlled regression relationship for all species and coloured lines are relationships for orders represented in the dataset by more than five species (see Table 5 for more details).
Table
5.
Results of phylogenetically controlled generalised linear modelling of the relationships between the log value for ulna length and the ratio of feather vane length to width of the fifth secondary feather vane for individual orders that were represented by at least five species.
Order
Slope (SE)
t-value (P-value)
Intercept (SE)
t-value (P-value)
R2
λ
Columbiformes
−1.366 (1.891)
−0.72 (0.502)
5.639 (3.096)
1.82 (0.128)
0.095
<0.001
Passeriformes
−1.670 (0.516)
−3.27 (0.002)
6.729 (0.732)
9.195 (<0.001)
0.126
<0.001
Gruiformes
−0.977 (0.873)
−1.12 (0.326)
5.574 (1.587)
3.51 (0.025)
0.238
<0.001
Falconiformes
−0.278 (0.740)
−0.38 (0.725)
3.254 (1.334)
2.44 (0.0.71)
0.034
<0.001
Psittaciformes
−0.240 (0.579)
−0.41 (0.683)
4.747 (1.368)
3.47 (0.003)
0.010
<0.001
Charadriiformes
−0.142 (0.335)
−0.42 (0.676)
3.224 (0.598)
5.39 (<0.001)
0.009
<0.001
Anseriformes
0.582 (0.671)
0.87 (0.403)
2.233 (1.304)
1.71 (0.112)
0.059
<0.001
Galliformes
1.827 (1.044)
1.75 (0.131)
0.239 (1.811)
0.13 (0.899)
0.338
<0.001
Accipitriformes
2.172 (1.131)
1.92 (0.096)
−1.448 (2.494)
−0.58 (0.580)
0.345
<0.001
Pelecaniformes
3.244 (0.856)
3.79 (0.005)
−2.937 (1.839)
−1.60 (0.0.149)
0.642
<0.001
Strigiformes
4.471 (1.127)
3.97 (0.007)
−5.332 (2.210)
−2.41 (0.052)
0.724
<0.001
Results are ordered in in relation to size for the slope of the regression estimates.
The results supported the hypothesis that S5 vane width is a function of ulna size, and the number of secondary feathers as associated with different orders. As predicted, those orders that are invariant in the number of secondaries exhibited an isometric increase in vane width but orders that show a positive relationship between secondary number and ulna length exhibited negative allometry. Contrary to prediction, vane length did not scale isometrically with ulna length. There were effects of order on the relationship between vane length and width and, feather shape (i.e., vane length divided by vane width) varied with the length of the ulna but only for some orders.
This study only considered one of the secondary feathers, but data for vane width of all secondary feathers from 19 species of parrots were highly significant correlated (see Introduction), suggesting that the patterns detected here for the S5 of the 200 bird species will be independent of the secondary feather used. Relationships between body size and vane characteristics are only previously available for parrots; both length and width of S5 (and the 8th primary) exhibited positive allometry with body mass (Deeming et al., 2024b). The relationship between S5 and ulna length was not reported by Deeming et al. (2024b), but here it was found to be isometric as predicted. Further research is needed to confirm that observations of one feather reflect the pattern exhibited by all secondary feathers, and to explore whether these relationships are applicable in other orders of birds.
Adjacent secondary feathers overlap when they form a flight surface (Able, 2004; Ritchison, 2023) and so only studying S5 perhaps limits our understanding of the extent to which the degree of overlapping varies among species, and whether this is important in determining flight style or efficiency. In species where secondary number increases with ulna size it is possible that the relatively narrow secondaries still overlap in the same proportion as the wider secondaries of birds that exhibit isometric scaling in vane width. This would be an interesting area for further research. It is also unclear what role vane asymmetry (Kiat and O’Connor, 2024) plays in the degree of overlap between adjacent feathers. It would be interesting to explore vane widths in all secondary feathers on a wing in a variety of species to determine whether the proportion of overlap between adjacent feathers is comparable between these two groups. Such results would inform our understanding as whether wing widths of different sizes and aspect ratios exhibit similar functional characteristics.
For instance, variation among orders for the allometric relationships between vane length and ulna size almost certainly reflect differences in wing chord length and wing shape in different orders (Able, 2004; Ritchison, 2023). Although there are qualitative descriptions of wing shapes, e.g., high speed, elliptical or high aspect ratio, are recognised (Able, 2004), quantitative descriptions of wing shape have yet to be provided for a range of bird species. It is possible that a simple classification of wing shape may be masking functional characteristics of wings among species; for instance, it is unlikely that all songbird species have elliptical wing shapes. Different orders seem to have evolved secondary feathers of varying shapes associated with changes in vane length, or width or both parameters. It is unclear why Falconiformes exhibited such a different pattern to the other orders although it may reflect a relatively small sample size or was associated with the high-speed wing shape exhibited by these birds (Able, 2004). Ultimately, the shape of a bird wing is a function of its constituent feathers and how these interact surely plays a role in their function, but we have not yet fully explored these possibilities.
The results presented here suggest that birds have solved the problem of using the secondary feathers to provide an aerodynamic surface in the proximal part of the wing in two ways. Many non-passerines orders (excepting parrots) generally show negative allometry for vane width versus ulna length because they have more, albeit relatively narrow and short, secondary feathers. By contrast, passerines, parrots, and other orders where secondary number does not vary greatly with the size of the ulna produce an aerodynamic surface by having vane widths that scale isometrically, but the remiges are relatively long. This will affect the shape of the aerofoil produced by the secondary feathers but whether this affects its mechanical properties is unclear (see below). Likewise, it is not clear whether it is vane length or width that is most important in determining feather shape, but it does appear to depend on the order of bird involved. In primary feathers, smaller birds have feathers that are less flexible than larger birds, but this reflects the stiffness of the rachis rather than that of the vane (Wang et al., 2012). Indeed, most studies of feather strength focus on the rachis (Purslow and Vincent, 1978; Worcester, 1996; Corning and Biewner, 1998; Bachmann et al., 2012; Wang et al., 2012; Lees et al., 2017; Schelestow et al., 2017; Li et al., 2022; Deeming et al., 2024b) but it is the strength of the vanes, and the degree to which they overlap, that combine to offer resistance to vertical airflow during a down stroke of the wing.
The little research into feather characteristics has focused on functional morphology of barbs (see Feo et al., 2015; Pap et al., 2015, 2019). Butler and Johnson (2004) showed that melanised barbs of the vane were stronger than unmelanised barbs, and barb breaking stress, breaking strain and toughness decreased, and breaking stiffness increased, distally along the rachis. Otherwise, Sullivan et al. (2016) investigated at the mechanical properties of the individual barbs from only one species (a galliform) and concluded that the structure of the vane, with its barbs, barbules and interlocking hooks, determines the flexing behaviour of the feather vane. It is unclear whether the mechanical characteristics of feathers from different species will vary depending on the vane width and/or how the vanes interact among adjacent remiges. For instance, for any given ulna length the S5 vane width for passerines was greater than for parrots but less than for pigeons (Columbiformes). It is not known whether these size differences affect the mechanical properties of the wing, vane or barbs (see Pap et al., 2015, 2019). Whilst it is known that remiges overlap during flight to produce a surface that resists air flow during a downstroke or form a continuous aerodynamic surface when the wing is open (Ritchison, 2023), the extent to which feathers overlap in different species determines the biomechanics of the wing has not been explored. Further investigation of these relationships will help in developing our understanding of how feathers interact during flight.
The results of this study provide insight into how different species are producing a functional aerofoil, but the results also highlight the gaps in our knowledge of how feathers and wings function during flight. Although technically challenging (Sullivan et al., 2016), there is considerable scope for further comparative research that compares the mechanical characteristics of the vanes of secondary (and primary) feathers in a wider range of species than previously investigated. The results of such studies would inform our understanding of how an aerodynamic flight surface is maintained, how a wing functions during flight, and whether these characteristics vary among species.
CRediT authorship contribution statement
D.C. Deeming: Writing – original draft, Supervision, Project administration, Methodology, Investigation, Formal analysis, Data curation, Conceptualization. E.P. Bayliss: Investigation, Data curation. E. Ketley: Methodology, Investigation.
Declaration of competing interest
The authors declare that they have no known competing financial interests or personal relationships that could have appeared to influence the work reported in this paper.
Able, K.P., 2004. Birds on the move: flight and migration. In: Podulka, S., Rohrbaugh, R. W., Bonney, Jr R. (Eds.), Handbook of Bird Biology, second ed. Princeton University Press, Princeton, pp. 5.1–5.100.
Bachmann, T., Emmerlich, J., Baumgartner, W., Schneider, J.M., Wagner, H., 2012. Flexural stiffness of feather shafts: geometry rules over material properties. J. Exp. Biol. 215, 405-415.
Bailey, N.T.J., 1981. Statistical Methods in Biology, second ed. Hodder and Stoughton, London.
Butler, M., Johnson, A.S., 2004. Are melanised feather barbs stronger? J. Exp. Biol. 207, 285-293.
Corning, W.R., Biewener, A.A., 1998. In vivo strains in pigeon flight feather shafts: implications for structural design. J. Exp. Biol. 201, 3057-3065.
Deeming, D.C., Durkin, M., Nudds, R.L., 2024a. Maintaining the avian wing aerofoil: relationships between the number of primary and secondary flight feathers and under-lying skeletal size in birds. J. Zool. 322, 272-280.
Deeming, D.C., Hutchings, C.J., Seaward, F.G., Goodman, A.M., 2024b. Strength of parrot flight feathers is a function of position on the wing. Curr. Zool, zoae041.
Deeming, D.C., Harrison, S.L., Sutton, G.P., 2022. Interrelationships between body mass, jaw musculature and bite force in birds. J. Zool. 317, 129-137.
del Hoyo, J., 2020. All the Birds of the World. Lynx, Barcelona.
Feo, T.J., Field, D.J., Prum, R.O., 2015. Barb geometry of asymmetrical feathers reveals a transitional morphology in the evolution of avian flight. Proc. R. Soc. B 282, 20142864.
Fraigneau, C., 2017. Feathers: an Identification Guide to the Feathers of Western European Birds. Bloomsbury Helm, London.
Freckleton, R.P., Harvey, P.H., Pagel, M., 2002. Phylogenetic analysis and comparative data: a test and review of evidence. Am. Nat. 160, 712-726.
Genz, A., Bretz, F., Miwa, T., Mi, X., Leisch, F., Scheipl, F., et al., 2021. mvtnorm: multivariate normal and t distributions. R package version 1, 1-3.
Jetz, W., Thomas, G.H., Joy, J.B., Hartmann, K., Redding, D., Mooers, A.O., 2014. Distribution and conservation of global evolutionary distinctness in birds. Curr. Biol. 24, 919-930.
Kiat, Y., O’Connor, J.K., 2024. Functional constraints on the number and shape of flight feathers. Proc. Nat. Acad. Sci. USA 121, e2306639121.
Lees, J., Garner, T., Cooper, G., Nudds, R., 2017. Rachis morphology cannot accurately predict the mechanical performance of primary feathers in extant (and therefore fossil) feathered flyers. R. Soc. Open Sci. 4, 160927.
Li, Q., Shen, H., Han, Q., Ji, A., Dai, Z., Gorb, S., 2022. Effects of morphological integrity of secondary feather on their drag reduction in pigeons. J. Bionic Eng. 19, 1422-1438.
Nudds, R.L., 2007. Wing-bone length allometry in birds. J. Avian Biol. 3, 515-519.
Pap, P.L., Osváth, G., Sándor, K., Vincze, O., Bǎrbos, L., Marton, A., et al., 2015. Interspecific variation in the structural properties of flight feathers in birds indicates adaptation to flight requirements and habitat. Funct. Ecol. 29, 746-757.
Pap, P.L., Vincze, O., Vágási, C.I., Salamon, Z., Pándi, A., Bálint, B., et al., 2019. Vane macrostructure of primary feathers and its adaptations to flight in birds. Biol. J. Linn. Soc. 126, 256-267.
Paradis, E., Schliep, K., 2019. Ape 5.0: an environment for modern phylogenetics and evolutionary analyses in R. Bioinformatics 35, 526-528. .
Purslow, P.P., Vincent, J.F.V., 1978. Mechanical properties of primary feathers from the pigeon. J. Exp. Biol. 72, 251-260.
R Development Core Team, 2024. R: A language and environment for statistical computing. R Foundation for Statistical Computing, Vienna, Austria.
Ritchison, G., 2023. In a Class of Their Own: A Detailed Examination of Avian Forms and Functions. Springer, Cham.
Schlusen, J., Schwenk, K., Knes, B.. no date.
Schneider, C.A., Rasband, W.S., Eliceiri, K.W., 2012. NIH Image to ImageJ: 25 years of image analysis. Nat. Methods 9, 671-675.
Schelestow, K., Troncoso, O.P., Torres, F.G., 2017. Failure of flight feathers under uniaxial compression. Mater. Sci. Eng. C 78, 923-931.
Sullivan, T.N., Pissarenko, A., Herrera, S.A., Kisailus, D., Lubarda, V.A., Meyers, M.A., 2016. A lightweight, biological structure with tailored stiffness: the feather vane. Acta Biomater. 41, 27-39.
Venables, W.N., Ripley, B.D., 2002. Modern Applied Statistics with S, fourth ed. Springer, New York.
Wang, X., Nudds, R.L., Palmer, C., Dyke, G.J., 2012. Size scaling and stiffness of avian primary feathers: implications for the flight of Mesozoic birds. J. Evol. Biol. 25, 547-555.
Worcester, S.E., 1996. The scaling of the size and stiffness of primary flight feathers. J. Zool. 239, 609-624.
Table
1.
Results of phylogenetically controlled generalised linear modelling of the relationships between log ulna length and log values for vane width and length. Data were available for 209 species from 24 orders.
Table
2.
Results of phylogenetically controlled generalised linear modelling of the log:log relationships between width of the fifth secondary feather vane and the length of the ulna for individual orders that were represented by at least five species.
Order
Slope (SE)
t-value (P-value)
Intercept (SE)
t-value (P-value)
R2
λ
Comparison with isometric slope of 1.0
Falconiformes
0.225 (0.191)
1.179 (0.304)
1.032 (0.344)
2.99 (0.040)
0.258
<0.001
t4 = −4.06 (0.015)*
Pelecaniformes
0.373 (0.126)
2.95 (0.018)
0.767 (0.274)
2.83 (0.022)
0.522
<0.001
t8 = −5.00 (0.001)*
Strigiformes
0.418 (0.299)
1.40 (0.211)
0.674 (0.586)
1.15 (0.294)
0.246
<0.001
t6 = −1.95 (0.100)
Accipitriformes
0.483 (0.150)
3.22 (0.015)
0.687 (0.331)
2.07 (0.077)
0.597
<0.001
t7 = −3.45 (0.011)*
Galliformes
0.687 (0.211)
3.25 (0.017)
0.227 (0.367)
0.62 (0.558)
0.638
<0.001
t6 = −1.48 (0.189)
Charadriiformes
0.778 (0.075)
10.32 (<0.001)
−0.121 (0.135)
−0.90 (0.378)
0.835
<0.001
t21 = −2.96 (0.008)*
Anseriformes
0.799 (0.088)
9.07 (<0.001)
−0.115 (0.171)
−0.67 (0.513)
0.873
<0.001
t7 = −2.28 (0.041)*
Gruiformes
0.824 (0.167)
5.05 (0.007)
−0.134 (0.303)
−0.44 (0.682)
0.864
<0.001
t4 = −0.95 (0.398)
Columbiformes
0.941 (0.099)
9.52 (<0.001)
−0.152 (0.162)
−0.94 (0.390)
0.948
<0.001
t5 = −0.60 (0.577)
Passeriformes
1.016 (0.045)
22.81 (<0.0001)
−0.345 (0.063)
−5.47 (<0.001)
0.875
<0.001
t74 = 0.04 (0.397)
Psittaciformes
1.022 (0.065)
15.84 (<0.0001)
−0.453 (0.186)
−2.44 (0.026)
0.937
0.949
t17 = 0.34 (0.370)
Results are ordered in in relation to size for the slope of the regression estimates. The final column indicates the results of a one-way t-test (Bailey, 1981) to compare the slope against an isometric slope of 1.0. *Significant departure from isometry.
Table
3.
Results of phylogenetically controlled generalised linear modelling of the log:log relationships between the length of the fifth secondary feather vane and the length of the ulna for individual orders that were represented by at least five species.
Order
Slope (SE)
t-value (P-value)
Intercept (SE)
t-value (P-value)
R2
λ
Comparison with isometric slope of 1.0
Falconiformes
0.184 (0.176)
1.04 (0.356)
1.545 (0.317)
4.87 (0.008)
0.214
<0.001
t4 = −4.64 (0.010)*
Pelecaniformes
0.692 (0.089)
7.74 (<0.001)
0.679 (0.192)
3.53 (0.008)
0.882
<0.001
t8 = −3.46 (0.009)*
Gruiformes
0.737 (0.106)
6.92 (0.002)
0.631 (0.193)
3.26 (0.031)
0.923
<0.001
t4 = −2.48 (0.068)
Columbiformes
0.748 (0.254)
2.94 (0.032)
0.689 (0.416)
1.65 (0.159)
0.634
<0.001
t5 = −0.99 (0.367)
Charadriiformes
0.760 (0.078)
9.68 (<0.001)
0.381 (0.140)
2.73 (0.013)
0.817
<0.001
t21 = −3.08 (0.006)*
Accipitriformes
0.763 (0.051)
15.09 (<0.001)
0.588 (0.112)
5.27 (0.001)
0.970
0.983
t17 = 0.34 (0.370)
Passeriformes
0.837 (0.036)
23.05 (<0.0001)
0.538 (0.051)
10.44 (<0.001)
0.878
<0.001
t74 = −4.53 (<0.001)*
Anseriformes
0.873 (0.097)
9.00 (<0.001)
0.265 (0.188)
1.41 (0.185)
0.871
<0.001
t12 = −1.31 (0.215)
Galliformes
0.917 (0.263)
3.47 (0.013)
0.357 (0.457)
0.78 (0.465)
0.668
<0.001
t6 = −0.31 (0.763)
Strigiformes
0.961 (0.177)
5.43 (0.002)
0.133 (0.347)
0.38 (0.715)
0.838
<0.001
t6 = 0.21 (0.837)
Psittaciformes
1.074 (0.060)
17.87 (<0.0001)
0.081 (0.111)
0.73 (0.477)
0.949
<0.001
t17 = 1.23 (0.182)
Results are ordered in in relation to size for the slope of the regression estimates. The final column indicates the results of a one-way t-test (Bailey, 1981) to compare the slope against an isometric slope of 1.0. *Significant departure from isometry.
Table
4.
Results of phylogenetically controlled generalised linear modelling of the log:log relationships between the length and width of the fifth secondary feather vane for individual orders that were represented by at least five species.
Order
Slope (SE)
t-value (P-value)
Intercept (SE)
t-value (P-value)
R2
λ
Comparison with isometric slope of 1.0
Pelecaniformes
0.595 (0.131)
4.54 (0.002)
0.280 (0.284)
0.99 (0.353)
0.721
<0.001
t8 = −3.09 (0.015)*
Accipitriformes
0.620 (0.196)
3.17 (0.016)
0.345 (0.444)
0.78 (0.463)
0.589
<0.001
t17 = −1.94 (0.0.094)
Strigiformes
0.633 (0.199)
3.18 (0.019)
0.217 (0.402)
0.54 (0.610)
0.627
<0.001
t6 = −1.84 (0.115)
Galliformes
0.731 (0.096)
7.61 (<0.001)
−0.004 (0.187)
−0.02 (0.985)
0.906
<0.001
t6 = −2.80 (0.031)*
Columbiformes
0.848 (0.260)
3.26 (0.023)
−0.236 (0.498)
−0.47 (0.656)
0.680
<0.001
t5 = −0.58 (0.584)
Anseriformes
0.869 (0.083)
10.51 (<0.001)
−0.267 (0.162)
−1.64 (0.126)
0.902
<0.001
t12 = −1.58 (0.140)
Falconiformes
0.944 (0.298)
3.17 (0.034)
−0.333 (0.559)
−0.60 (0.583)
0.715
<0.001
t4 = −1.89 (0.860)
Charadriiformes
0.976 (0.059)
16.62 (<0.001)
−0.429 (0.102)
−4.21 (<0.001)
0.929
<0.001
t21 = −0.41 (0.688)
Psittaciformes
1.001 (0.009)
18.30 (<0.0001)
−0.653 (0.143)
−4.57 (<0.001)
0.952
<0.001
t17 = 1.11 (0.209)
Passeriformes
1.109 (0.058)
19.25 (<0.0001)
−0.819 (0.099)
−8.25 (<0.001)
0.834
<0.001
t74 = 1.88 (0.069)
Gruiformes
1.151 (0.130)
8.87 (0.001)
−0.873 (0.255)
−3.42 (0.027)
0.952
<0.001
t4 = 1.16 (0.181)
Results are ordered in in relation to size for the slope of the regression estimates. The final column indicates the results of a one-way t-test (Bailey, 1981) to compare the slope against an isometric slope of 1.0. *Significant departure from isometry.
Table
5.
Results of phylogenetically controlled generalised linear modelling of the relationships between the log value for ulna length and the ratio of feather vane length to width of the fifth secondary feather vane for individual orders that were represented by at least five species.
Order
Slope (SE)
t-value (P-value)
Intercept (SE)
t-value (P-value)
R2
λ
Columbiformes
−1.366 (1.891)
−0.72 (0.502)
5.639 (3.096)
1.82 (0.128)
0.095
<0.001
Passeriformes
−1.670 (0.516)
−3.27 (0.002)
6.729 (0.732)
9.195 (<0.001)
0.126
<0.001
Gruiformes
−0.977 (0.873)
−1.12 (0.326)
5.574 (1.587)
3.51 (0.025)
0.238
<0.001
Falconiformes
−0.278 (0.740)
−0.38 (0.725)
3.254 (1.334)
2.44 (0.0.71)
0.034
<0.001
Psittaciformes
−0.240 (0.579)
−0.41 (0.683)
4.747 (1.368)
3.47 (0.003)
0.010
<0.001
Charadriiformes
−0.142 (0.335)
−0.42 (0.676)
3.224 (0.598)
5.39 (<0.001)
0.009
<0.001
Anseriformes
0.582 (0.671)
0.87 (0.403)
2.233 (1.304)
1.71 (0.112)
0.059
<0.001
Galliformes
1.827 (1.044)
1.75 (0.131)
0.239 (1.811)
0.13 (0.899)
0.338
<0.001
Accipitriformes
2.172 (1.131)
1.92 (0.096)
−1.448 (2.494)
−0.58 (0.580)
0.345
<0.001
Pelecaniformes
3.244 (0.856)
3.79 (0.005)
−2.937 (1.839)
−1.60 (0.0.149)
0.642
<0.001
Strigiformes
4.471 (1.127)
3.97 (0.007)
−5.332 (2.210)
−2.41 (0.052)
0.724
<0.001
Results are ordered in in relation to size for the slope of the regression estimates.

 DownLoad:


 Email Alerts
 RSS Feeds