Figure
1.
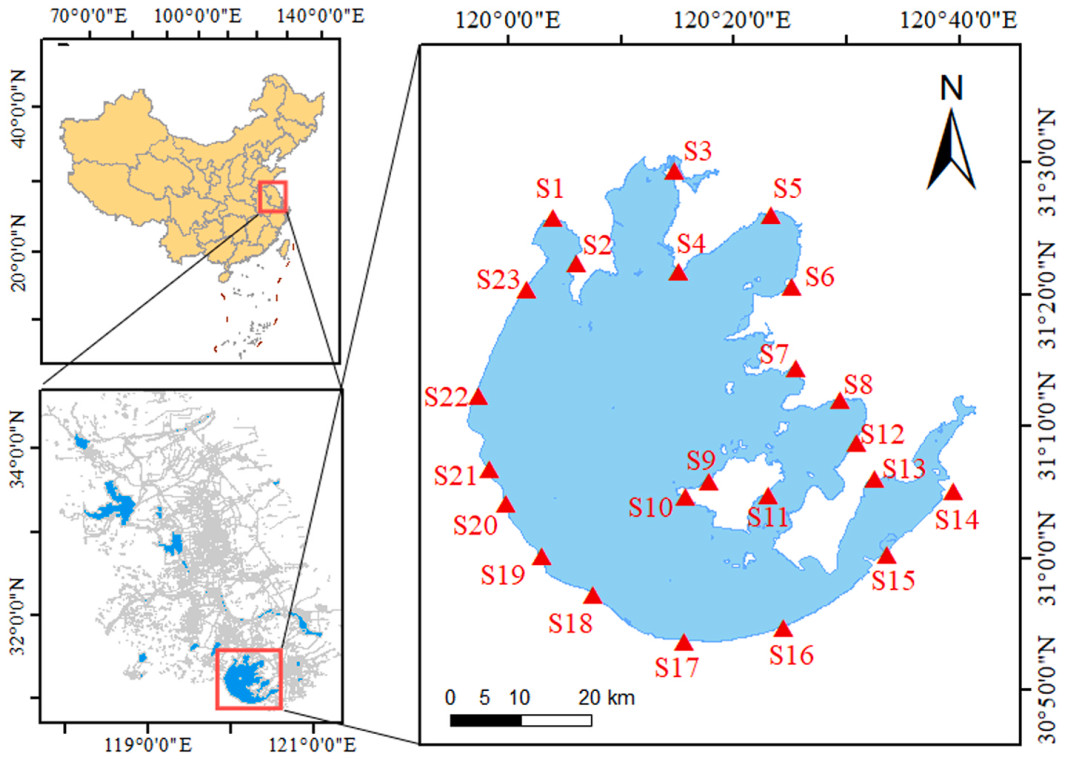
Geographic location and division of Tai Lake and the sampling sites.
| Citation: |
Hongming Shuai, Xiaoru Liu, Yigui Zhang, Yuqi Sun, Hao Li, Zhongqiu Li. 2025: eDNA enhances detection efficiency but reveals lower waterbird diversity: A comparison with point counting method. Avian Research, 16(1): 100236. DOI: 10.1016/j.avrs.2025.100236

|
Environmental DNA (eDNA) methods have emerged as a promising tool for studying a broad spectrum of biological taxa. However, metabarcoding studies of avian biodiversity using eDNA have received little attention. In this study, we compared waterbird biodiversity derived from eDNA metabarcoding with that obtained from traditional point counting surveys at 23 sites in Tai Lake of eastern China and evaluated the accuracy of eDNA metabarcoding for waterbird community studies. The point counting method recorded a higher total number of waterbird species (22) compared to the eDNA technique (16). While eDNA achieved a 74.5% detection rate for waterbird species and was able to identify a significantly greater number of species (12.48 ± 1.97) at each sampling site than point counting method (6.13 ± 2.69), particularly highlighting several rare and elusive species, it failed to detect some species commonly observed by the point counting method. The alpha diversity analysis revealed no significant differences in waterbird diversity between the eDNA method and the point counting method, except that the eDNA method exhibited lower Pielou evenness. Waterbird eDNA sequencing abundance correlated significantly with species occurrence, whereas Spearman's analysis indicated no significant difference between eDNA sequence abundance and species abundance from the point counting method. eDNA method detected no significant difference in waterbird composition between sampling sites, while the point counting method revealed significant differences. Consequently, eDNA is an effective complementary tool for assessing the diversity of wintering waterbirds in lakes, though it is unable to capture the full diversity of waterbird communities. It is crucial to develop sampling strategies that comprehensively monitor species composition and integrate eDNA with traditional survey methods for accurate evaluation of community structure.
Birds are widely distributed, well-studied, and sensitive to environmental changes, making them important indicator taxa for assessing environmental health and ecosystem integrity (Gregory et al., 2008; Gregory and van Strien, 2010). Birds also play key roles in ecosystems, including pollination, pest control, and seed dispersal (Whelan et al., 2008). However, birds and their ecological functions face increasing threats due to habitat loss, climate change, overexploitation, and other factors (Rosenberg et al., 2019; Lees et al., 2022). Consequently, monitoring bird diversity is essential for evaluating the status of bird populations and habitat quality, and mitigating the impacts of anthropogenic activities on avian species (Chace and Walsh, 2006). Traditional methods such as point counting, line transect census, and automated sound recording, are widely employed for bird surveys (Cai et al., 2010; Fischer et al., 2023). Nevertheless, these approaches often encounter challenges, including a high workload and difficulties in identifying cryptic and nocturnal species (Wix and Reich, 2019). Additionally, these methods can be subjective and require expertise from taxonomists with extensive survey experience and specialized knowledge for accurate species identification (Thomas, 1996). Therefore, there is a pressing need to develop an efficient alternative method to overcome the limitations of visual and auditory censuses, thereby enhance their effectiveness in monitoring bird diversity.
Environmental DNA (eDNA) technology involves extracting DNA from environmental samples for both quantitative and qualitative analysis using high-throughput sequencing (Deiner et al., 2017). Owing to its non-invasive, efficient, sensitive, and standardized nature, eDNA is recognized as a powerful tool for species monitoring (Beng and Corlett, 2020; Holm et al., 2023). eDNA has been extensively applied to study species distribution, diversity, and community composition in fish and amphibians (Bálint et al., 2018; Stoeckle et al., 2021; Dunn et al., 2023; Zhang et al., 2024a). Recent advances have expanded its use to terrestrial vertebrates, including reptiles, mammals, and birds (Mariani et al., 2021; Feng and Lougheed, 2023). For instance, many studies have extracted eDNA from diverse environments, including water (Sohn and Song, 2024), feces (van der Heyde et al., 2021), air (Polling et al., 2024), flowers (Newton et al., 2023), and spider webs (Newton et al., 2024), to investigate terrestrial vertebrate biodiversity, demonstrating its versatility across ecosystems.
Waterbirds rely on aquatic habitats for food, roost and breeding site (Blake-Bradshaw et al., 2020). Their frequent interactions with water result in the shedding of genetic material (e.g., feathers and dropping) into waterbody. Waterbird DNA can be efficiently detected from water samples (Zhang et al., 2023), thereby offering greater potential for application and research value in waterbird diversity studies. Researchers have successfully detected bird DNA in water samples using modified universal primers, suggesting that bird eDNA metabarcoding could serve as a complementary tool for bird detection and identification (Ushio et al., 2018). However, the application of eDNA technology for bird monitoring is still in its early stages compared to its use in other taxa. Fewer studies have specifically focused on birds, primarily examining the distribution and population status of rare or endangered species such as Gouldian Finch (Chloebia gouldiae) (Day et al., 2019), Black Rail (Laterallus jamaicensis) (Feist et al., 2022), Ridgway's Rail (Rallus obsoletus) (Guan et al., 2023), and Kakapo (Strigops habroptila) (Urban et al., 2023). Some researchers have developed specific primers and PCR systems for a limited number of waterfowl species, yet the application of species-specific primers across a broader range of species remains limited (Schuetz et al., 2020; Honka et al., 2024). As an emerging technology, comparative studies between eDNA and traditional survey methods are essential to ascertain its reliability and advantages (Fujii et al., 2019; Poyntz-Wright et al., 2024). Nevertheless, only few studies have preliminarily explored the effectiveness of eDNA in comparison to traditional methods, such as line transect surveys and infrared camera monitoring, for assessing bird diversity in agricultural and woodland habitats (Katayama et al., 2024; Tetzlaff et al., 2024), highlighting a need for analysis across a broader range of ecosystems.
This study aimed to assess the effectiveness of using eDNA to monitor the diversity of wintering waterbirds in lake habitats. Eastern China's Tai Lake is an important habitat for winter migratory birds and has long been a focal point for ornithological research. A total of 146 waterbird species across 9 orders and 20 families have been documented, including 34 species classified as nationally protected under Class Ⅰ and Ⅱ (Zhou et al., 2023). Due to great effort on wetland conservation and ecological restoration, avian diversity in the Tai Lake region has significantly increased (Zhu et al., 2017), making it an ideal pilot site for evaluating the effectiveness of eDNA technology in monitoring waterbird communities. We compared the species composition, distribution patterns, and community structures revealed by traditional point counting method and eDNA metabarcoding. Moreover, we analyzed the correlation between bird abundance data and occurrence rates derived from both methods. We anticipate that this study will enhance our understanding of the potential of eDNA technology in monitoring bird biodiversity, and contribute to the development of wildlife conservation strategies.
Tai Lake, one of China's five renowned freshwater lakes located in the middle and lower reaches of the Yangtze River (30°55ʹ40ʺ–31°32ʹ58ʺ N, 119°52ʹ32ʺ–120°36ʹ10ʺ E), covers an area of 2364 km2 and has a total water storage capacity of 4.43 × 10⁸ m3, characterizing it as a typical shallow lake. The lakebed of Tai Lake is notably flat, with an average elevation of 1.1 m. The climate of the Tai Lake area is characterized by a subtropical monsoon climate, with distinct seasonal variations influenced by its location in the transition zone between northern and central subtropical regions. This leads to an average annual temperature range of 14.9–16.2 ℃, a frost-free period lasting between 220 and 246 days, and annual precipitation ranging from 1000 to 1400 mm.
A total of 23 sample sites (Fig. 1) were set by the lake according to the topographic features of Tai Lake (Zhang et al., 2022). These sites represented typical habitats for wintering waterbirds, including open water zones and mudflats, where Common Reed (Phragmites australis) was the most prevalent vegetation. The survey was conducted during the bird wintering season (8–15 January 2024). Each survey was conducted between 7:30 a.m. and 17:30 p.m. and was carried out in weather conditions with clear visibility. At each site, observers scanned the lake within approximately 1 km of the sample site using binoculars (FORESTER, 8 × 42) and telescope (Kowa, 25–60 ×) (Shao et al., 2015). Observers identified and counted the birds using a combination of precise counting and estimation, and recorded species, numbers and distance to the observer. Each site was observed for 20–30 min, contingent on bird abundance.
Two pre-trained surveyors conducted water sampling at the same sampling sites, concurrent with point counting. Surveyors collected water samples at the lake shore, where water levels typically ranged from 0.5 to 1 m. Water samples were collected using an integrated eDNA enrichment kit (Easy Filter Kit 2.0). Prior to collection, latex tubes were attached to the filter instrument and rinsed with lake water for 1 min in order to prevent exogenous DNA contamination. At each site, triplicate 5 L water samples were collected approximately 30 cm below the surface and stored in sterile collection bags. After collection, the integrated filter was mounted onto the environmental DNA filter, and the latex tube was connected the filter's inlet to the water collection bag to initiate filtration. Following filtration, 2.5 mL of eDNA Later was added to the integrated filter using a syringe provided in the kit. The filter's caps were secured tightly, and the filter was inverted five times to ensure thorough mixing. Throughout the collection and filtration processes, researchers adhered to strict safety protocols, including wearing masks and sterile gloves to minimize contamination risks.
DNA extraction was processed using the Environmental DNA Extraction Kit and the magnetic bead method within 12 h after the samples arrived at the lab in order to ensure the freshness and integrity of the samples. Subsequent to extraction, DNA concentration was measured using a Qubit 4.0 fluorometer, and DNA quality was assessed using a Nanodrop spectrophotometer. For avian DNA, selected 12S primer was utilized (Zhang et al., 2024b): the reaction mixture comprised 30 μL, including 15 μL of 2 × Taq PlusMaster Mix Ⅱ (Novizen), 1.5 μL each of forward and reverse primers, 1 μL of DNA template, and 11 μL of nuclease-free water, yielding an amplified fragment of 170 bp in length. The PCR protocol involved an initial denaturation at 95 ℃ for 3 min, followed by 35 cycles of 95 ℃ for 15 s, 62.4 ℃ for 20 s, and 72 ℃ for 20 s.
Linker Primer Sequence: TCGTGCCAGCCACCGCGGTTA.
Reverse Primer Sequence: ATAGTGGGGGTATCTAATCCCAG.
After electrophoresis, ImageLab was employed to assess the success of the run, ensuring that the PCR products displayed clear, distinct bands and that the negative control was devoid of bands. Ultimately, PCR products were purified via magnetic bead technology, and their concentration was measured using a Qubit fluorometer, achieving a desired concentration of over 3 ng/μL. The PCR results were sent to Nanjing E-genomics Technology Co.Ltd. (Nanjing E-genomics – Environmental DNA Products and Services) for library building and sequencing.
High-throughput sequencing data were analyzed using the Ecoview 3.0 analysis system (Nanjing Ekinuo Environmental Protection Technology Co., Ltd.), which primarily involved sequencing data quality control, OTU clustering and sequence annotation. Sequences with low quality and trim sequences that are too short or too long were screened and removed. Short sequence tags were verified to attribute each sequence to its sample based on tag type, and we removed mismatched primers and tags from the amplicons. Sequences were sorted by length, duplicates, singletons and PCR chimeras were eliminated. Amplified sequences were clustered into OTUs using vsearch-cluster_size. We used the NCBI database (https://www.ncbi.nlm.nih.gov/) for sequence comparison and species identification. BLAST was employed to classify and assign OTUs based on the following criteria: (1) If a query sequence matches a single species with the top score and the similarity exceeds 97%, it is annotated to that species; (2) If a query sequence matches a single species with the top score but the similarity is below 97%, it is annotated to the genus; (3) If a query sequence matches multiple species with the top scores, it is annotated to the genus based on the species' known distribution and lowest taxonomic rank. Finally, the sequencing data were correlated with OTUs and compiled into an OTUs table.
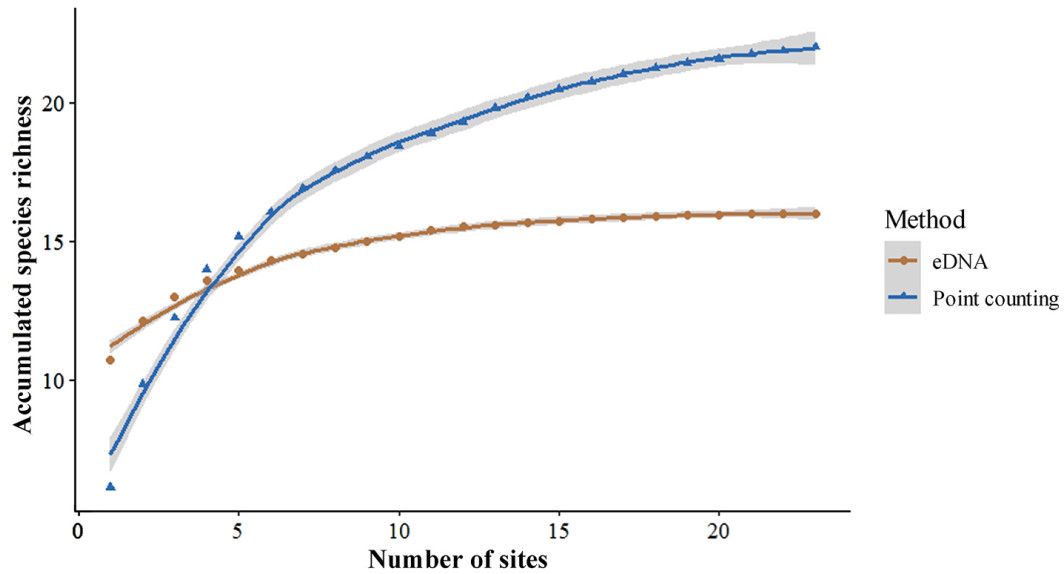
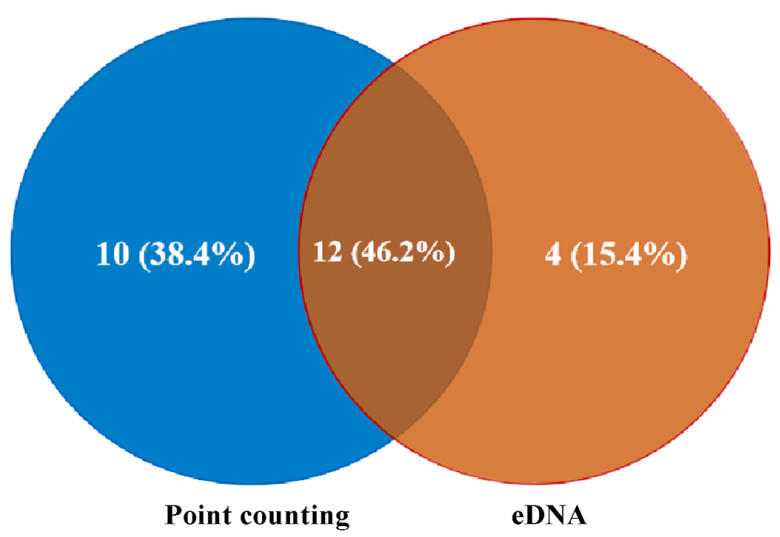
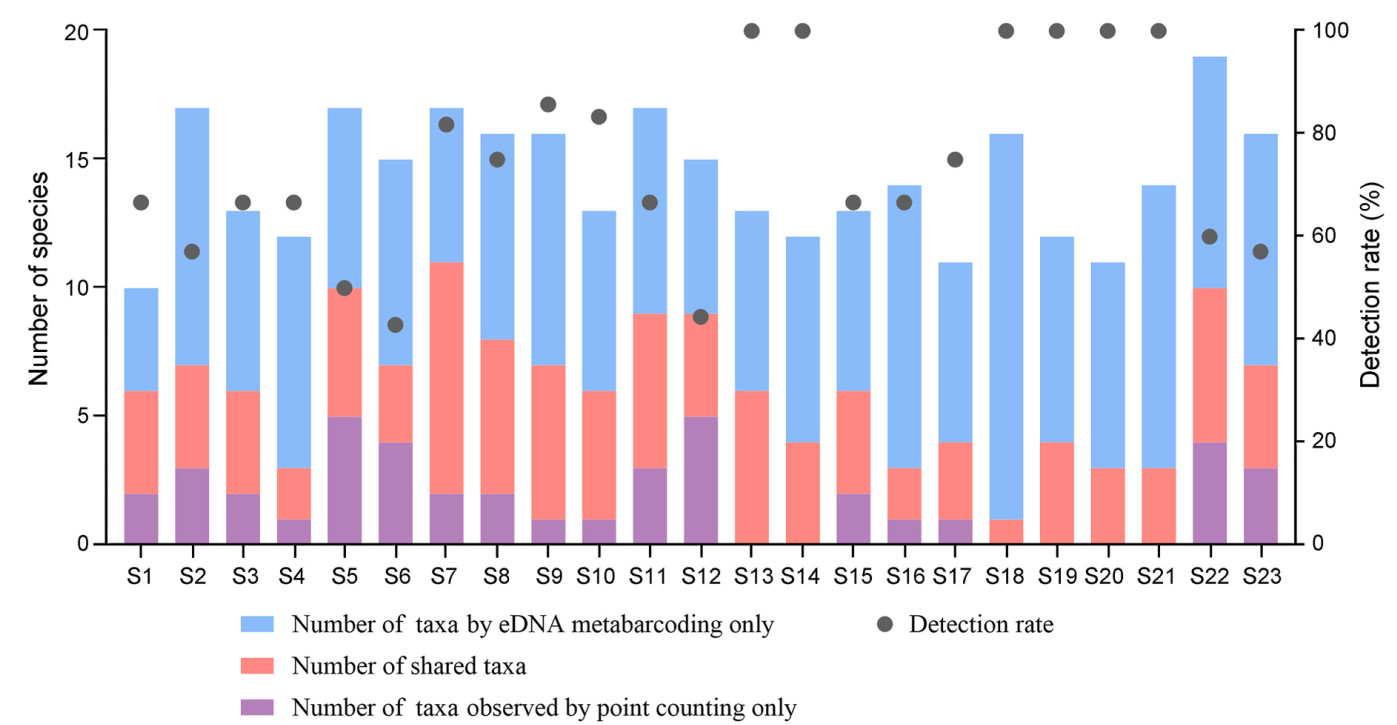
Follow-up analyses were conducted using R v.4.4.0 and GraphPad Prism 10 species accumulation curves were generated to assess how the number of sample points affected the diversity analysis of waterbirds for both methods. Venn diagrams were created to illustrate the differences in species detection between the two methods. To assess the overlap in species lists between waterbirds observed by the traditional point counting and eDNA metabarcoding, we calculated the detection rate of eDNA metabarcoding using the formula: (number of species detected by both point counting and eDNA methods)/(total number of species observed through point counting) × 100%. We also plotted species composition at each sample site to highlight the differences in the relative abundance revealed by point counting and eDNA reads. Spearman's correlation was applied illustrate the association between the relative abundance and species occurrence. Box-and-whisker plots were generated to analyze α-diversity between the two methods. Mantel test was used to assess the spatial correlation of waterbird communities between Bray-Curtis distance and geographic distance across sampling sites.
In this study, analysis of the species accumulation curves from the 23 sample sites (Fig. 2) indicated that the species count of point counting method reached a plateau when the sample size increased to 20 sites, with no new species detected. Similarly, the eDNA method exhibited a saturation trend at 10 sampling sites, suggesting that a smaller sample size was adequate for assessing species diversity using both methods. This result suggests that the eDNA method achieves species detection saturation with fewer sampling sites compared to point count method, although its total species richness remains lower.
A total of 26 waterbird species, across 6 orders and 8 families, were detected using the point counting and eDNA metabarcoding methods (Table 1). Moreover, eDNA metabarcoding detected a conservation-value bird, Common Crane (Grus grus), a Class Ⅱ protected species on China's List of Wildlife under State Key Conservation. Five landbird species: Spotted Dove (Spilopelia chinensis), Rock Dove (Columba livia), Japanese Quail (Coturnix japonica), Chinese Grosbeak (Eophona migratoria), and Black-faced Bunting (Emberiza spodocephala) are additionally detected by eDNA, likely due to their transient interactions with the lake. The eDNA technique detected 16 waterbird species across 6 orders (Anseriformes, Podicipediformes, Suliformes, Charadriiformes, Gruiformes, Pelecaniformes) and 9 families, while the point counting method observed 22 species across 6 orders and 7 families (Fig. 3). The results indicated that eDNA detected 12.48 ± 1.97 waterbird species per sample site, at an average rate of 74.5%, whereas traditional point counting method observed 6.13 ± 2.69 species per site, showing a significant difference between the methods (t44 = −9.13, P = 1.01 × 10⁻¹¹) (Fig. 4).
| Order | Family | Species | eDNA | Point counting |
| Anseriformes | Anatidae | Mallard (Anas platyrhynchos) | √ | √ |
| Eurasian Wigeon (Anas penelope) | √ | √ | ||
| Eastern Spot-billed Duck (Anas zonorhyncha) | √ | |||
| Common Pochard (Aythya ferina) | √ | |||
| Baer's Pochard (Aythya baeri) | √ | |||
| Eurasian Teal (Anas crecca) | √ | |||
| Falcated Duck (Mareca falcata) | √ | |||
| Tufted Duck (Aythya fuligula) | √ | |||
| Gadwall (Mareca strepera) | √ | |||
| Podicipediformes | Podicipedidae | Little Grebe (Tachybaptus ruficollis) | √ | √ |
| Great Crested Grebe (Podiceps cristatus) | √ | √ | ||
| Suliformes | Phalacrocoracidae | Great Cormorant (Phalacrocorax carbo) | √ | √ |
| Charadriiformes | Laridae | European Herring Gull (Larus argentatus) | √ | √ |
| Black-headed Gull (Chroicocephalus ridibundus) | √ | √ | ||
| Scolopacidae | Common Greenshank (Tringa nebularia) | √ | √ | |
| Common Snipe (Gallinago gallinago) | √ | |||
| Gruiformes | Rallidae | Eurasian Coot (Fulica atra) | √ | √ |
| Common Moorhen (Gallinula chloropus) | √ | √ | ||
| Brown-cheeked Rail (Rallus indicus) | √ | |||
| Crans | Common Crane (Grus grus) | √ | ||
| Pelecaniformes | Ardeidae | Little Egret (Egretta garzetta) | √ | √ |
| Great Egret (Ardea alba) | √ | |||
| Black-crowned Night Heron (Nycticorax nycticorax) | √ | √ | ||
| Chinese Pond Heron (Ardeola bacchus) | √ | |||
| Eurasian Bittern (Botaurus stellaris) | √ | |||
| Grey Heron (Ardea cinerea) | √ | |||
| Columbiformes | Columbidae | Spotted Dove (Streptopelia chinensis) | √ | |
| Rock Dove (Columba livia) | √ | |||
| Galliformes | Phasianidae | Japanese Quail (Coturnix japonica) | √ | |
| Passeriformes | Fringillidae | Chinese Grosbeak (Eophona migratoria) | √ | |
| Black-faced Bunting (Emberiza spodocephala) | √ |
 DownLoad:
CSV
DownLoad:
CSV
As shown in Appendix Fig. S1 and S2, our analysis of the relative abundance of waterbirds at different sampling sites revealed that Black-headed Gull (Chroicocephalus ridibundus) and Eurasian Coot (Fulica atra) were the most prevalent species according to point count method, whereas Common Moorhen (Gallinula chloropus) and Eurasian Coot were the most prevalent according to eDNA analysis. Additionally, Spearman's analysis indicated no significant correlation between the relative abundances of waterbird species observed by point counting and those detected by eDNA (r = 0.308, df = 44, P = 0.331). Species occurrence rate is defined as the ratio of sample points where species were observed to the total number of sample points. Significant correlation was observed between relative abundance and species occurrence rate for both eDNA (r = 0.919, P < 0.001) and the traditional point counting method (r = 0.769, P < 0.001).
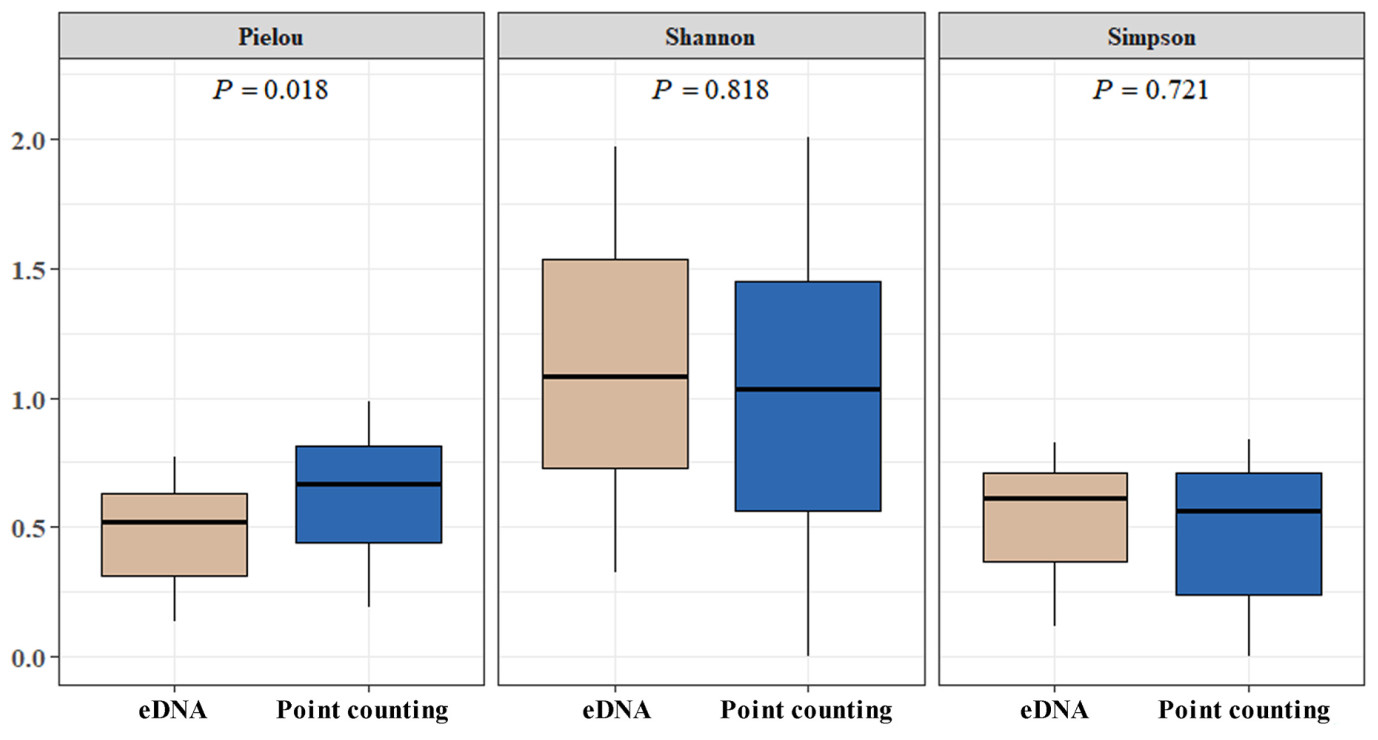
As depicted in Fig. 5, α-diversity analysis was conducted, calculating the Shannon-Wiener index, Simpson index, and Pielou evenness for both eDNA and point count method. The Shannon-Wiener (t44 = 0.232, P = 0.818) and Simpson (t44 = 0.721, P = 0.362) indices suggested no significant difference in species diversity between two methods. In contrast, the Pielou index (t44 = −2.58, P = 0.018) was higher for the point count method, indicating a more uniform distribution of waterbird species at each sampling site compared to eDNA.
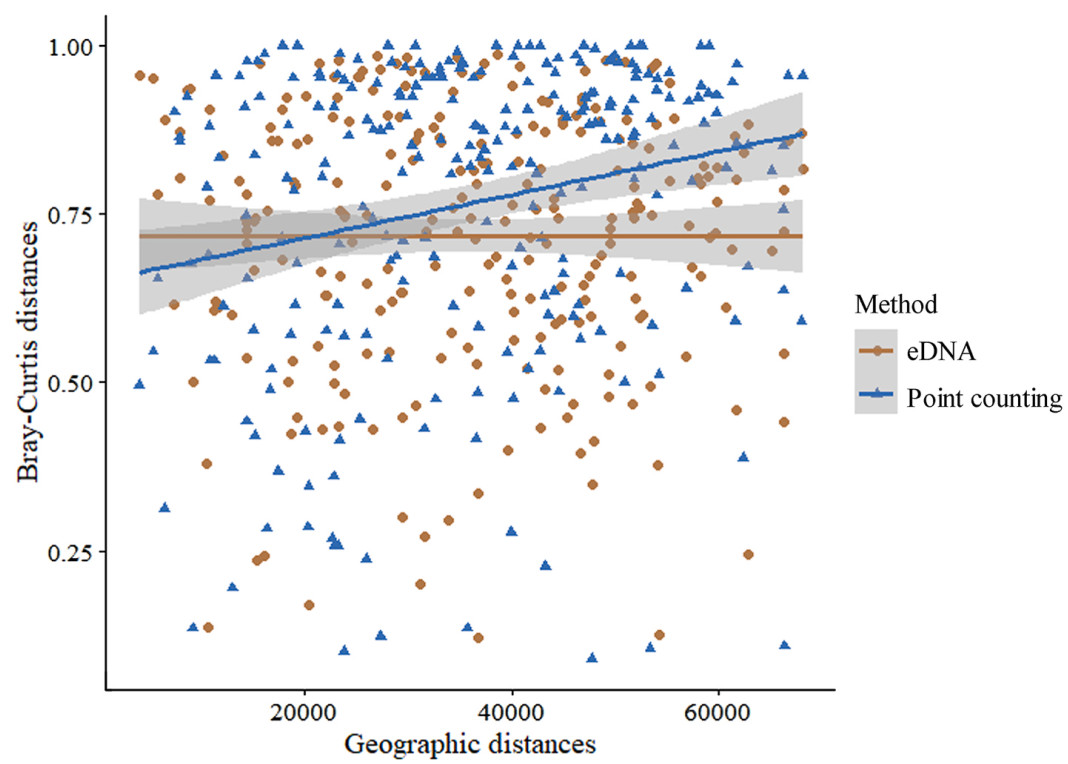
Mantel test revealed no significant difference in the community composition of waterbirds detected by eDNA across 23 sampling sites (r = −0.017, P = 0.773), in contrast to the traditional point counting method, which showed significant variation (r = 0.058, P = 0.016) (Fig. 6).
The results of this study demonstrated a high detection rate of 74.5% for eDNA in water samples when identifying waterbird species, confirming eDNA's potential as a non-invasive tool for detecting migratory birds reliant on aquatic environments (Lozano Mojica and Caballero, 2021). The faster saturation of eDNA curves suggests efficiency in localized sampling but the lower species richness highlights potential limitations, which may result from false positives (Furlan et al., 2020). Therefore, eDNA data must be carefully validated to minimize false positives and ensure unambiguous detections in biodiversity study. The eDNA method is unlikely to increase the field time and labor cost, because it allows a single researcher to independently conduct all sampling, with an average sampling time per site of no more than 20 min. However, it requires a significant investment in laboratory analysis, so the cost-effectiveness should be evaluated based on the scale and objectives of the study.
In assessing waterbird species diversity, this study revealed that eDNA demonstrated a higher per-site species detection rate compared to traditional point count method, aligning with findings on benthic invertebrates and aquatic plants (Ji et al., 2021, 2022). The results substantiate the advantages of eDNA in bird diversity studies across large lakes, enabling researchers to gather data on a broader spectrum of species, particularly those that may be missed by visual surveys or not readily observable at a specific time. In lake ecosystem, eDNA can persist for hours to days (Dejean et al., 2011), enabling the detection of species outside traditional survey period or temporarily absent from the sampling site during point counting. For cryptic species, the enhanced sensitivity of eDNA technology facilitates the detection of trace DNA in the bodies of water, effectively complementing point counting observations (Neice and McRae, 2021). For instance, Eurasian Bittern (Botaurus stellaris), which is known to inhabit dense reed beds (Gilbert et al., 2005), was detected solely through eDNA analysis. Additionally, eDNA detected Common Crane at specific sampling sites, highlighting its potential in monitoring and conserving rare wading birds. Subsequent studies can elucidate the historical presence and activity patterns of these species using eDNA, providing a scientific foundation for habitat evaluation and population conservation strategies.
However, the species richness of waterbirds detected by eDNA in this study was slightly lower than that identified by the point counting method. This difference may be due to spatial and temporal variability in the sequencing of specific bird species in the eDNA (Ushio et al., 2018). The eDNA analyses were unable to efficiently identify certain diving duck species, including Common Pochard (Aythya ferina) and Eastern Spot-billed Duck (Anas zonorhyncha), which are frequently observed morphologically. This discrepancy could be attributed to the spatial mismatch between areas of high eDNA release and sampling sites. Specifically, the effectiveness of eDNA technology in capturing genetic information is highly dependent on the frequency and mode of species interaction with the environment, which is closely linked to the animal's behavior (Ushio et al., 2018). Considering waterbird species exhibit varying preferences for water depth in their habitats (Baschuk et al., 2012), the shoreline-limited water sampling in this study may have constrained the eDNA technique's ability to detect species active in deep-water habits. Furthermore, certain wading birds, such Chinese Pond Heron (Ardeola bacchus), were not detected by eDNA, potentially due to their low population density and brief activity periods within the sampling area, where eDNA deposition had not surpassed the detection threshold. In dynamic water bodies, particularly river-lake junctions in this study, eDNA is susceptible to dilution and degradation due to water flow and microbiological activity, reducing its detectability over time which adversely affects species detection (Deutschmann et al., 2019). Notably, this study also detected birds from non-aquatic environments, indicating a potential need to exclude non-target species from eDNA-based waterbird monitoring in habitat-specific studies. This discrepancy may arise because the eDNA method captures DNA from all species interacting with the waterbody, including terrestrial birds that may visit the lake for drinking or bathing, while the observers focused on waterbirds and overlooked landbirds.
We compared the α-diversity of waterbirds in Tai Lake, using both the eDNA method and the traditional point counting method, including the Shannon-Wiener and Simpson indexes, recognized as key indicators of species diversity (Li et al., 2021). In comparative studies on community monitoring, Chen et al. (2024) reported significantly lower diversity in eDNA fish communities compared to traditional methods, whereas Wang et al. (2023) observed the opposite. This disparity may arise from variations in eDNA distribution and accumulation across aquatic habitats, potentially affecting the accuracy and sensitivity of eDNA in assessing diversity index (Golpour et al., 2022). Our results indicated no significant difference in Shannon-Wiener and Simpson diversity indexes between the two methods, suggesting that eDNA could be a comparable tool for assessing waterbird diversity in specific environments like lake ecosystems. However, further research is needed to determine whether similar results can be achieved in other hydrological settings. Conversely, the eDNA method produced significantly lower Pielou evenness compared to the point counting method, attributable to the reliance on sequence abundance data for eDNA analysis (He et al., 2024). Sequence abundance, influenced by factors such as biomass, can lead to high sequence counts even for species with few individuals, thereby affecting the evenness index (Thomsen et al., 2016).
Quantitative assessment of bird communities is a pivotal research focus for effective and precise bird monitoring and management (Peterson and Niemi, 2007). The relationship between eDNA and biomass or abundance can be influenced by various factors, including ambient water temperature (Jo, 2023), species biology (Danziger et al., 2022), and sampling time (Morrison et al., 2023). Although there is evidence of a linear relationship between eDNA and fish abundance or biomass (Xin et al., 2022; Wei et al., 2023), the correlation between eDNA concentration or sequence counts and bird abundance or live biomass remains unclear. Our study indicates that individual eDNA sequencing abundance data do not accurately reflect waterbird species abundance, which aligns with Li et al.'s (2022) findings on freshwater fish in a small reservoir in Fujian Province, China. Consequently, high-throughput sequencing can only indicate differences in abundance between samples based on the relative number of amplified, and is currently unable to quantify the specific biomass of birds in the environment (Katayama et al., 2024). In addition, the correlation observed in this study between eDNA sequence abundance and the occurrence of waterbird species demonstrates that sequencing abundance can partially reflect the frequency of target species occurrence (Orzechowski et al., 2019). This suggests that eDNA sequence abundance could serve as a reference index for diversity assessment to some extent.
The spatial structure of waterbird communities reflects the complex interactions between species and their environments (Wei and Zhou, 2023). Our study revealed biases in assessing waterbird community composition using eDNA and point counting method, highlighting the need for further examination of eDNA's accuracy in analyzing lake waterbird community structures. The eDNA metabarcoding analysis revealed a surprising homogeneity in waterbird community composition across the lake. On the one hand, this homogeneity may be due to the fact that eDNA analysis relies solely on the relative abundance of amplified sequences for comparing sample abundances, obscuring differences in community structure when compared to the point counting method. On the other hand, large aquatic environments like lakes can mask differences in localized species distribution (Sayoud et al., 2017). As previously noted, eDNA can identify a broader range of species over time, thereby mitigating the impact of localized habitat heterogeneity to some extent. In contrast, traditional point counting method revealed greater heterogeneity in the waterbird community structure of Tai Lake. At smaller scales, localized habitat characteristics and resource distribution are pivotal in shaping waterbird communities (Dunning et al., 1992). The distribution of habitat mosaics (Rohwer et al., 2015), food resources (Lu et al., 2024a), abiotic factors like water depth and clarity, and temporal factors such as seasonal water level fluctuations (Wang et al., 2018) can influence species occurrence probabilities at observation sites, resulting in spatially heterogeneous waterbird distributions. In addition, interspecific competition and other species interactions can also shape the spatial structure of communities (Che et al., 2019). However, eDNA techniques may not fully capture these complex species interactions, underscoring the necessity of employing multiple methods to monitor waterbird community structure and dynamics.
eDNA technology is poised to become a valuable tool for bird diversity conservation and ecological research. In the Tai Lake waterbird biodiversity study, eDNA technology demonstrated a high detection rate and non-invasiveness, effectively complement traditional point counting methods. eDNA excels at detecting a wider range of species at single sampling site, particularly cryptic species. Nevertheless, the total species richness captured by eDNA may be influenced by sampling point placement and waterbody conditions, leading to its inability to capture certain common waterbirds. eDNA method does not significantly outperform traditional methods in assessing overall biodiversity since its ability to provide quantitative data on relative abundance and species composition differences between sampling sites remains limited. In conclusion, although eDNA cannot completely replace traditional waterbird monitoring methods due to sequencing randomness and environmental interference, it serves as a supplementary approach to enhance species composition data when budgets permit. Future studies should prioritize optimizing spatial and temporal sampling strategies to enhance the accuracy and effectiveness of eDNA in monitoring waterbird diversity. Establishing sampling points at varying offshore distances and increasing sampling frequency over different time intervals could help expand the temporal and spatial scales of waterbird composition. Moreover, standardizing and automating eDNA protocols will address technical challenges in complex aquatic environments (Lu et al., 2024b). Integrating these approaches with traditional surveys and investigating the impact of various sampling methods on monitoring outcomes will maximize the complementary role of eDNA in avian biodiversity conservation.
Hongming Shuai: Writing – review & editing, Writing – original draft, Visualization, Supervision, Software, Methodology, Investigation, Formal analysis, Data curation, Conceptualization. Xiaoru Liu: Writing – review & editing, Writing – original draft, Visualization, Methodology, Investigation, Formal analysis, Data curation, Conceptualization. Yigui Zhang: Visualization, Software, Formal analysis. Yuqi Sun: Writing – review & editing, Methodology, Investigation. Hao Li: Methodology, Investigation. Zhongqiu Li: Writing – review & editing, Supervision, Resources, Project administration, Funding acquisition, Conceptualization.
The authors declare that they have no known competing financial interests or personal relationships that could have appeared to influence the work reported in this paper.
Supplementary data to this article can be found online at https://doi.org/10.1016/j.avrs.2025.100236.
Figures(6) / Tables(1)


| Order | Family | Species | eDNA | Point counting |
| Anseriformes | Anatidae | Mallard (Anas platyrhynchos) | √ | √ |
| Eurasian Wigeon (Anas penelope) | √ | √ | ||
| Eastern Spot-billed Duck (Anas zonorhyncha) | √ | |||
| Common Pochard (Aythya ferina) | √ | |||
| Baer's Pochard (Aythya baeri) | √ | |||
| Eurasian Teal (Anas crecca) | √ | |||
| Falcated Duck (Mareca falcata) | √ | |||
| Tufted Duck (Aythya fuligula) | √ | |||
| Gadwall (Mareca strepera) | √ | |||
| Podicipediformes | Podicipedidae | Little Grebe (Tachybaptus ruficollis) | √ | √ |
| Great Crested Grebe (Podiceps cristatus) | √ | √ | ||
| Suliformes | Phalacrocoracidae | Great Cormorant (Phalacrocorax carbo) | √ | √ |
| Charadriiformes | Laridae | European Herring Gull (Larus argentatus) | √ | √ |
| Black-headed Gull (Chroicocephalus ridibundus) | √ | √ | ||
| Scolopacidae | Common Greenshank (Tringa nebularia) | √ | √ | |
| Common Snipe (Gallinago gallinago) | √ | |||
| Gruiformes | Rallidae | Eurasian Coot (Fulica atra) | √ | √ |
| Common Moorhen (Gallinula chloropus) | √ | √ | ||
| Brown-cheeked Rail (Rallus indicus) | √ | |||
| Crans | Common Crane (Grus grus) | √ | ||
| Pelecaniformes | Ardeidae | Little Egret (Egretta garzetta) | √ | √ |
| Great Egret (Ardea alba) | √ | |||
| Black-crowned Night Heron (Nycticorax nycticorax) | √ | √ | ||
| Chinese Pond Heron (Ardeola bacchus) | √ | |||
| Eurasian Bittern (Botaurus stellaris) | √ | |||
| Grey Heron (Ardea cinerea) | √ | |||
| Columbiformes | Columbidae | Spotted Dove (Streptopelia chinensis) | √ | |
| Rock Dove (Columba livia) | √ | |||
| Galliformes | Phasianidae | Japanese Quail (Coturnix japonica) | √ | |
| Passeriformes | Fringillidae | Chinese Grosbeak (Eophona migratoria) | √ | |
| Black-faced Bunting (Emberiza spodocephala) | √ |
DownLoad:
CSV
 Email Alerts
 RSS Feeds