The transformation of natural habitats into human-modified landscapes has far-reaching consequences for species distribution and abundance. As species adapt to these changing environments, shifts in distribution patterns, niche dynamics, and interspecies interactions may occur, impacting biodiversity at multiple levels and potentially leading to ecosystem imbalances. This study aims to assess the impact of variations in vegetation composition and human disturbance on the distribution of sympatric breeding birds and to determine the extent of niche overlap or differentiation among these species. We conducted field surveys and collected data on bird distribution, vegetation composition, and level of human disturbance in eastern Inner Mongolian grasslands. We focused on the six most frequently co-occurring breeding birds, representing a mix of sparrows, larks, and corvids. Generalized Additive Models revealed varying responses of species occurrence along habitat gradients. Species like the Eurasian Skylark (Alauda arvensis), Mongolian Lark (Melanocorypha mongolica), and Asian Short-toed Lark (Calandrella cheleensis), increased in larger and more connected habitats, while others, like the Tree Sparrow (Passer montanus), Eurasian Magpie (Pica pica), and Barn Swallow (Hirundo rustica), adapted to more fragmented habitats. Niche analysis indicated habitat generalists tended to occupy larger niches than grassland specialists. Substantial niche overlap was also found among the six co-occurring bird species. Conservation efforts should consider the specific needs of specialist species and strive to maintain or restore critical grassland habitats. Additionally, promoting sustainable agricultural practices that balance the needs of birds and human activities can contribute to the coexistence of generalist and specialist bird species in modified landscapes.
Global habitat changes have become a pressing concern in the context of biodiversity, significantly influencing ecosystems and the species that inhabit them (Pereira et al., 2010; Haddad et al., 2015). The transformation of natural habitats due to factors such as urbanization, deforestation, climate change, and land-use alterations has led to profound impacts on global biodiversity (Fahrig, 2017). Birds face a range of challenges when their habitats are disrupted or lost. These challenges, which include habitat fragmentation and shifts in resource availability, can impact their distribution, behavior, and overall survival (Gaston et al., 2003; Fraixedas et al., 2020). Not all birds respond equally to land-use changes: some may exhibit a capacity to thrive in altered environments, adjusting their occurrence patterns to capitalize on new resources created by human-induced changes, while others may face challenges or decline in abundance due to habitat loss or fragmentation (Newbold et al., 2014; Anjos et al., 2019). These diverse responses may lead to shifts in community composition and ecological dynamics. Overall, studying bird occurrence patterns along modified habitat gradients allows for identifying resilient species and those vulnerable to environmental changes, and further guiding effective conservation practices.
Species require specific resources and environmental conditions for their growth, survival, and reproduction, collectively known as their ecological niche (Hutchinson, 1957). The definition and explanation of a species' niche varies significantly across different ecological studies (Sales et al., 2021). Hutchinson (1957) introduced the groundbreaking concept of the n-dimensional hypervolume, allowing the niche to be conceptualized and, in theory, quantified. In Hutchinson's model, limiting factors for species growth—whether environmental conditions like temperature or resources such as prey—form the dimensions of a "hypervolume" that represents the species' fundamental niche (Blonder et al., 2014). This fundamental niche refers to the conditions under which a species could survive and reproduce in the absence of biotic interactions, such as competition or facilitation (Carscadden et al., 2020). The Volterra–Gause competitive exclusion principle is incorporated in Hutchinson's model, which posits that where the fundamental niches of two species overlap, only the more competitive species will persist. Hutchinson also introduced several key parameters of ecological niches, including niche position, breadth, and overall shape. Niche breadth refers to the extent of the ecological space occupied by a species' niche within the ecological hypervolume (Sexton et al., 2017). Ecological specialization, including the comparison of specialists and generalists, can be visualized as variation in the extent of the niche along different axes, or the volume of the n-dimensional niche. Species with narrow niche breadths are expected to be more vulnerable to extinction, particularly due to anthropogenic factors such as climate change and land-use alterations (Clavel et al., 2011; Rolland and Salamin, 2016).
Another important aspect of ecological niches is niche overlap. Morphologically and phylogenetically similar sympatric species often experience niche overlap, leading to competitive interactions, especially for scarce resources (Schoener, 1974a). Breeding birds, often share resources and congregate in specific areas and times. This behavior can lead to competition unless resources are sufficiently abundant. Niche segregation theory suggests that when resources are constrained, competing species may partition those resources along different ecological axes to reduce overlap and enhance coexist (Finke and Snyder, 2008; Kent and Sherry, 2020; Seyer et al., 2020). Resource partitioning can occur in several forms: temporal partitioning (using resources at different times), spatial partitioning (occupying distinct habitats), and resource use partitioning (specializing in different subsets of a resource) (Schoener, 1974b). In addition to resource partitioning, abiotic or biotic factors unrelated to resources—such as fluctuating environmental conditions, disturbance, and predation—can also promote species coexistence by disproportionately affecting competitively dominant species (Leibold, 1991; Gabaldón et al., 2015). Specialist species often exhibit lower levels of niche overlap with other specialists due to their specific ecological requirements. Generalist species, however, may show higher levels of overlap with both specialists and other generalists, as they can exploit a broader array of habitats and resources (Büchi and Vuilleumier, 2014). The analysis on niche breadth and habitat overlap in bird communities thus provides insight into the mechanisms of species coexistence, predicts community dynamics, and helps explain species adaptation to environmental conditions (Smith et al., 2019).
Grassland birds exhibit a spectrum of ecological strategies, with some species acting as habitat specialists and others as generalists (Staude et al., 2021). Many grassland birds breed synchronously and exhibit similar traits (such as similar reproductive strategies or foraging behaviors), which may lead to the species using the same resources or habitats at the same time (Barrero et al., 2023). Consequently, grassland birds serve as an effective model for studying coexistence and niche overlap in avian communities. Due to habitat loss and fragmentation, many grassland birds have declined worldwide in the past decades, and specialist species are currently declining at a higher rate than generalist species (Stanton et al., 2018; Correll et al., 2019; Rosenberg et al., 2019). This trend has drastic consequences concerning species diversity, as the replacement of specialist species by generalists leads to functional homogenization (Clavel et al., 2011). Despite the recognized importance of grassland birds in maintaining ecosystem health and biodiversity, there remains a considerable gap in our knowledge regarding how these species respond to varying degrees of habitat modification, and that knowledge has primarily been derived from studies conducted in Europe and North America, thereby limiting the generalizability of the findings to other regions (Boscolo and Metzger, 2009; Shahan et al., 2017; van Vliet et al., 2020; McDonald and Koper, 2022). The exploration of fine-scale habitat niche overlap in grassland birds is limited. In this study, we conducted field surveys and collected data on bird distribution, vegetation composition, and level of human disturbance in Inner Mongolian grasslands, which face a very recent and intensive conversion to agriculture in the region. Our primary objectives are to uncover the response of grassland bird species to varying degrees of habitat modification and investigate the extent of habitat niche overlap among co-occurring species. We hypothesized that specialists would exhibit narrower niche breadths compared to generalists, and sympatric species that are morphologically and phylogenetically similar are likely to show greater niche overlap.
2.
Methods
2.1
Study site and bird surveys
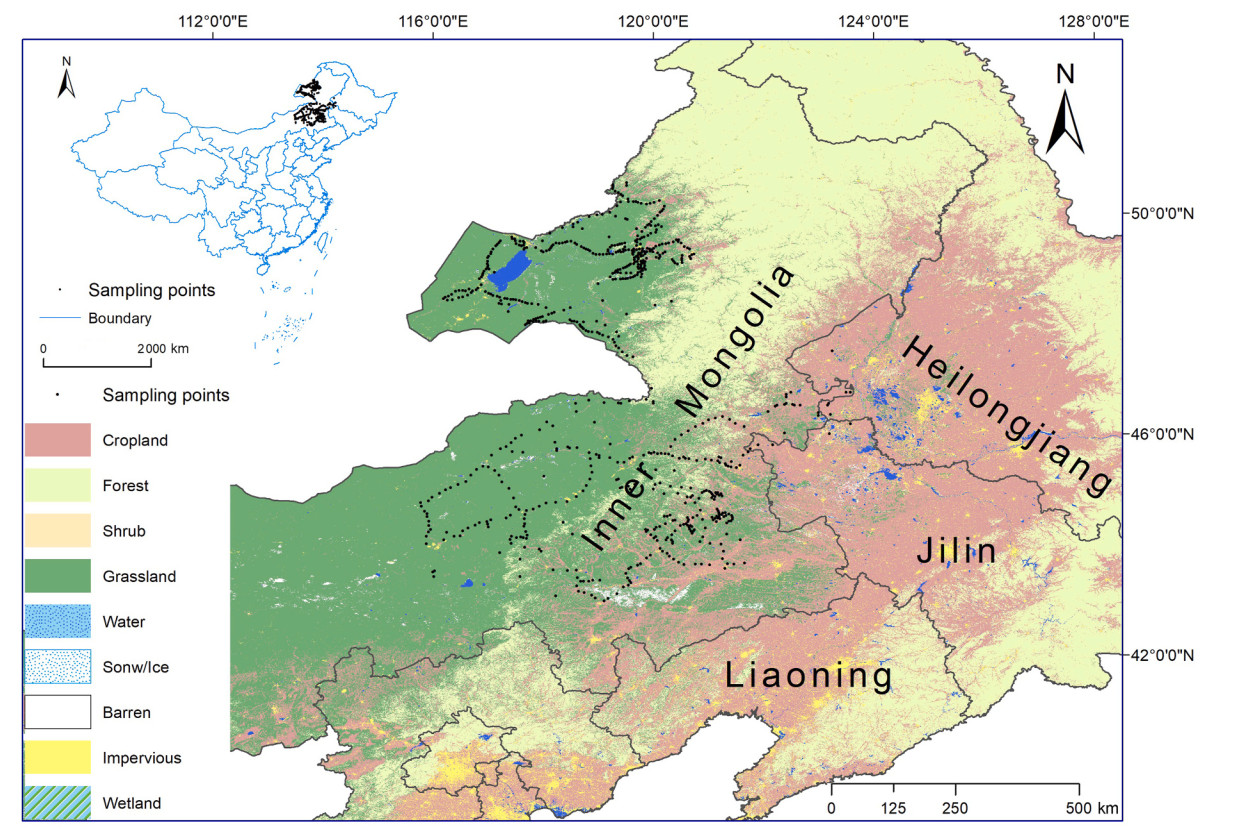
We conducted bird surveys using standardized point-count surveys from April to July (Bibby et al., 2000), along gradients of agricultural development in eastern Inner Mongolia (Fig. 1). The study areas included a range of land cover types, from natural vegetation to highly modified agricultural landscapes (Wu et al., 2015; Yang et al., 2015). The regional climate is typically temperate, with a mean annual temperature ranging from 6 ℃ to 7 ℃ and annual precipitation ranging from 300 mm to 400 mm (Wu et al., 2015). From 2020 to 2024, each bird-counting site was visited twice: once before and once after mid-May, with a 4–6-week interval between visits. A species was considered present if detected during at least one visit. Sites were selected based on accessibility and their representation of the region's landscapes. The distance between adjacent sites was kept at a minimum of 500 m to avoid double counting. Within each main land cover type, sampling points were randomly distributed but situated at least 100 m away from clear-cuts and large obstacles (e.g. roads and urban or suburban developments). We engaged six highly experienced ornithologists in bird surveys. They were divided into two groups, recording all bird individuals seen or heard within a 100-m radius for 10 min at each point. Fly-over individuals were counted only if they were using the circular plot, such as for foraging or displaying. Bird surveys were performed within 4 h after sunrise, avoiding days with poor weather or low detectability. We found no significant differences in detection rates and species counts between the two groups. This equivalence in metrics minimizes observer bias and ensures that data collection is robust and reliable.
Figure
1.
Location map of the bird sampling points after thinning (in black) in eastern Inner Mongolia. Map base data is mainly from https://doi.org/10.5281/zenodo.4417810.
2.2
Habitat measures and extracting principal components
For each sites, we randomly set up three 2 m × 2 m plots within a 10-m radius. At each of these plots, we meticulously assessed four local habitat variables: plant cover (estimated as the percentage of vegetated surface at a height of 1 m, observed in front of a Robel pole), plant richness (the number of distinct plant species), plant height (the average height of vegetation measured at ten random points along a diagonal line), and bare ground percentage (the proportion of ground without vegetation cover). The values from these three quadrats at each observation plot were then averaged.
We obtained the annual China Land Cover Dataset with a 30-m resolution in 2020 (https://zenodo.org/record/4417810). This dataset classified land cover into nine categories (cropland, forest, shrub, grassland, water, snow, barren, wetland, and impervious surface) based on vegetation structure (Yang and Huang, 2021). Consequently, seven landscape variables were considered to analyze the broader context of habitat conditions, including (1) edge density; (2) patch density; (3) Shannon diversity of land cover types; (4) grassland proportion (%); (5) cropland proportion (%); (6) total core area; and (7) largest patch index (please see Appendix Table S1 for detailed explanation of these variables). These indices were calculated within a 300-m radius from each sampling point using the R package “landscapemetric” (Hesselbarth et al., 2019).
We used Principal Component Analysis (PCA), a powerful statistical technique widely used in ecological research, to distill complex information from the 11 original habitat variables. Following PCA, each underlying factor is represented by a principal component (PC), allowing the simplification of the overall variation in a smaller number of PCs than the original variables (Vaughan and Ormerod, 2005). PCs are constrained to be uncorrelated, effectively addressing the issue of multi-collinearity (Graham, 2003). PCA was computed by the "prcomp” function built in R.4.3.2 (R Core Team, https://onlinelibrary.wiley.com/doi/full/10.1111/ddi.13061), and the visualization of its outputs were made by “factoextra” (Kassambara, 2016) and “ggplot2” packages (Tollefson and Tollefson, 2021).
2.3
Species’ occurrence response and niche overlap
Our analysis focuses on six breeding birds to study their habitat use and niche overlap, including Tree Sparrow (Passer montanus), Eurasian Magpie (Pica pica), Barn Swallow (Hirundo rustica), Eurasian Skylark (Alauda arvensis), Mongolian Lark (Melanocorypha mongolica), and Asian Short-toed Lark (Calandrella cheleensis). The ecological roles of these sympatric species are poorly documented, particularly concerning how they utilize their respective habitats. The Tree Sparrow, Eurasian Magpie, and Barn Swallow frequently coexist in various locations across the study area. Research indicates that these species can adapt to various habitat conditions, indicating they are ecological generalists (Xu et al., 2020; Abou Zeid et al., 2023; Kim et al., 2023). In contrast, the Eurasian Skylark, Mongolian Lark, and Asian Short-toed Lark are morphologically and ecologically similar, being ground-nesting species with overlapping foraging resources. Their reliance on certain habitat types and foraging strategies makes them more specialized. All six species are among the most abundant in the study region and commonly occur together. They represent a diverse mix of sparrows, larks, and corvids; investigating their habitat use and niche overlap can provide insights into the adaptability of these species to different environments within Inner Mongolia.
We used Generalized Additive Models (GAMs) with the R package "mgcv” to capture complex relationships between species occurrence and habitat gradients (Pedersen et al., 2019). Unlike traditional linear models, GAMs allow for the incorporation of smooth functions, enabling a more accurate representation of the underlying patterns within ecological data (Zuur, 2012). This is particularly advantageous for studying habitat gradients, where relationships may exhibit intricate and non-linear dynamics. We built six individual GAM models, using the presence–absence of each species as response variables and the three extracted habitat principal components as predictors, respectively.
Spatial autocorrelation in species distributions refers to the phenomenon where the spatial arrangement of species occurrences is not random but rather exhibits a pattern where nearby locations show similar species distributions (Dormann et al., 2007). It can increase the likelihood of Type I errors in hypothesis tests, and violate the independence assumption in models like correlation or regression. To accurately assess spatial patterns and avoid biased conclusions, we first plotted spatial correlograms using the “ncf” package (Bjornstad, 2016), to assess the distance at which spatial dependence (measured by Moran's I similarity of species occurrence) are no more similar than that expected by-chance-alone across the region. We then used the calculated distance as a threshold to remove closely spaced points with the function “geoThin” in “enmSdm” package (Morelli et al., 2020). To further account for spatial autocorrelation, the coordinates of points were included as smoothed, interaction terms (i.e., te(longitude, latitude)) in the GAM models. We compared the performance of spatially explicit models with initial non-spatial correlation models using Akaike's Information Criterion (AIC). In addition, we visually inspected and quantitatively checked model residuals using the function ”testSpatialAutocorrelation” in “https://rdrr.io/cran/DHARMa/” package to ensure spatial autocorrelation was properly accounted for (Hartig, 2024). Species occurrence was modeled using a binomial distribution with logit link function. The formula used is: “gam (occurrence ~ s(habitatpc1) + s(habitatpc2) + s(habitatpc3) + te(latitude, longitude), control = list(keepData = TRUE), family = binomial(link = "logit"))”. The default cubic regression splines were used, and no interaction terms were included. Fitted and 95% confidence interval values were extracted from the GAM models and visualized with the R package "visreg” (Breheny et al., 2020).
This study adheres to the Hutchinsonian niche concept, which defines a species' niche as an n-dimensional space (Hutchinson, 1959). However, directly quantifying n-dimensional niches in wild animals, particularly those with wide distributions like birds, is challenging. Here, we primarily focused on habitat niche—a crucial aspect—and considered extracted principal components as multiple sub-dimensions contributing to the overall habitat niche space of each species. Niche breadth and pairwise niche overlap among the six species were computed using the default setting in the R package "nicheROVER", which adopted a Bayesian approach to measure ecological niches and their overlap in n-dimensional space (Lysy et al., 2023). For each Bayesian model, 1000 Markov Chain Monte Carlo iterations were used to characterize posterior distributions of environmental variables. Niche breadth, defined as the 95% probability region of a species' occurrence, was estimated by deriving a point estimate of the mean niche breadth across the posterior sample of mean and covariance (Swanson et al., 2015). "nicheROVER" also allows for the calculation of niche overlap, indicating the probability of one species' occurrence within the niche space of another (Colwell and Futuyma, 1971). It provides directional estimates of niche overlap, accounts for species-specific distributions in multivariate niche space, and generates bivariate projections of the three-dimensional habitat niches (Swanson et al., 2015).
3.
Results
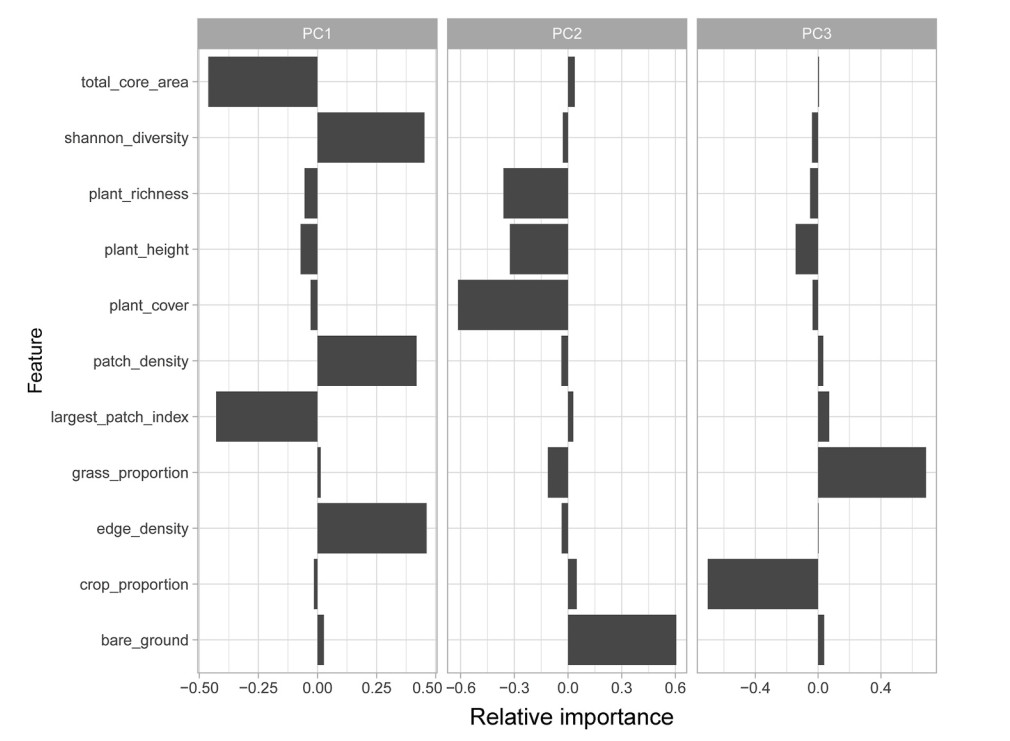
A total of 1336 sites were surveyed along human-modified habitat gradients in eastern Inner Mongolia, China. Tree Sparrow had the highest occurrence frequency, detected at 713 sites (53.4%), followed by the Eurasian Skylark (33.8%) and Mongolian Lark (23.4%). The Barn Swallow, Asian Short-toed Lark, and Eurasian Magpie were detected in 20.5%, 20.3%, and 19.9% of the sites, respectively. The first three principal components explained 41%, 21%, and 14% variability in the habitat data, respectively. PC1 was negatively correlated to the total core area and largest patch index, and positively correlated with patch density, edge density and Shannon diversity of land cover types, indicating an increasing habitat fragmentation gradient. PC2 corresponded to a habitat gradient with an increase in bare ground percentage and a decrease in plant cover, height, and richness. PC3 was positively correlated with grassland proportion and negatively correlated with cropland proportion (see Fig. 2, Appendix Table S2).
Figure
2.
Principal component analysis (PCA) results based upon 11 fine-scale habitat variables assessed at each bird sampling point in Inner Mongolia. The factor loadings of original variables were shown to discern which environmental factors contribute most to the first three principal components (i.e. habitat PC1, PC2 and PC3), respectively.
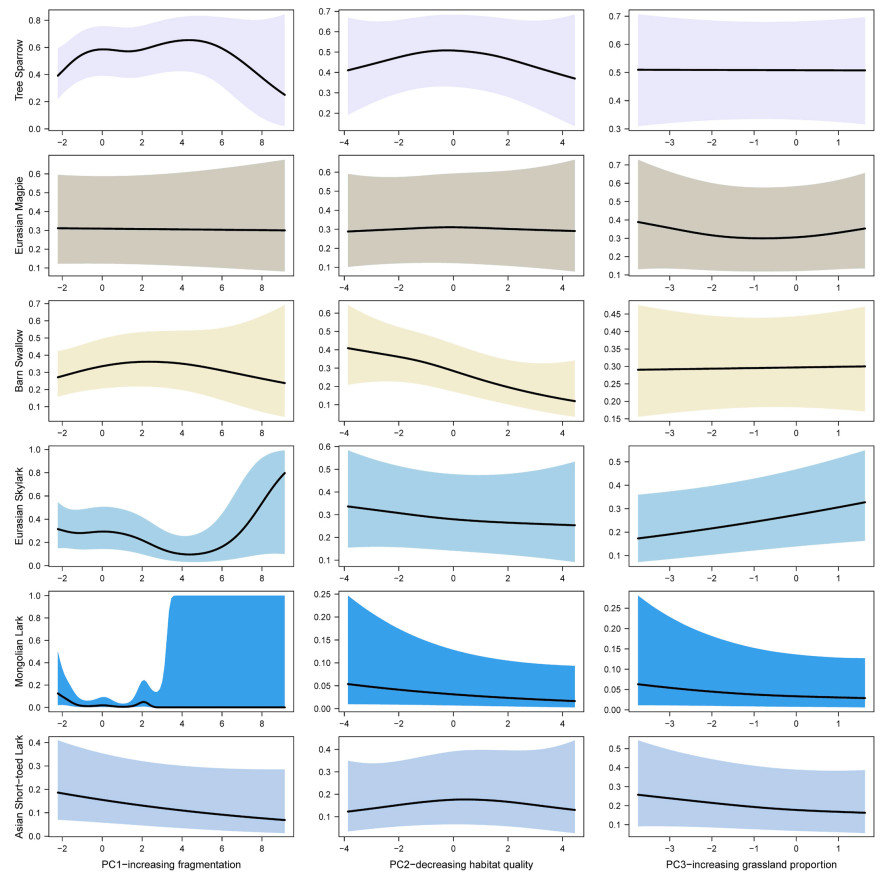
The spatial correlogram plots showed Moran's I close to zero at a distance of 3 km, regardless of the species considered (see Appendix Fig. S1). We used this distance to thin the geographic points, retaining 700 points for subsequent analysis (Fig. 1). The spatially explicit GAM models strongly outperformed the initial non-spatial correlation models. Q-Q Plots of model residuals and Moran's I test confirmed that spatial autocorrelation was properly addressed by including point coordinates as smoothed terms in the GAM models (see Appendix Fig. S2, Table S3). GAM revealed that the occurrence of the six species varied in response to habitat gradients (Table 1, Fig. 3). First, the occurrence of Mongolian Lark and Eurasian Skylark was significantly influenced by the gradient of habitat PC1 (p < 0.001 and p = 0.039,respectively, in Table 1), while other species, including the Asian Short-toed Lark, Tree Sparrow, and Barn Swallow, showed no significant response to this variable. Second, we found that Barn Swallow occurrence significantly decreased with declining habitat quality (p = 0.016, Table 1, Fig. 3), whereas no clear response was observed for the Eurasian Skylark, Mongolian Lark, or Asian Short-toed Lark. Third, the Eurasian Skylark was more likely to occur with an increasing grassland gradient, although this relationship was not statistically significant (p = 0.059). In contrast, Tree Sparrow, Eurasian Magpie, and Barn Swallow showed little to no response to grassland expansion (Table 1, Fig. 3). A significant interaction between longitude and latitude was observed, indicating that the effect of longitude on species occurrence depends on latitude, and vice versa (Table 1).
Table
1.
Summary table of fitted generalized additive models for six sympatric birds along habitat gradients in Inner Mongolia. Significant values (p < 0.05) indicated in bold.
Figure
3.
The relationships between six sympatric breeding birds' occurrence and habitat gradients fitted in GAM models. The y axis shows the predicted occurrence possibility of each species and the x axis the extracted habitat gradients. Solid dark lines show the response curve derived from GAM models and shaded areas represent the 95% confidence intervals.
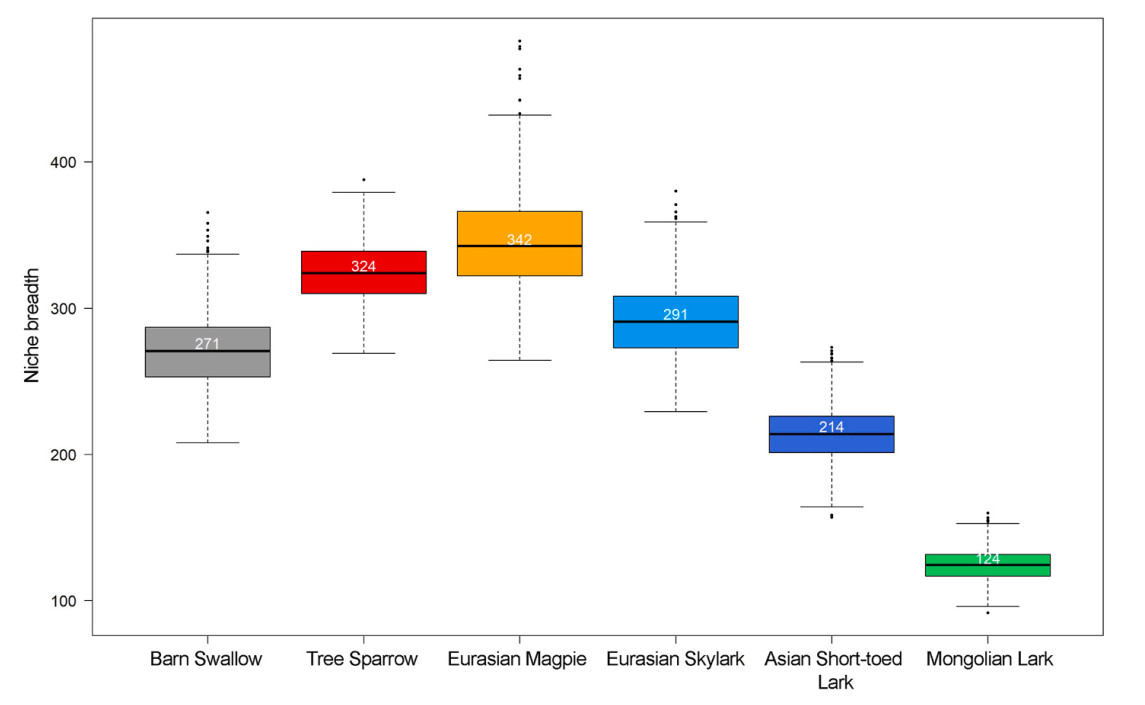
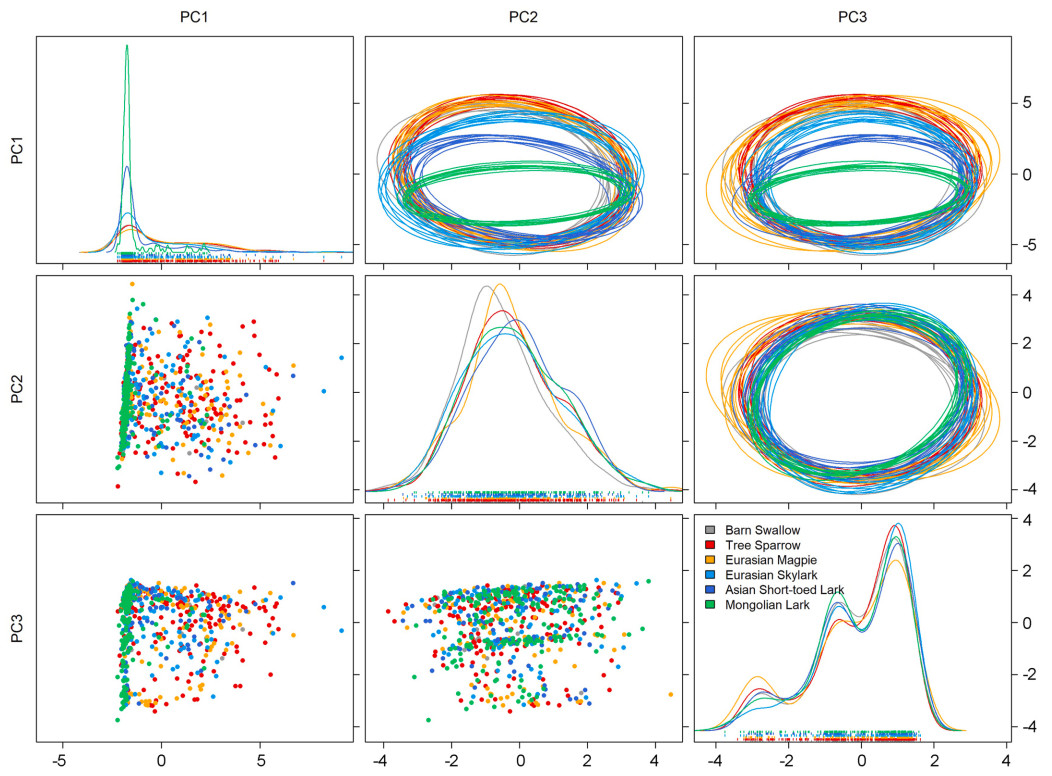
The Eurasian Magpie exhibited the largest estimated niche breadth (median ± SE: 342 ± 33), followed by the Tree Sparrow (median ± SE: 324 ± 20) and Eurasian Skylark (median ± SE: 291 ± 25). The Mongolian Lark, a typical grassland species, had the smallest estimated niche size (median ± SE: 124 ± 10) among the species studied. Habitat generalists tended to occupy larger niches than grassland specialists, except for the Barn Swallow (Fig. 4). A considerable amount of niche overlap was found in the habitat use of the six co-occurring species (Table 2). Mongolian Lark had the highest chance of being found within the niche space of the other five species, with a 96.36% probability of occurrence within the Tree Sparrow's niche as an example (Table 2, Fig. 5Fig. 5). The shapes of density estimates for each species varied markedly along habitat PC1, but the differences were less pronounced along habitat PC2 and PC3 (Fig. 5).
Figure
4.
Boxplot showing the distribution of estimated habitat niche size, which were calculated from the posterior distributions of μ (mean) and Σ (variance) of the occupying habitat gradients by the studied birds. The medians are represented by the solid horizontal lines, inter-quartile ranges by the boxes, whiskers by the 10th to the 90th percentile, and outliers by the black points. Values of the medians are also shown in white texts.
Table
2.
The niche overlap calculated across 1000 Monte Carlo iterations between each species. Note that the overlap metrics are directional, each value represents the mean posterior probability (%) that an individual from Species A (along rows) will be found in the 95% niche space of Species B (along columns).
Figure
5.
Bivariate projections of habitat gradient values occupied by the six co-occurring birds. Bottom-left: scatterplots of raw habitat gradient values occupied by each species. Diagonal: density distribution of habitat gradient values occupied by each species. Top-right: random elliptical projections of habitat niche region for each species.
We identified distinct occurrence patterns of the six sympatric birds along gradients of human-modified habitats. Some species exhibit adaptability and persistence across a range of modified habitats, while others show specific preferences or avoidance. The analysis of niche overlap reveals both shared and partitioned niches among sympatric breeding species. Generalist birds, such as the Eurasian Magpie, tend to occupy larger ecological niches, while specialists, like the Mongolian Lark, are likely to occupy smaller, more specialized niches. Our study offers valuable insights into the niche overlap and habitat preferences of six avian species, enhancing the broader understanding of species coexistence and environmental adaptation.
Habitat has long been a key factor shaping grassland bird distribution (Reino et al., 2013; Han et al., 2021; Veech, 2021; Brüggeshemke et al., 2022). However, the deviance explained differently in the fitted GAM models (Table 1) suggests that habitat gradients alone can only partly explain species distributions (Anderson, 2017). The significant interaction between longitude and latitude suggests that species occurrences are not random, but instead exhibit a spatial clustering pattern. To mitigate the effects of spatial autocorrelation, we applied spatial filtering and included spatially structured random effects in the GAM models. Ecological processes, such as environmental gradients, habitat preferences, and resource availability, which are not included in these models, may explain other spatially autocorrelated errors. For example, regional temperature and precipitation, which typically show latitudinal and altitudinal patterns, can affect species presence and abundance but may be underrepresented in the modeling framework. Biotic factors, such as dispersal dynamics, can create patterns of species occurrence that reflect spatial dependencies not captured by the GAM covariates (Nathan and Muller-Landau, 2000). For instance, species that rely on specific dispersal corridors or have limited dispersal abilities may exhibit spatial patterns correlated with geographic features or habitat availability, leading to residual spatial autocorrelation if these factors are not integrated into the model (Sheard et al., 2020). This highlights the complexity of ecological systems. High-resolution or comprehensive data can lead to more accurate estimates of species-environment relationships and valid inferences about species distributions across different spatial scales.
Our results align with previous studies showing that the impact of habitat fragmentation on bird occurrence is species-specific and varies across spatial scales (Boscolo and Metzger, 2009; Shahan et al., 2017; McDonald and Koper, 2022). For example, the occurrence of Mongolian Lark increased in larger, more connected habitats, whereas Tree Sparrow likely adapted to more fragmented habitats. Tree Sparrows are widely distributed and highly adaptable to diverse habitat conditions. Their ability to utilize various vegetation structures and tolerate some habitat modification enables them to thrive in both natural and modified grassland landscapes (Zhang et al., 2008; Lee et al., 2024). They can also benefit from agricultural practices that create open spaces, as long as these changes are not too drastic. In contrast, the Mongolian Lark is specialized for specific grassland habitats. This species rely on native grass species and undisturbed landscapes for nesting and foraging (Han et al., 2023). Therefore, this bird may face challenges in areas where grasslands have been heavily modified or converted for agriculture.
We estimated the three-dimensional habitat niche breadths of six co-occurring bird species in a poorly studied region. Notably, the Eurasian Magpie had the largest estimated niche breadth. This species has an extensive range and can be found in natural and cultivated areas, including hedgerow trees, orchards, gardens, farmyards, and even city centers (Xu et al., 2020; Abou Zeid et al., 2023). This suggests broader habitat utilization compared to other species, potentially indicating greater adaptability or flexibility in resource use. In contrast, the Mongolian Lark, a typical grassland bird, displayed the smallest estimated niche breadth, indicating greater dependence on specific environmental conditions, leading to more restricted habitat use. This finding supports the ecological theory that specialists tend to have narrower niche breadths than generalists (Herkert, 1994; Fridley et al., 2007; Devictor et al., 2010). Interestingly, the Barn Swallow had a narrower niche breadth than the Eurasian Skylark, despite being a habitat generalist. This discrepancy may be due to the Barn Swallow's more specialized foraging behavior and reliance on specific nesting sites, such as human-inhabited buildings (Kim et al., 2023), which could limit its habitat use compared to the more adaptable Eurasian Skylark.
When species coexist (sympatry) and share habitats (syntopy), they may compete for limited resources, especially if they are closely related and have similar morphological traits (Hart et al., 2018). We hypothesized sympatric species that are morphologically and phylogenetically similar are likely to show greater niche overlap. In this study, the Mongolian Lark exhibited the highest probability of occupying the niche space of the other two grassland specialists, i.e. 95.6% within the Asian Short-toed Lark's niche, and 96.9% within the Eurasian Skylark's. This is consistent with previous studies showing that, as open ground-nesting passerine larks, they likely share similar responses to abiotic variables (Han et al., 2020). Habitat overlap can lead to competition, but only when resources are limited. If resources are abundant, competition may not occur, even with spatial niche overlap. In such cases, niche overlap does not necessarily indicate ongoing competition (Pastore et al., 2021). However, when one competitor has a narrow niche breadth and exhibits high overlap with another, the risk of extinction may increase.
The competitive exclusion principle suggests that species with identical ecological requirements or functions cannot coexist (Darlington, 1972; Rodríguez et al., 2015; Cui et al., 2020). To mitigate competitive pressures and coexist effectively, species must develop subtle differences in resource or habitat requirements, thereby increasing niche separation. In our study, the density estimates of the three specialist birds varied markedly along habitat PC1, moderately along PC2, and minimally along PC3. The density distribution of Mongolian Lark along PC1 was narrower and declined more sharply than the other two larks, suggesting lower tolerance to habitat fragmentation. Niche breadth estimates confirmed the Mongolian Lark's specialized and limited niche. Segregation along sub-dimensions within the habitat niche space may promote coexistence between these species. Partial habitat partitioning (i.e., sharing to some extent) may be sufficient for species coexistence, while still allowing enough overlap in habitat use to maintain individual abundances. These results are partly consistent with a previous study showing that Mongolian Lark likely co-occurs with Eurasian Skylark and shares similar habitat responses. However, their sensitivity to habitat variables may differ (Han et al., 2020), leading to different niches. Identifying species with high niche overlap allows conservation efforts to focus on promoting suitable habitats and resource availability, reducing competition and enhancing species coexistence (Herkert, 1994). Research has shown that preserving diverse habitat types and maintaining spatial heterogeneity within grasslands supports the coexistence of bird species with varying niche requirements (Coppedge et al., 2008; Greer et al., 2016; Londe et al., 2019).
Measuring n-dimensional niches in the wild presents significant challenges, particularly for highly mobile species like birds. Focusing on specific habitat axes enables more manageable and precise assessments of how sympatric breeding birds use and partition resources. In this study, we observed substantial niche overlap between species and suggested that segregation along sub-dimensions within the habitat niche space might facilitate coexistence among co-occurring species. Understanding the specific needs and sensitivities of various species will enable conservationists to design targeted strategies to protect vulnerable specialists and preserve the shared habitats essential for maintaining ecosystem diversity. However, studies focusing on a single niche space often show less segregation than those employing multi-niche space approaches. To gain clearer insights into spatial and resource-based interactions between species, future work could benefit from equipping individuals with high-accuracy GPS loggers, collecting dietary prey samples (to assess fine-scale partitioning), and obtaining biological tissues (e.g., blood) for isotope analysis.
The datasets analyzed during the current study are available as in Appendix B.
Declaration of competing interest
The authors declare that they have no known competing financial interests or personal relationships that could have appeared to influence the work reported in this paper.
Acknowledgements
We thank Jiyuan Yao, Guiquan Xiang, and the residents for their help in field survey. We also thank anonymous reviewers for their helpful comments.
Abou Zeid, F., Morelli, F., Ibáñez-Álamo, J.D., Díaz, M., Reif, J., Jokimäki, J., et al., 2023. Spatial overlap and habitat selection of corvid species in European cities. Animals 13, 1192. .
Anderson, R.P., 2017. When and how should biotic interactions be considered in models of species niches and distributions? J. Biogeogr. 44, 8–17. .
Anjos, L., Bochio, G.M., Medeiros, H.R., Almeida, B.d.A., Lindsey, B.R.A., Calsavara, L.C., et al., 2019. Insights on the functional composition of specialist and generalist birds throughout continuous and fragmented forests. Ecol. Evol. 9, 6318–6328. .
Barrero, A., Ovaskainen, O., Traba, J., Gómez-Catasús, J., 2023. Co-occurrence patterns in a steppe bird community: insights into the role of dominance and competition. Oikos 2023, e09780. .
Bibby, C.J., Burgess, N.D., Hill, D.A., Mustoe, S., 2000. Bird Census Techniques. Elsevier.
Blonder, B., Lamanna, C., Violle, C., Enquist, B.J., 2014. The n-dimensional hypervolume. Global Ecol. Biogeogr. 23, 595–609. .
Boscolo, D., Metzger, J.P., 2009. Is bird incidence in Atlantic forest fragments influenced by landscape patterns at multiple scales? Landsc. Ecol. 24, 907–918. .
Breheny, P., Burchett, W., Breheny, M.P., 2020. Package ‘visreg’. R Package Version 2.
Brüggeshemke, J., Drung, M., Löffler, F., Fartmann, T., 2022. Effects of local climate and habitat heterogeneity on breeding-bird assemblages of semi-natural grasslands. J. Ornithol. 163, 695–707. .
Büchi, L., Vuilleumier, S., 2014. Coexistence of specialist and generalist species is shaped by dispersal and environmental factors. Am. Nat. 183, 612–624.
Carscadden, K.A., Emery, N.C., Arnillas, C.A., Cadotte, M.W., Afkhami, M.E., Gravel, D., et al., 2020. Niche breadth: causes and consequences for ecology, evolution, and conservation. Q. Rev. Biol. 95, 179–214. .
Clavel, J., Julliard, R., Devictor, V., 2011. Worldwide decline of specialist species: toward a global functional homogenization? Front. Ecol. Environ. 9, 222–228. .
Colwell, R.K., Futuyma, D.J., 1971. On the measurement of niche breadth and overlap. Ecology 52, 567–576. .
Coppedge, B.R., Fuhlendorf, S.D., Harrell, W.C., Engle, D.M., 2008. Avian community response to vegetation and structural features in grasslands managed with fire and grazing. Biol. Conserv. 141, 1196–1203. .
Correll, M.D., Strasser, E.H., Green, A.W., Panjabi, A.O., 2019. Quantifying specialist avifaunal decline in grassland birds of the Northern Great Plains. Ecosphere 10, e02523. .
Cui, W., Marsland, R., Mehta, P., 2020. Effect of resource dynamics on species packing in diverse ecosystems. Phys. Rev. Lett. 125, 048101. .
Darlington, P.J., 1972. Competition, competitive repulsion, and coexistence. P. Natl. Acad Sci. 69, 3151–3155. .
Devictor, V., Clavel, J., Julliard, R., Lavergne, S., Mouillot, D., Thuiller, W., et al., 2010. Defining and measuring ecological specialization. J. Appl. Ecol. 47, 15–25. .
Dormann, C., McPherson, J., Araújo, M., Bivand, R., Bolliger, J., Carl, G., et al., 2007. Methods to account for spatial autocorrelation in the analysis of species distributional data: a review. Ecography 30, 609–628. .
Fahrig, L., 2017. Ecological responses to habitat fragmentation per se. Annu. Rev. Ecol. Evol. Syst. 48, 1–23. .
Finke, D.L., Snyder, W.E., 2008. Niche partitioning increases resource exploitation by diverse communities. Science 321, 1488–1490. .
Fraixedas, S., Lindén, A., Piha, M., Cabeza, M., Gregory, R., Lehikoinen, A., 2020. A state-of-the-art review on birds as indicators of biodiversity: Advances, challenges, and future directions. Ecol. Indicat. 118, 106728
Fridley, J.D., Vandermast, D.B., Kuppinger, D.M., Manthey, M., Peet, R.K., 2007. Co-occurrence based assessment of habitat generalists and specialists: a new approach for the measurement of niche width. J. Ecol. 95, 707–722. .
Gabaldón, C., Montero-Pau, J., Carmona, M.J., Serra, M., 2015. Life-history variation, environmental fluctuations and competition in ecologically similar species: modeling the case of rotifers. J. Plankton Res. 37, 953–965. .
Gaston, K.J., Blackburn, T.M., Goldewijk, K.K., 2003. Habitat conversion and global avian biodiversity loss. Proc. R. Soc. Lond. B 270, 1293–1300.
Greer, M.J., Bakker, K.K., Dieter, C.D., 2016. Grassland bird response to recent loss and degradation of native prairie in central and western South Dakota. Wilson J. Ornithol. 128, 278–289. .
Haddad, N.M., Brudvig, L.A., Clobert, J., Davies, K.F., Gonzalez, A., Holt, R.D., et al., 2015. Habitat fragmentation and its lasting impact on Earth's ecosystems. Sci. Adv. 1, e1500052. .
Han, Z., Zhang, L., Jiang, Y., Wang, H., Jiguet, F., 2020. Unravelling species co-occurrence in a steppe bird community of Inner Mongolia: insights for the conservation of the endangered Jankowski's Bunting. Divers. Distrib. 26, 843–852. .
Han, Z., Zhang, L., Jiang, Y., Wang, H., Jiguet, F., 2021. Local habitat and landscape attributes shape the diversity facets of bird communities in Inner Mongolian grasslands. Avian Conserv. Ecol. 16, 3. .
Han, Z., Yang, X., Zhao, X., Jiguet, F., Tryjanowski, P., Wang, H., 2023. Mongolian Lark as an indicator of taxonomic, functional and phylogenetic diversity of steppe birds. Avian Res. 14, 100124. .
Hart, K.M., Iverson, A.R., Fujisaki, I., Lamont, M.M., Bucklin, D., Shaver, D.J., 2018. Sympatry or syntopy? Investigating drivers of distribution and co-occurrence for two imperiled sea turtle species in Gulf of Mexico neritic waters. Ecol. Evol. 8, 12656–12669. .
Hartig, F., 2024. DHARMa: Residual Diagnostics for Hierarchical (Multi-Level / Mixed) Regression Models. R package version 0.4.7. .
Herkert, J.R., 1994. The effects of habitat fragmentation on midwestern grassland bird communities. Ecol. Appl. 4, 461–471. .
Hesselbarth, M.H., Sciaini, M., With, K.A., Wiegand, K., Nowosad, J., 2019. landscapemetrics: an open‐source R tool to calculate landscape metrics. Ecography 42, 1648–1657.
Hutchinson, G.E., 1957. Concluding remarks. Population studies: animal ecology and demography. Cold Spring Harbor Symp. Quant. Biol. 22, 415–427.
Hutchinson, G.E., 1959. Homage to Santa rosalia or why are there so many kinds of animals? Am. Nat. 93, 145–159.
Kassambara, A., 2016. Factoextra: extract and visualize the results of multivariate data analyses. R package version 1.
Kim, M., Chung, O.-S., Lee, J.K., 2023. The relationship between nest location selection of Barn swallows (Hirundo rustica) and human activity and residence. Sci. Rep. 13, 23008. .
Lee, J.-H., Kim, S.-Y., Sung, H.-C., 2024. Nest site selection, nest characteristics, and breeding ecology of the Eurasian tree sparrow, Passer montanus, living in an urban area. Anim. Taxon. Ecol. 70, 46–60. .
Leibold, M.A., 1991. Trophic interactions and habitat segregation between competing Daphnia species. Oecologia 86, 510–520. .
Londe, D.W., Fuhlendorf, S.D., Elmore, R.D., Davis, C.A., 2019. Landscape heterogeneity influences the response of grassland birds to energy development. Wildl. Biol. 2019, 00523. .
Lysy, M., Stasko, A.D., Swanson, H.K., 2023. Package ‘nicheROVER’. .
McDonald, L., Koper, N., 2022. Landscape openness, not patch size or grassland amount, drives area sensitivity of songbirds in northern tall-grass prairies. Landsc. Ecol. 37, 951–967. .
Morelli, T.L., Smith, A.B., Mancini, A.N., Balko, E.A., Borgerson, C., Dolch, R., et al., 2020. The fate of Madagascar's rainforest habitat. Nat. Clim. Change 10, 89–96. .
Nathan, R., Muller-Landau, H.C., 2000. Spatial patterns of seed dispersal, their determinants and consequences for recruitment. Trends Ecol. Evol. 15, 278–285. .
Newbold, T., Hudson, L.N., Phillips, H.R.P., Hill, S.L.L., Contu, S., Lysenko, I., et al., 2014. A global model of the response of tropical and sub-tropical forest biodiversity to anthropogenic pressures. Proc. R. Soc. B: Biol. Sci. 281, 20141371. .
Pastore, A.I., Barabás, G., Bimler, M.D., Mayfield, M.M., Miller, T.E., 2021. The evolution of niche overlap and competitive differences. Nat. Ecol. Evol. 5, 330–337. .
Pedersen, E.J., Miller, D.L., Simpson, G.L., Ross, N., 2019. Hierarchical generalized additive models in ecology: an introduction with mgcv. PeerJ 7, e6876
Pereira, H.M., Leadley, P.W., Proença, V., Alkemade, R., Scharlemann, J.P., Fernandez-Manjarrés, J.F., et al., 2010. Scenarios for global biodiversity in the 21st century. Science 330, 1496–1501.
Reino, L., Beja, P., Araújo, M.B., Dray, S., Segurado, P., 2013. Does local habitat fragmentation affect large-scale distributions? The case of a specialist grassland bird. Divers. Distrib. 19, 423–432. .
Rodríguez, R.A., Herrera, A.M., Santander, J., Miranda, J.V., Fernández-Rodríguez, M.J., Quirós, Á., et al., 2015. Uncertainty principle in niche assessment: a solution to the dilemma redundancy vs. competitive exclusion, and some analytical consequences. Ecol. Model. 316, 87–110. .
Rosenberg, K.V., Dokter, A.M., Blancher, P.J., Sauer, J.R., Smith, A.C., Smith, P.A., et al., 2019. Decline of the North American avifauna. Science 366, 120–124. .
Sales, L.P., Hayward, M.W., Loyola, R., 2021. What do you mean by “niche”? Modern ecological theories are not coherent on rhetoric about the niche concept. Acta Oecol. 110, 103701
Schoener, T.W., 1974. Competition and the form of habitat shift. Theor. Popul. Biol. 6, 265–307. .
Seyer, Y., Gauthier, G., Fauteux, D., Therrien, J.-F., 2020. Resource partitioning among avian predators of the Arctic tundra. J. Anim. Ecol. 89, 2934–2945. .
Shahan, J.L., Goodwin, B.J., Rundquist, B.C., 2017. Grassland songbird occurrence on remnant prairie patches is primarily determined by landscape characteristics. Landsc. Ecol. 32, 971–988. .
Sheard, C., Neate-Clegg, M.H.C., Alioravainen, N., Jones, S.E.I., Vincent, C., MacGregor, H.E.A., et al., 2020. Ecological drivers of global gradients in avian dispersal inferred from wing morphology. Nat. Commun. 11, 2463. .
Smith, A.B., Godsoe, W., Rodríguez-Sánchez, F., Wang, H.-H., Warren, D., 2019. Niche estimation above and below the species level. Trends Ecol. Evol. 34, 260–273. .
Stanton, R.L., Morrissey, C.A., Clark, R.G., 2018. Analysis of trends and agricultural drivers of farmland bird declines in North America: a review. Agric. Ecosyst. Environ. 254, 244–254. .
Staude, I.R., Overbeck, G.E., Fontana, C.S., Bencke, G.A., da Silva, T.W., Mimet, A., et al., 2021. Specialist birds replace generalists in grassland remnants as land use change intensifies. Front. Ecol. Evol. 8, 597542. .
Swanson, H.K., Lysy, M., Power, M., Stasko, A.D., Johnson, J.D., Reist, J.D., 2015. A new probabilistic method for quantifying n-dimensional ecological niches and niche overlap. Ecology 96, 318–324. .
Tollefson, M., Tollefson, M., 2021. Graphics with the Ggplot2 Package: an Introduction. Visualizing Data in R 4: Graphics Using the Base, Graphics, Stats, and Ggplot2 Packages, pp. 281–293.
Vaughan, I.P., Ormerod, S.J., 2005. Methodological insights: increasing the value of principal components analysis for simplifying ecological data: a case study with rivers and river birds. J. Appl. Ecol. 42, 487-497. .
Veech, J.A., 2021. Habitat Ecology and Analysis. Oxford University Press, USA.
van Vliet, H.E.J., Stutchbury, B.J.M., Newman, A.E.M., Norris, D.R., 2020. The impacts of agriculture on an obligate grassland bird of North America. Agric. Ecosyst. Environ. 287, 106696. .
Wu, J., Zhang, Q., Li, A., Liang, C., 2015. Historical landscape dynamics of Inner Mongolia: patterns, drivers, and impacts. Landsc. Ecol. 30, 1579-1598
Xu, Y., Cao, Z., Wang, B., 2020. Effect of urbanization intensity on nest-site selection by Eurasian Magpies (Pica pica). Urban Ecosyst. 23, 1099–1105. .
Yang, J., Huang, X., 2021. The 30 m annual land cover dataset and its dynamics in China from 1990 to 2019. Earth Syst. Sci. Data 13, 3907–3925. .
Yang, E.H., Ravikumar, P., Allen, G.I., Liu, Z.D., 2015. Graphical models via univariate exponential family distributions. J. Machine Learn. Res. 16, 3813–3847.
Zhang, S., Zheng, G., Xu, J., 2008. Habitat use of urban Tree Sparrows in the process of urbanization: Beijing as a case study. Front. Biol. China 3, 308–314. .
Zuur, A.F., 2012. A Beginner’s Guide to Generalized Additive Models with R. Highland Statistics Limited, Newburgh.
Table
1.
Summary table of fitted generalized additive models for six sympatric birds along habitat gradients in Inner Mongolia. Significant values (p < 0.05) indicated in bold.
Table
2.
The niche overlap calculated across 1000 Monte Carlo iterations between each species. Note that the overlap metrics are directional, each value represents the mean posterior probability (%) that an individual from Species A (along rows) will be found in the 95% niche space of Species B (along columns).

 DownLoad:


 Email Alerts
 RSS Feeds