Guangyao Wang, Jinming Zhao, Weiqiang Li, Xiangrong Song, Yong Zhang, Chunlin Li, Willem F. de Boer. 2023: Responses of breeding waterbird communities to environmental changes in subsidence wetlands in the North China Plain. Avian Research, 14(1): 100110. DOI: 10.1016/j.avrs.2023.100110
Citation:
Guangyao Wang, Jinming Zhao, Weiqiang Li, Xiangrong Song, Yong Zhang, Chunlin Li, Willem F. de Boer. 2023: Responses of breeding waterbird communities to environmental changes in subsidence wetlands in the North China Plain. Avian Research, 14(1): 100110. DOI: 10.1016/j.avrs.2023.100110
Guangyao Wang, Jinming Zhao, Weiqiang Li, Xiangrong Song, Yong Zhang, Chunlin Li, Willem F. de Boer. 2023: Responses of breeding waterbird communities to environmental changes in subsidence wetlands in the North China Plain. Avian Research, 14(1): 100110. DOI: 10.1016/j.avrs.2023.100110
Citation:
Guangyao Wang, Jinming Zhao, Weiqiang Li, Xiangrong Song, Yong Zhang, Chunlin Li, Willem F. de Boer. 2023: Responses of breeding waterbird communities to environmental changes in subsidence wetlands in the North China Plain. Avian Research, 14(1): 100110. DOI: 10.1016/j.avrs.2023.100110
School of Resources and Environmental Engineering, Anhui University, Hefei, 230601, China
b.
School of Life Science, Huaibei Normal University, Huaibei, 235000, China
c.
College of Biology and the Environment, Nanjing Forestry University, Nanjing, 210037, China
d.
Anhui Province Key Laboratory of Wetland Ecosystem Protection and Restoration, Anhui University, Hefei, 230601, China
e.
Wildlife Ecology and Conservation Group, Wageningen University & Research, 6708PB, Wageningen, the Netherlands
Funds: This work was supported by the National Natural Science Foundation of China (grant 31970500 and 31770571), the Excellent Youth Project of the Anhui Natural Science Foundation (grant 2108085Y09). The funders have no role in study design, data collection and analysis, decision to publish, or preparation of the manuscript
In the context of global degradation and loss of natural wetlands, waterbirds have been increasingly using artificial wetlands as alternative habitats. However, waterbirds are facing various threats in these artificial wetlands, due to dramatic environmental changes induced by anthropogenic activities. Exploring the effects of these changes on the temporal dynamics of the waterbird communities can help understand how waterbirds adapt to environmental changes and thus formulate effective management and conservation plans. In this study, we carried out field surveys on waterbirds and environmental factors across 20 subsidence wetlands created by underground coal mining in the Huainan coal mining area in the breeding seasons of 2016 and 2021. We predicted that the waterbird assemblages (i.e., number of individuals, species richness, Shannon–Wiener diversity, Pielou evenness and species composition) differed between the two years, and that these differences were correlated with the temporal changes in environmental factors. Across the surveyed wetlands, we recorded 26 waterbird species in 2016 and 23 in 2021. For individual wetlands, the number of waterbird individuals and species richness increased by 71.6% and 20.1%, respectively, over the five years, with no changes in Shannon–Wiener diversity and Pielou evenness. The overall increase in the number of bird individuals was mainly caused by an increase in vegetation gleaners and gulls that adapt well to anthropogenic activities. The species composition was significantly different between the two years, which was mainly caused by changes in the number of individuals of dominant species under influence of changes in human activities. For most wetlands, the temporal pairwise β-diversities could be explained by species turnover rather than nestedness, probably due to high mobility of waterbird species and dramatic changes in local environments. Our study suggests that waterbird communities could respond to environmental changes in subsidence wetlands, providing important implications for waterbird conservation in human-dominated artificial wetlands.
Natural wetlands are facing global pressure with increasing anthropogenic activities and environmental changes (Ma et al., 2004; Kloskowski et al., 2009; Davidson, 2014). Almost half of the natural wetlands worldwide have been lost, degraded, or transformed in the last century (Ma et al., 2004, 2010). As a consequence, waterbirds are under great threats due to their dependency on wetland habitats (Ma et al., 2010). Over 20% of waterbird species have experienced rapid population declines and approximately 19% of the species have been recognized as threatened species by the IUCN (the International Union for Conservation of Nature; Wang et al., 2018).
With the progressive loss and extensive degradation of natural wetlands, waterbirds have been found to use various artificial wetlands as complementary habitats, such as reservoirs, aquaculture ponds, and paddy fields (Ma et al., 2010; Giosa et al., 2018; Rajpar et al., 2022). These artificial wetlands are often created or greatly modified by humans, but can still contribute to biodiversity conservation (Ma et al., 2010; Li et al., 2019a). Although previous studies suggested that created wetlands could serve as compensatory or alternative habitats for waterbirds, some critics argue that the intensive anthropogenic disturbances might cause more threats to waterbirds in these artificial wetlands than in natural ones (Tourenq et al., 2001; Ma et al., 2010). The debate is continuing and has not been settled, and these man-made wetlands are attracting increasing number of waterbirds. Due to the high sensitivity of waterbirds in these complex human-dominated environments, more research is required to better understand how waterbird assemblages respond to the dramatic environmental changes in artificial wetlands which are increasing at the global scale.
Waterbirds require suitable habitats with sufficient resources under appropriate conditions, and some species can move quickly over large distances, responding to environmental changes in wetlands at multiple levels (Henry and Cumming, 2017). A variety of environmental factors, such as wetland size, aquatic vegetation, water depth and quality, have been found to influence reproduction, growth, survival and behaviour of waterbirds (Ma et al., 2010; Lantz et al., 2011). The effects of environmental changes might be species-specific and may ultimately result in changes in waterbird populations and communities (Ma et al., 2010; Tavares et al., 2015). For example, global wetland loss and degradation have led to population declines of many waterbirds species (Wang et al., 2022). Local environmental changes can also immediately result in changes in species diversity and compositions of waterbird communities (Cintra, 2019; Li et al., 2021a,b). Understanding the underlying ecological processes of the environmental effects on changes of waterbird communities can provide important insights for waterbird conservation. Furthermore, compared to natural wetlands, environmental changes in artificial wetlands are more dramatic and their influence on waterbirds should be given particular attention.
Artificial wetlands are quite diverse and comprise many types, such as paddy fields and agricultural ponds (Jackson et al., 2020). As a special type of artificial wetlands, subsidence wetlands created by mining activities are expanding and attracting increasing attention on the effects of these human-induced landscape modifications on wildlife. Previous studies investigating biotic communities in subsidence wetlands focused on taxa with low movement capacities, such as benthos and planktons (Bielańska-Grajner and GŁadysz, 2010; Lewin et al., 2015). However, there have been few studies investigating the responses of waterbirds which have high movement capacities and can respond quickly to environmental changes in these artificial wetlands. As one of the largest coal production and consumption countries in the world, total coal production in China was about 3.9 × 10⁹ tonnes in 2013, almost half of the global total production (Wang et al., 2019). More than 90% of this coal was produced by underground extraction, causing land destruction and subsidence (Zhang et al., 2019). It was estimated that the area of subsidence land caused by underground coal mining approached 2 × 10⁴ km2 in 2018 in China (Hu and Guo, 2018). In the North China Plain, large subsidised areas have been waterlogged and transformed into wetlands under influence of rainfall and rising groundwater levels (Meng et al., 2009). In the context of loss and degradation of natural wetlands, these newly unintended man-made wetlands have been found to provide habitats for a wide range of waterbirds, particularly migratory birds from the East Asian–Australasian Flyway (Li et al., 2019a). These waterbirds are strongly affected by local environmental conditions, providing an opportunity to explore how waterbirds adapt to the intensive environmental changes in artificial wetlands (Li et al., 2019b). A previous study found that the spatial variation in community structure was mainly caused by species replacement rather than nestedness, and attributed this variation to environmental changes and species' high dispersal capacities (Li et al., 2021a,b). Due to intensive human activities, subsidence wetlands have experienced large environmental changes at various scales (Li et al., 2019a). However, no study has investigated how waterbird communities respond to temporal changes in environmental variables, and which process contributes more to the temporal variation in community structure.
In this study, we quantified the temporal changes in the breeding waterbird communities from 2016 to 2021 across subsidence wetlands in the Huainan coal mining area in the North China Plain, and analyzed the effects of changes in environmental variables. Specifically, we carried out field surveys for waterbirds and environmental factors across 20 subsidence wetlands in the breeding seasons of 2016 and 2021. The differences in the number of waterbird individuals, species diversity and community composition between the two years were tested and related to temporal changes in environmental variables. We expected that changes in environmental condition (e.g., increase in wetland size, or human disturbance) would result in changes in community indices (number of individuals, species richness, Shannon–Wiener diversity and Pielou evenness) of these waterbird species, especially due to changes in individual numbers of a few dominant species. We also quantified and decomposed the temporal pairwise β-diversity to analyse the underlying process of temporal shifts in waterbird assemblage structure (Baselga, 2010; Baselga et al., 2015). We hypothesized that the temporal pairwise β-diversity would be dominated by species turnover rather than nestedness due to birds' strong dispersal capacity and environmental changes. This study is expected to generate new insights into how waterbird communities respond to habitat changes in artificial wetlands, and provide important implications for improving management and conservation plans.
2.
Methods
2.1
Study area
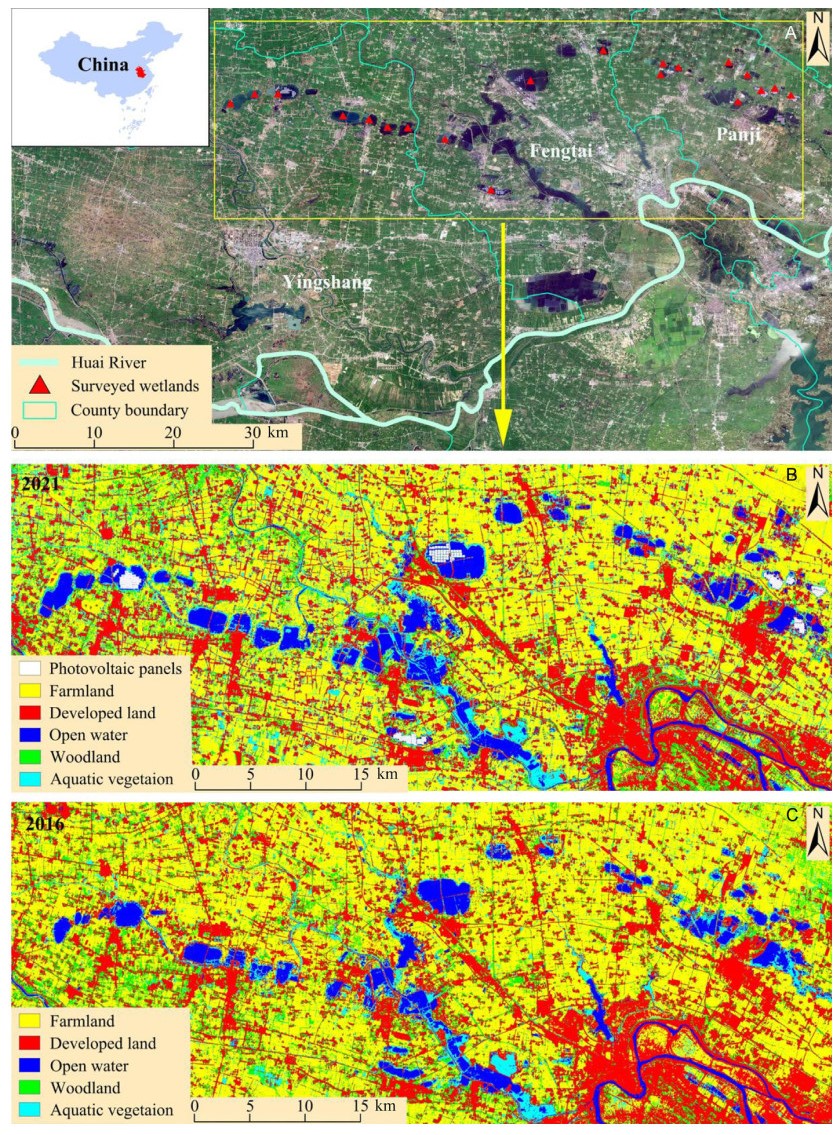
We carried out this study in the Huainan coal mining area (32.71°–32.88° N, 116.22°–116.88° E), which is situated in the south of the North China Plain (Fig. 1). The area is dominated by flat agricultural lands with an average elevation of 30 m above sea level (Li et al., 2019c). It has a typical temperate monsoon climate, with an average annual temperature of 14.7 ℃ and an average annual precipitation of 933 mm. The rainy season is from April to August.
Figure
1.
Field survey sites of waterbirds and land cover characteristics surrounding the subsidence wetlands in the Huainan coal mining area. B and C are the land cover maps of 2021 and 2016, respectively.
As one of the 14 largest coal resource bases in China, the Huainan coal mining area has a long history of underground coal excavation activities (Château et al., 2019). The massive underground coal mining has resulted in large-scale land destruction and subsidence, which was estimated to approach 350 km2 by 2020 (Liu et al., 2021). Due to abundant rainfall and increasing water table, over half of the subsidence area has been flooded with a mean water depth of 3.48 m (Ouyang et al., 2018), creating dozens of wetlands. Along with the change from a terrestrial agriculture landscape to a wetland ecosystem, the subsidence wetlands have been providing habitats for diverse aquatic organisms and waterbirds (Li et al., 2019a). Because the subsidence wetlands are recognized as unintended artificial wetlands, extensive economic activities occur inside and surrounding the wetlands, including aquaculture and photovoltaic power generation.
2.2
Waterbird surveys
We carried out waterbird surveys in 20 randomly selected subsidence wetlands across the Huainan coal mining area (Fig. 1). To obtain a complete view of present waterbirds in each wetland, one to four counting points were placed along its boundary, depending on its area, shape and visibility. The observation radius at each point was shorter than 1 km and observation areas did not overlap to eliminate double-counting.
Two field surveys were conducted on sunny and windless days in early July and August of 2016 and 2021. During each survey, the same experienced bird observers used binoculars (10 × 42 WB Swarovski) and a telescope (20–60 × zoom Swarovski: ATM 80) to observe waterbirds at the fixed counting points within 20 min. The 'look-see' counting method was employed to record all waterbirds that occurred within the observation areas, including those flushing within the boundaries, while excluding those flying over from outside (Delany, 2005). A community was defined as a combination of all waterbirds recorded within a wetland in a year. Based on the similarity in resources sharing and exploitation ways (Blondel, 2003), the waterbirds were grouped into different guilds: ducks (Anatidae), dividing birds (grebes), vegetation gleaners (jacanas and gallinules), gulls, shorebirds (Charadriidae and Scolopacidae) and large waders (herons and egrets) (Appendix Table S1; nomenclature and residence types follow MacKinnon et al. (2022)).
2.3
Environmental variables
A total of 12 environment variables were measured to analyze their potential influences on the changes in waterbird community structure (Table 1). Among these variables, density of discarded houses, area proportions of floating photovoltaic panels, aquatic vegetation and aquaculture enclosures in each wetland, and the shortest distance from the boundary of each wetland to main settlements (> 50 ha) and roads were determined with the assistance of high-resolution Google Earth maps combined with field investigations. Wetland age was defined as the time (years) since the wetland's creation, determined by detecting their occurrences in a series of Landsat images acquired every month from 1987 to 2021. The remaining variables (area of open water, perimeter of wetland, total area of settlements (> 10 ha) and wetlands (> 1 ha) within a 5-km buffer zone surrounding each wetland) were measured based on the land cover map obtained from an image classification (see below).
Table
1.
The descriptions and temporal changes of the 12 environmental variables in the 20 subsidence wetlands in the Huainan coal mining area.
Variables
Description
Mean ± standard deviation (Range)
Significance of comparisons
2016
2021
AW (km2)
Area of water in each wetland
1.61 ± 1.87 (0.22–8.53)
1.49 ± 1.63 (0.07–7.01)
t = −0.75, P = 0.461
PW (km)
Perimeter of each wetland
5.91 ± 2.86 (2.43–14.38)
7.07 ± 3.26 (2.66–15.59)
t = 5.17, P < 0.001
SI
Shape index of each wetland. SI = L/2√π×A (L = wetland perimeter; A = wetland area)
1.34 ± 0.17 (1.11–1.64)
1.47 ± 0.22 (1.15–1.85)
t = 4.53, P < 0.001
PV (%)
Area proportion of aquatic vegetation in each wetland
23.01 ± 14.05 (5.78–65.75)
19.96 ± 8.60 (7.85–35.55)
t = −0.59, P = 0.258
PP (%)
Area proportion of floating photovoltaic panels in each wetland
0
0.10 ± 0.17 (0–0.46)
t = 2.64, P = 0.016
Age (years)
Years since wetland creation
12.57 ± 6.53 (3.22–24.48)
17.57 ± 6.53 (8.22–29.48)
t = 365.73, P < 0.001
DD (ind./km2)
Density of discarded houses within each wetland
11.09 ± 17.89 (0–69.61)
4.60 ± 5.91 (0–19.69)
t = −1.86, P = 0.078
DS (km)
Shortest distance from the boundary of each wetland to settlement > 50 ha
0.73 ± 0.47 (0.12–1.97)
0.65 ± 0.37 (0.18–1.56)
t = −1.34, P = 0.195
DR (km)
Shortest distance from the boundary of each wetland to the nearest main road
0.22 ± 0.30 (0–1.16)
0.15 ± 0.24 (0–0.82)
t = −1.62, P = 0.122
TS (km2)
Total area of settlements (> 10 ha) within a 5-km buffer zone surrounding each wetland
19.45 ± 5.80 (9.17–19.19)
18.59 ± 5.19 (10.42–29.16)
t = −0.88, P = 0.388
TW (km2)
Total area of wetlands (> 1 ha) within a 5-km buffer zone surrounding each wetland
6.66 ± 2.98 (2.07–12.06)
7.32 ± 2.59 (2.59–12.69)
t = 1.51, P = 0.149
PA (%)
Area proportion of aquaculture enclosures in each wetland
0.01 ± 0.02 (0–0.06)
0.12 ± 0.16 (0–0.49)
t = 3.18, P = 0.005
Variables with significant differences between 2016 and 2021 are highlighted in bold (paired t-test, n = 20).
To obtain land cover maps of the subsidence wetlands and surrounding areas, a cloud-free Landsat 8 image (Level 1T of Landsat 8 OLI on path 122/row 37; http://glovis.usgs.gov) acquired on 1 August 2016 and 31 August 2021 were interpreted. Before image classifications, radiometric calibration and atmospheric correction were performed on the Landsat-8 images, which were then re-projected to the Universal Transverse Mercator Project 1984 coordinate system, zone 50 (north). The Maximum Likelihood Classification technique in ENVI 5.3 (Exelis VIS, Inc.) was used for supervised classification of the images. Six land cover types were identified, i.e., open water, floating photovoltaic panels, aquatic vegetation, developed land, woodland, and farmland. We selected 100 training samples through sub-setting the region of interest for each land cover, and then compared them with 100 samples of known cover (acquired by field surveys and Google Earth maps) to validate the classifications. The overall accuracy and the Kappa coefficients based on the confusion matrix were employed to assess the classification accuracy (Brandt et al., 2013). Both values were greater than 80%, implying high classification accuracy.
2.4
Data analyses
For each surveyed wetland, we pooled the number of bird individuals of the two surveys in 2016 and 2021, respectively, to obtain one species × sites matrix in each year. We calculated dominant values (Y; Eq. (1)) to determine dominant species across the 20 wetlands in 2016 and 2021, respectively (Xu et al., 1995; Sun et al., 2006).
Y=niNi×fi
(Eq. 1)
where ni is the number of individuals of species i, Ni is the total number of waterbird individuals, and fi is the ratio of wetlands with species i in one year.
For each wetland in each year, species richness (SR), Shannon–Wiener diversity index (H; Eq. (2)) and Pielou evenness index (J; Eq. (3)) (Pielou, 1966; Ludwig and Reynolds, 1988) were calculated to measure species diversity of communities.
H=−s∑i=1PilnPi
(Eq. 2)
J=H/lnS
(Eq. 3)
where Pi is the individual number proportion of species i, and S is the total number of individuals of species in one wetland. Paired t-tests were used to examine whether there were differences in diversity indices, environmental variables and number of individuals in each guild between 2016 and 2021. The changes in the number of individuals of a species with more than three records over the five years were tested using paired Wilcoxon signed-ranks tests. The environmental variables with significant changes were z-score standardized prior to further analyses.
Multi-Response Permutation Procedures (MRPP; McCune et al., 2002) were used to test the overall changes in species compositions from 2016 to 2021. The MRPP is a group of distance-based statistical tests, and evaluates the difference between two or more groups of entities. We used the Bray-Curtis distance matrix, calculated using the abundance data, to run the MRPP with 999 permutations. The Non-metric Multi-Dimensional Scaling (NMDS; Kruskal, 1964) ordination was used to visualize compositional changes over the five years. The method is an indirect gradient analysis based on the Bray-Curtis dissimilarity matrix using bird abundance data. Similarity percentage analysis (SIMPER; Clarke, 1993) was used to identify the species that contributed most to the overall changes in community composition.
The data of waterbird and environmental factors in 2016 and 2021 were combined and general linear mixed models (GLMMs) were used to test for effects of environmental variables on species richness, Shannon–Wiener index, Pielou index, total numberof individuals, number of individuals of each guild, and species contributing most to the overall compositional dissimilarity over the five years (determined by SIMPER analysis). The environmental factors with significant changes over the five years (PW, SI, PP, Age and PA) were included as the fixed effects, and the wetland ID as random effect. We tested for multicollinearity between environmental variables using the variance inflation factor (VIF), and all variables were retained in the models because all VIF values were smaller than five (Akinwande et al., 2015).
Temporal pairwise β-diversity (here measured as Sørensen dissimilarity, βsor; Eq. (4)) was calculated and decomposed for each wetland to analyse the underlying ecological processes shaping the changes in species compositions from 2016 to 2021. The calculations were based on the presence/absence data of the waterbird communities, and the decompositions ((Eq. (5) and (6)) followed Baselga (2010). By this means, the relative contribution of species turnover (βsim) and nestedness (βsne) to the temporal compositional changes was determined using β-diversity ratio (βsne/βsor, βratio) (Si et al., 2015).
βsor=b+c2a+b+c
(Eq. 4)
βsim=min(b,c)a+min(b,c)
(Eq. 5)
βsne=βsor−βsim=|b−c|2a+b+c×aa+min(b,c)
(Eq. 6)
where a is the number of species recorded in one wetland in both years, b is the number of species present in 2016 but not in 2021, and c is the number of species in 2021 but not in 2016. The temporal pairwise β-diversity varied from 0 to 1, implying increasing dissimilarity between two years for a certain wetland.
The R (v. 4.1.2; R Core Team, 2020) package vegan was used to perform the MRPP, NMDS, GLMMs, and the calculations and decompositions of the temporal pairwise β-diversities. Data are shown as mean ± standard deviation (SD), and statistical significance level was P < 0.05.
3.
Results
3.1
Temporal changes in environmental variables
The wetland age, wetland perimeter, shape index, and the area proportion of floating photovoltaic panels and aquaculture enclosures of most wetlands increased from 2016 to 2021 (Table 1). There were no differences in other variables between the two years.
3.2
Number of waterbird individuals and species diversity
In total, we recorded 1740 waterbirds of 26 species belonging to 9 families and 5 orders in 2016, and 2951 individuals of 23 species belonging to 10 families and 5 orders in 2021 (Appendix Table S2). The communities in 2016 were dominated by Nycticorax nycticorax, Tachybaptus ruficollis, and Gallinula chloropus, while those in 2021 were dominated by Chlidonias hybrida, Gallinula chloropus, and Egretta garzetta (Table 2). During the surveys, we recorded one species listed as Key Protected Wild Animal Species in China (Class Ⅱ), i.e. Hydrophasianus chirurgus in both years.
Table
2.
Number of individuals per bird species, and species relative contribution, occurrence frequency, and dominance in the waterbird communities across the subsidence wetlands in the Huainan coal mining area in 2016 and 2021.
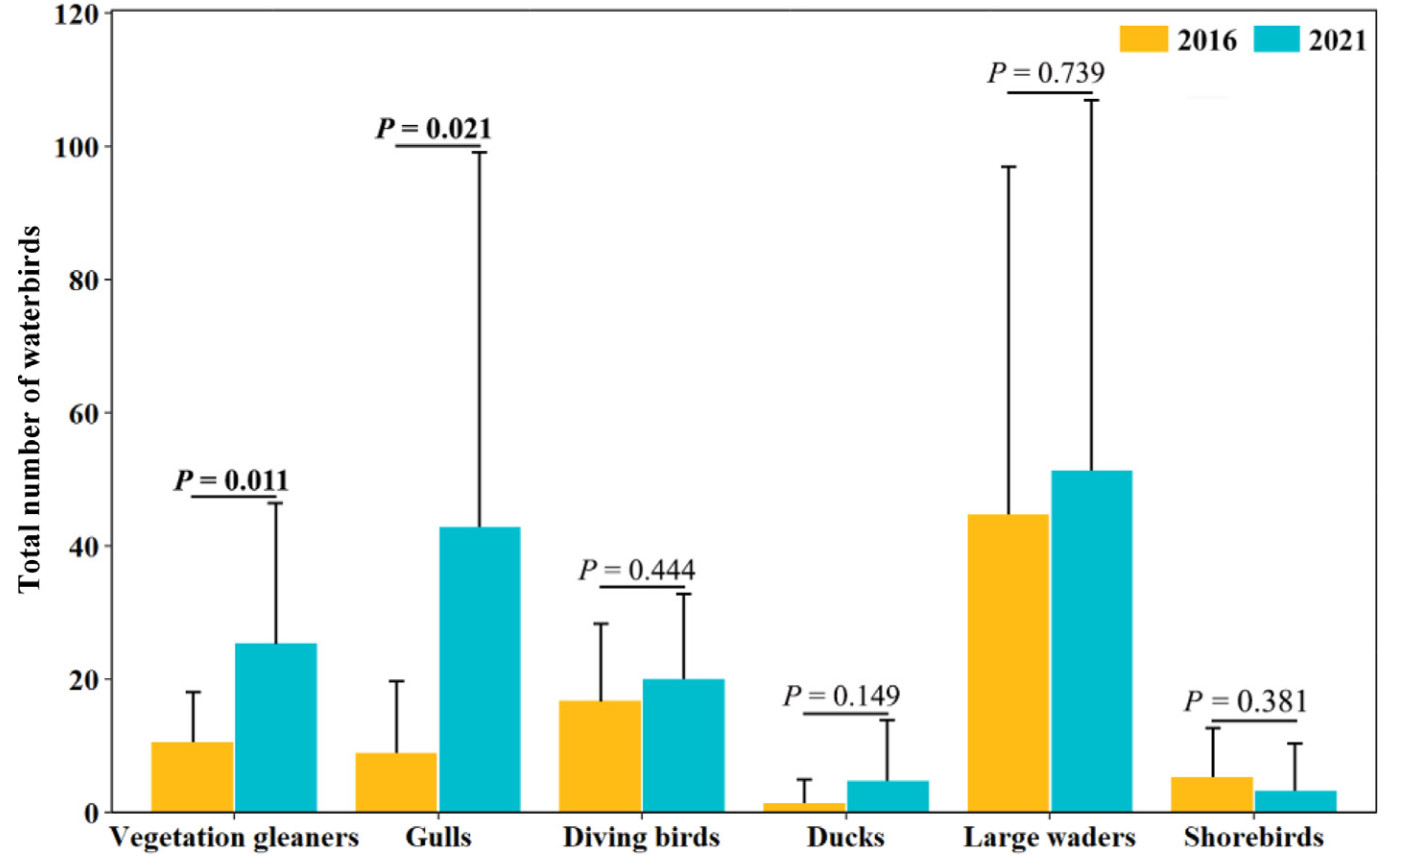
For individual wetlands, the total number of waterbird individuals, species richness and number of vegetation gleaners and gulls increased by 71.7%, 20.1%, 140.1% and 403.5%, respectively, while the number of other guilds, Shannon–Wiener diversity and Pielou evenness did not differ over these five years (Table 3; Fig. 2). The total number of waterbird individuals and the number of vegetation gleaners and gulls in individual wetlands increased with the area proportion of aquaculture, while shorebirds were more abundant in wetlands formed earlier (Table 4). Among the 16 species with more than three records, Egretta garzetta, Gallinula chloropus, Chlidonias hybrida, Fulica atra and Ardea alba increased and Charadrius dubius decreased in numbers over the five years (Appendix Table S3). No environmental factors could explain the variations in species richness, Shannon–Wiener index and Pielou index in individual wetlands.
Table
3.
Species richness, total number of waterbirds and species diversity and evenness of the waterbird communities across subsidence wetlands in Huainan coal mining area in 2016 and 2021.
Mean ± SD (Range)
Significance of comparisons
2016
2021
Species richness
10.0 ± 2.3 (6–15)
11.9 ± 2.4 (6–16)
t = 2.93, P = 0.008
Total number of individuals
87.0 ± 61.9 (10–298)
147.6 ± 82.6 (25–393)
t = 2.38, P = 0.028
Shannon–Wiener diversity
1.86 ± 0.27 (1.04–2.21)
1.87 ± 0.30 (1.21–2.38)
t = 0.21, P = 0.836
Pielou evenness
0.57 ± 0.08 (0.32–0.67)
0.59 ± 0.09 (0.38–0.76)
t = 0.81, P = 0.429
Significant differences between the two years are highlighted in bold (paired t-test, n = 20).
Figure
2.
Total number of waterbird individuals (with error bars showing standard errors) per guild type across subsidence wetlands in the Huainan coal mining area in 2016 and 2021. Significant differences between the two years are displayed with p-values in bold.
Table
4.
Statistical results from GLMMs for the effects of environmental variables on the number of waterbird individuals across the 20 subsidence wetlands in the Huainan coal mining area.
Variables
Coefficient
SE
df
t
P
Total number of individuals
PA
34.99
11.42
15
3.06
0.008
Number of individuals in each guild
Vegetation gleaners
PA
10.54
2.22
15
4.75
< 0.001
Gulls
PA
22.21
6.58
15
3.37
0.004
Shorebirds
Age
2.68
1.26
15
2.14
0.049
Number of individuals of each species with main contributions to the temporal compositional changes
Podiceps ruficollis
PA
2.37
1.03
15
2.30
0.036
Egretta garzetta
PA
5.89
2.63
15
2.24
0.041
Gallinula chloropus
PA
8.78
1.72
15
5.10
< 0.001
PP
4.10
1.81
15
2.26
0.039
Chlidonias hybrida
PA
21.50
6.43
15
3.34
0.005
PA = area proportion of aquaculture enclosures in each wetland; PP = area proportion of floating photovoltaic panels in each wetland; Age = years since wetland creation.
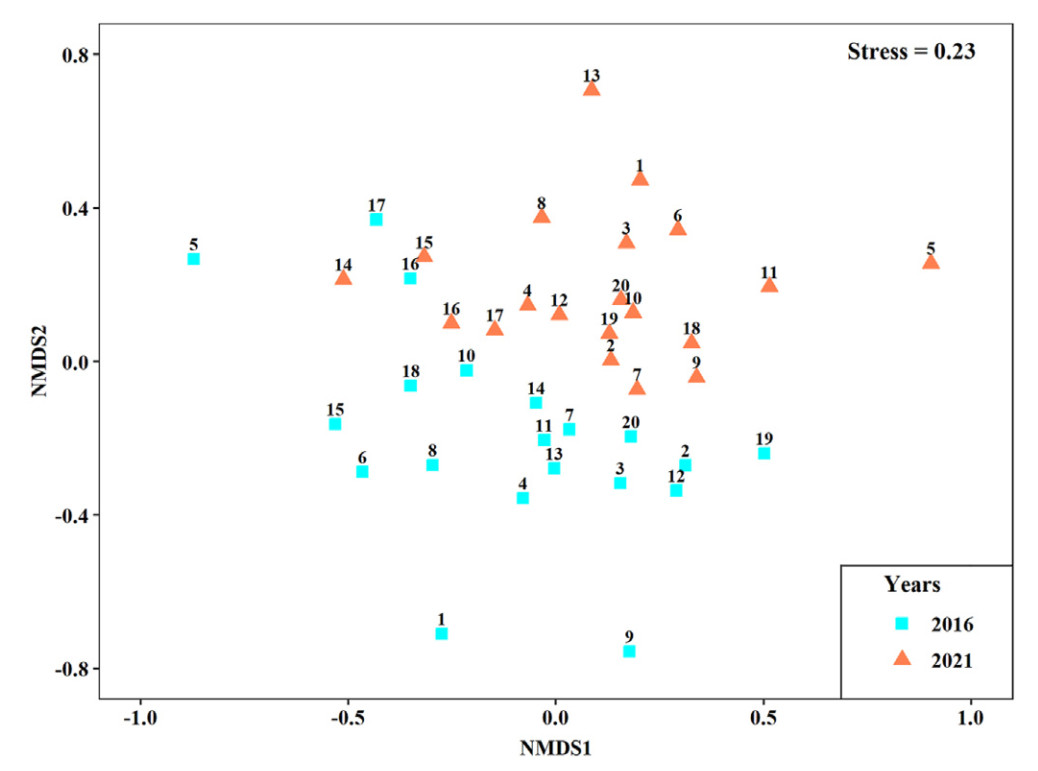
The MRPP indicated an overall temporal shift in species compositions between 2016 and 2021 (A = 0.04, P < 0.001), and the NMDS revealed clear separation between the two years (Fig. 3). The SIMPER analysis indicated that the compositional changes were mainly caused by the changes in the number of individuals of three dominant species, i.e., Chlidonias hybrida, Egretta garzetta and Gallinula chloropus (Table 5). Their numbers were positively correlated with the area proportion of aquaculture in wetlands (Table 4). Gallinula chloropus was also more abundant in wetlands with a larger area proportion of floating photovoltaic panels (Table 4).
Figure
3.
Non-metric Multi-Dimensional Scaling (NMDS) ordination of the waterbird communities across the subsidence wetlands in the Huainan coal mining area in 2016 and 2021. The wetland IDs are displayed along with the symbols.
Table
5.
The species (determined by the SIMPER analysis) contributing most to the overall compositional changes in the waterbird communities across the subsidence wetlands in the Huainan coal mining area from 2016 to 2021.
Species
Number of bird individuals (Mean ± SD)
Contribution (%)
Cumulative
Significance of changes in numbers
2016
2021
(%)
Chlidonias hybrida
8.3 ± 10.4
40.5 ± 55.4
20.7
20.7
V = 204.0, P < 0.001
Egretta garzetta
7.2 ± 11.8
19.5 ± 21.4
12.4
33.1
V = 185.0, P = 0.003
Nycticorax nycticorax
21.3 ± 47.5
8.2 ± 16.4
12.3
45.4
V = 43.5, P = 0.123
Gallinula chloropus
9.0 ± 5.4
21.9 ± 16.8
10.8
56.2
V = 180.5, P = 0.005
Tachybaptus ruficollis
11.5 ± 5.6
14.5 ± 7.9
6.4
62.6
V = 111.5, P = 0.267
Podiceps cristatus
5.3 ± 7.2
5.5 ± 8.7
5.6
68.2
V = 71.0, P = 0.897
Bubulcus ibis
5.2 ± 12.9
6.1 ± 12.4
5.5
73.7
V = 41.5, P = 0.476
Significant differences of individual number over the five years are highlighted in bold (paired Wilcoxon signed-ranks test, n = 20).
3.4
Temporal pairwise β-diversity and compositions
The temporal pairwise β-diversities ranged from 0.19 to 0.67 with a mean value of 0.34 ± 0.12. On average, the turnover component (0.23 ± 0.15) was higher than the nestedness (0.11 ± 0.08) component. The β-diversity ratio (βsne/βsor) was 0.35 ± 0.28, indicating that the temporal compositional changes for most wetlands from 2016 to 2021 were primarily driven by species turnover.
4.
Discussion
We recorded abundant waterbirds belonging to a variety of species across the subsidence wetlands in Huainan coal mining area in 2016 and 2021, indicating that these subsidence wetlands provide important habitats for large numbers of waterbird species during breeding season. The study provides further evidence for the importance of subsidence wetlands in providing compensatory habitats for a variety of waterbird species (Li et al., 2019a). The subsidence wetlands in the North China Plain are still expanding due to continuing underground coal excavation (Liu et al., 2021). It was estimated that the total area of subsidence wetlands could ultimately reach 2 × 10⁶ ha (Hu et al., 2014). In the light of the continuous loss of natural wetlands, these man-made wetlands are expected to attract more waterbirds to forage, rest or nest, and therefore should be given full attention.
We found that, for most wetlands, the number of waterbird individuals increased from 2016 to 2021, and the increase was mainly caused by an increase in vegetation gleaners and gulls. The species (e.g., Gallinula chloropus and Chlidonias hybrida) in these two guilds have high reproductive capacity and are well-adapted to anthropogenic disturbances in human-dominated environments (Quan et al., 2002). Their numbers were positively associated with the area proportion of aquaculture enclosures in wetlands. This could be explained by the rich food resources around these aquacultural activities and habitat fragmentation associated with aquaculture (Ma et al., 2010). We also found that species richness in most wetlands increased during the study period but we failed to detect any effects of the environmental variables thereon. The increasing familiarity of waterbirds to these wetlands at a larger scale, more suitable microhabitats for breeding and other unmeasured environmental factors might be possible reasons, which deserve further investigations (Li et al., 2019a). In contrast to our expectations, the Shannon–Wiener diversity and Pielou evenness did not change significantly over these five years. Although we observed a large number of waterbird species, the total number of birds was dominated by only a few species, such as Chlidonias hybrida and Gallinula chloropus. This resulted in relatively low values of diversity indices (Kunte, 2008), and these relatively small changes in diversity indices might therefore not be detected during the study period. Like other artificial wetlands, such as aquaculture ponds and paddy fields, habitat homogenization and extensive anthropogenic disturbances across subsidence wetlands may lead to a reduction in niche spaces, and a subsequent decline in waterbird species diversity (Węsławski et al., 2011; Xu et al., 2020). This may highlight that, to protect diverse waterbirds in artificial wetlands, much efforts should be made to increase habitat diversity and reduce human disturbances.
The results of MRPP indicated that the overall community composition changed from 2016 to 2021, which was mainly exhibited in changes in the number of individuals of several species (Appendix Table S3). Among these species, the numbers of three dominant species, Chlidonias hybrida, Egretta garzetta and Gallinula chloropus, increased during the study period, and were associated with the expansion of aquaculture area in the subsidence wetlands. In addition to abundant food resources as mentioned above, aquaculture cages may provide appropriate perches for these birds to rest, thus, attracting more birds with an increase in aquacultural activities (Ma et al., 2004). Additionally, the increase in Gallinula chloropus was also positively related to the installation of floating photovoltaic panels. This species can tolerate high levels of anthropogenic disturbances created by the photovoltaic power generation system (Li et al., 2019a), and may find appropriate refuges between and under the panels (Sahu et al., 2016). The individual increases of the three species and their positive correlations with the aquaculture and floating photovoltaic panels imply that these two kinds of human activities might be attributed for the community homogenization mentioned above. Although the number of Nycticorax nycticorax did not change over the five years, its contribution to the temporal compositional changes was also high. This might be related to its changes in spatial distribution among wetlands. Almost half individuals of this species were recorded in one wetland in 2016, but the number was more evenly spread over wetlands in 2021.
As predicted, compared with the nestedness component, the turnover contributed more to the temporal pairwise β-diversity of the waterbird communities across subsidence wetlands. It has been found that turnover is the dominant component of β-diversity in a variety of taxa and ecosystems, highlighting the importance of environment conditions and the species' dispersal capacity in shaping β-diversity (Gianuca et al., 2017; Soininen et al., 2017; Wu et al., 2017). A previous study also found that the spatial variation in waterbird community structure during the migration and wintering seasons across subsidence wetlands was dominated by species turnover (Li et al., 2019c, 2021a,b). In shaping the temporal changes in species composition, the correlation with the turnover component suggests that certain species are replaced by others over time (Baselga, 2010; Baselga et al., 2015). A possible reason for the importance of species turnover in shaping temporal pairwise β-diversity could be associated with temporal changes in the surrounding environment and quick responses of certain waterbird species to these changes (Baselga, 2010; Henry and Cumming, 2017). The subsidence wetlands were surrounded by human-dominated landscape with dramatic environmental changes due to extensive anthropogenic activities (Li et al., 2019a). A variety of waterbird species with strong movement abilities, such as gulls, herons and egrets, might be attracted to these subsidence wetlands (Fandos et al., 2020; Lorenzón et al., 2020). However, many of them may not adapt well to local environmental changes over time and leave wetlands (Wang et al., 2018). Therefore, for most wetlands, the waterbird species were replaced over a short period. It is worth to point out that, the importance of temporal turnover, together with the spatial turnover (Li et al., 2019c, 2021a,b), suggest that all subsidence wetlands, rather than only big ones, have potential conservation values because of their relative high contributions to regional diversity (Si et al., 2015).
Previous studies found that environmental changes have multifaceted effects on waterbird communities in artificial wetlands (Mundava et al., 2012; Blandón et al., 2016; Zhou et al., 2020). Various environmental factors might act as filters selecting species that can adapt to local environments and coexist in a community (Li et al., 2019b, 2021a,b). The temporal changes in environmental conditions can also drive temporal changes in community structures. The effects of these environmental changes may not be only reflected in the taxonomic dimensions of the communities, but also on its functional and phylogenetic facets, which might exhibit different patterns and deserve further studies (Li et al., 2019b; Zeng et al., 2019). Furthermore, apart from the environmental variables measured in this study, the temporal changes in waterbird communities across the subsidence wetlands in the North China Plain may also be associated with other factors. For example, the effects of larger scale population trends, species' phenological characteristics, and stochastic processes should be considered in further studies based on long-term monitoring of waterbird communities and environments (Baselga et al., 2015; Li et al., 2019a).
5.
Conclusions
We recorded a large number of waterbirds across subsidence wetlands in the North China Plain in 2016 and 2021, supporting the key role of these artificial wetlands in providing important compensatory habitats for waterbird species in the context of loss and degradation of natural wetlands. From 2016 to 2021, the number of waterbird individuals and species richness increased in most wetlands, and this increase in bird number was mainly due to an increase in vegetation gleaners and gulls. However, the Shannon–Wiener diversity and Pielou evenness did not differ over the five years, which might be explained by the extreme numbers of a few dominant species. The species composition in most wetlands changed during the study period, and the temporal pairwise β-diversity was mainly driven by species turnover rather than nestedness. To appropriately protect the waterbird assemblages in these artificial wetlands, long-term monitoring on waterbirds and habitat variables should be carried out to capture their spatial-temporal dynamics. Furthermore, these wetlands should be an integral part of biodiversity conservation, and we encourage enhancing habitat diversity and reducing human disturbances in the framework of wise management of the wetlands.
Authors' contributions
All authors contributed to the study conception and design. CL conceived the study. GW, JZ, WL and XS collected the data. GW and CL performed the analyses. GW wrote the first draft of the paper. CL, WFdB and YZ revised the manuscript. All authors read and approved the final manuscript.
Data availability
The datasets generated during and/or analysed during the current study are available from the corresponding author on reasonable request.
Declaration of competing interest
The authors declare that they have no known competing financial interests or personal relationships that could have appeared to influence the work reported in this paper.
Akinwande, M.O., Dikko, H.G., Samson, A., 2015. Variance inflation factor: as a condition for the inclusion of suppressor variable(s) in regression analysis. Open J. Stat. 5, 754–767. .
Baselga, A., 2010. Partitioning the turnover and nestedness components of beta diversity. Global Ecol. Biogeogr. 19, 134–143. .
Baselga, A., Bonthoux, S., Balent, G., 2015. Temporal beta diversity of bird assemblages in agricultural landscapes: land cover change vs. stochastic processes. PLoS One 10, e0127913. .
Bielańska-Grajner, I., GŁadysz, A., 2010. Planktonic rotifers in mining lakes in the Silesian Upland: relationship to environmental parameters. Limnologica 40, 67–72. .
Blandón, A.C., Perelman, S.B., Ramírez, M., López, A., Javier, O., Robbins, C.S., 2016. Temporal bird community dynamics are strongly affected by landscape fragmentation in a Central American tropical forest region. Biodivers. Conserv. 25, 311–330. .
Blondel, J., 2003. Guilds or functional groups: does it matter? Oikos 100, 223–231. .
Brandt, J.S., Haynes, M.A., Kuemmerle, T., Waller, D.M., Radeloff, V.C., 2013. Regime shift on the roof of the world: alpine meadows converting to shrublands in the southern Himalayas. Biol. Conserv. 158, 116–127. .
Château, P.A., Wunderlich, R.F., Wang, T.W., Lai, H.T., Chen, C.C., Chang, F.J., 2019. Mathematical modelling suggests high potential for the deployment of floating photovoltaic on fish ponds. Sci. Total Environ. 687, 654–666. .
Cintra, R., 2019. Waterbird community composition in relation to lake physical traits and wetland limnological conditions in the Amazon basin. Hydrobiologia 826, 43–65. .
Clarke, K.R., 1993. Non-parametric multivariate analyses of changes in community structure. Aust. J. Ecol. 18, 117–143. .
Davidson, N.C., 2014. How much wetland has the world lost? Long-term and recent trends in global wetland area. Mar. Freshw. Res. 65, 934–941. .
Delany, S., 2005. Guidelines for Participants in the International Waterbird Census (IWC). Wetlands International, Wageningen.
Fandos, G., Rotics, S., Sapir, N., Fiedler, W., Kaatz, M., Wikelski, M., et al., 2020. Seasonal niche tracking of climate emerges at the population level in a migratory bird. Proc. R. Soc. B 287, 20201799. .
Gianuca, A.T., Declerck, S.A.J., Lemmens, P., de Meester, L., 2017. Effects of dispersal and environmental heterogeneity on the replacement and nestedness components of beta-diversity. Ecology 98, 525–533. .
Giosa, E., Mammides, C., Zotos, S., 2018. The importance of artificial wetlands for birds: a case study from Cyprus. PLoS One 13, e0197286. .
Henry, D.A., Cumming, G.S., 2017. Can waterbirds with different movement, dietary and foraging functional traits occupy similar ecological niches? Landsc. Ecol. 32, 265–278. .
Hu, B., Guo, W., 2018. Mining subsidence area status, syntheses governance model and governance recommendation. Coal Mining Technol. 23, 1–4 (in Chinese).
Hu, Z., Xiao, W., Fu, Y., 2014. Introduction to concurrent mining and reclamation for coal mines in China. In: Drebenstedt, C., Singhal, R. (Eds.), Mine Planning and Equipment Selection: Proceedings of the 22nd MPES Conference, Dresden, Germany, 14th–19th October 2013. Springer, Cham, pp. 781–789.
Jackson, M.V., Choi, C.Y., Amano, T., Estrella, S.M., Lei, W., Moores, N., et al., 2020. Navigating coasts of concrete: pervasive use of artificial habitats by shorebirds in the Asia-Pacific. Biol. Conserv. 247, 108591. .
Kloskowski, J., Green, A.J., Polak, M., Bustamante, J., Krogulec, J., 2009. Complementary use of natural and artificial wetlands by waterbirds wintering in Doñana, south-west Spain. Aquat. Conserv. 19, 815–826. .
Kunte, K., 2008. Competition and species diversity: removal of dominant species increases diversity in Costa Rican butterfly communities. Oikos 117, 69–76. .
Lantz, S.M., Gawlik, D.E., Cook, M.I., 2011. The effects of water depth and emergent vegetation on foraging success and habitat selection of wading birds in the Everglades. Waterbirds 34, 439–447. .
Lewin, I., Spyra, A., Krodkiewska, M., Strzelec, M., 2015. The importance of the mining subsidence reservoirs located along the trans-regional highway in the conservation of the biodiversity of freshwater molluscs in industrial areas (Upper Silesia, Poland). Water Air Soil Pollut. 226, 1–12. .
Li, C., Yang, S., Zha, D., Zhang, Y., de Boer, W.F., 2019a. Waterbird communities in subsidence wetlands created by underground coal mining in China: effects of multi-scale environmental and anthropogenic variables. Environ. Conserv. 46, 67–75. .
Li, C., Zhang, Y., Zha, D., Yang, S., Huang, Z.Y., de Boer, W.F., 2019b. Assembly processes of waterbird communities across subsidence wetlands in China: a functional and phylogenetic approach. Divers. Distrib. 25, 1118–1129. .
Li, C., Zhao, B., Wang, Y., 2019c. Nestedness of waterbird assemblages in the subsidence wetlands recently created by underground coal mining. Curr. Zool. 65, 155–163. .
Li, X., Anderson, C.J., Wang, Y., Lei, G., 2021b. Waterbird diversity and abundance in response to variations in climate in the Liaohe Estuary, China. Ecol. Indicat. 132, 108286. .
Liu, H., Zhang, M., Su, L., Chen, X., Liu, C., Sun, A., 2021. A boundary model of terrain reconstruction in a coal-mining subsidence waterlogged area. Environ. Earth Sci. 80, 1–15. .
Lorenzón, R.E., Ronchi-Virgolini, A.L., Blake, J.G., 2020. Wetland dependency drives temporal turnover of bird species between high- and low-water years in floodplain wetlands of the Paraná River. Ecohydrology 13, e2179. .
Ludwig, J.A., Reynolds, J.F., 1988. Statistical Ecology: A Primer in Methods and Computing. John Wiley and Sons, New York.
Ma, Z., Li, B., Zhao, B., Jing, K., Tang, S., Chen, J., 2004. Are artificial wetlands good alternatives to natural wetlands for waterbirds? – a case study on Chongming island, China. Biodivers. Conserv. 13, 333–350. .
Ma, Z., Cai, Y., Li, B., Chen, J., 2010. Managing wetland habitats for waterbirds: an international perspective. Wetlands 30, 15–27. .
MacKinnon, J., Phillipps, K., Nong, Y., Hua, L., Yao, X., Zhi, G., et al., 2022. Guide to the Birds of China. Oxford University Press, Oxford.
Mundava, J., Caron, A., Gaidet, N., Couto, F.M., Couto, J.T., de Garine-Wichatitsky, M., et al., 2012. Factors influencing long-term and seasonal waterbird abundance and composition at two adjacent lakes in Zimbabwe. Ostrich 83, 69–77. .
Ouyang, Z., Gao, L., Yang, C., 2018. Distribution, sources and influence factors of polycyclic aromatic hydrocarbon at different depths of the soil and sediments of two typical coal mining subsidence areas in Huainan, China. Ecotoxicol. Environ. Saf. 163, 255–265. .
Pielou, E.C., 1966. The measurement of diversity in different types of biological collections. J. Theor. Biol. 13, 131–144. https://doi.org/10.1016/0022-5193(66) 90013-0.
Quan, R., Wen, X., Yang, X., 2002. Effects of human activities on migratory waterbirds at Lashihai Lake, China. Biol. Conserv. 108, 273–279. .
R Core Team, 2020. R: a Language and Environment for Statistical Computing. R Foundation for Statistical Computing, Vienna. . (Accessed 11 May 2020).
Rajpar, M.N., Ahmad, S., Zakaria, M., Ahmad, A., Guo, X., Nabi, G., et al., 2022. Artificial wetlands as alternative habitat for a wide range of waterbird species. Ecol. Indicat. 138, 108855. .
Sahu, A., Yadav, N., Sudhakar, K., 2016. Floating photovoltaic power plant: a review. Renew. Sustain. Energy Rev. 66, 815–824. .
Si, X., Baselga, A., Ding, P., 2015. Revealing beta-diversity patterns of breeding bird and lizard communities on inundated land-bridge islands by separating the turnover and nestedness components. PLoS One 10, e0127692. .
Soininen, J., Heino, J., Wang, J., 2017. A meta-analysis of nestedness and turnover components of beta diversity across organisms and ecosystems. Global Ecol. Biogeogr. 27, 96–109. .
Sun, C., Wang, Y., Sun, S., Zhang, F., 2006. Analysis dynamics of phytoplankton community characteristics in Daya Bay. Acta Ecol. Sin. 26, 3948–3958 (in Chinese).
Tavares, D.C., Guadagnin, D.L., de Moura, J.F., Siciliano, S., Merico, A., 2015. Environmental and anthropogenic factors structuring waterbird habitats of tropical coastal lagoons: implications for management. Biol. Conserv. 186, 12–21. .
Tourenq, C., Bennetts, R.E., Kowalski, H., Vialet, E., Lucchesi, J.L., Kayser, Y., et al., 2001. Are ricefields a good alternative to natural marshes for waterbird communities in the Camargue, southern France? Biol. Conserv. 100, 335–343. .
Wang, H., Shi, R., Lu, C., Jiang, Y., Deng, D., Zhang, D., 2019. Investigation of sudden faults instability induced by coal mining. Saf. Sci. 115, 256–264. .
Wang, X., Kuang, F., Tan, K., Ma, Z., 2018. Population trends, threats, and conservation recommendations for waterbirds in China. Avian Res. 9, 14. .
Wang, X., Li, X., Ren, X., Jackson, M.V., Fuller, R.A., Melville, D.S., et al., 2022. Effects of anthropogenic landscapes on population maintenance of waterbirds. Conserv. Biol. 36, e13808. .
Węsławski, J.M., Kendall, M.A., Włodarska-Kowalczuk, M., Iken, K., Kędra, M., Legezynska, J., et al., 2011. Climate change effects on Arctic fjord and coastal macrobenthic diversity – observations and predictions. Mar. Biodivers. 41, 71–85. .
Wu, L., Si, X., Didham, R.K., Ge, D., Ding, P., 2017. Dispersal modality determines the relative partitioning of beta diversity in spider assemblages on subtropical land-bridge islands. J. Biogeogr. 44, 2121–2131. .
Xu, P., Zhang, X., Zhang, F., Bempah, G., Lu, C., Lv, S., et al., 2020. Use of aquaculture ponds by globally endangered red-crowned crane (Grus japonensis) during the wintering period in the Yancheng national nature reserve, a ramsar wetland. Glob. Ecol. Conserv. 23, e01123. .
Xu, Z., Wang, Y., Chen, Y., Shen, H., 1995. An ecological study on zooplankton in maximum turbid zone of estuarine area of Changjiang (Yangtze) River. J. Fish. Sci. China 2, 39–48 (in Chinese).
Zeng, Q., Reid, J., Saintilan, N., Colloff, M.J., Lei, G., Wen, L., 2019. Contrasting diversity patterns of breeding anatidae in the Northern and Southern Hemispheres. Ecol. Evol. 9, 9990–10003. .
Zhang, G., Yuan, X., Wang, K., 2019. Biodiversity and temporal patterns of macrozoobenthos in a coal mining subsidence area in North China. PeerJ 7, e6456. .
Zhou, J., Zhou, L., Xu, W., 2020. Diversity of wintering waterbirds enhanced by restoring aquatic vegetation at Shengjin Lake, China. Sci. Total Environ. 737, 140190. .
Table
2.
Number of individuals per bird species, and species relative contribution, occurrence frequency, and dominance in the waterbird communities across the subsidence wetlands in the Huainan coal mining area in 2016 and 2021.
Table
3.
Species richness, total number of waterbirds and species diversity and evenness of the waterbird communities across subsidence wetlands in Huainan coal mining area in 2016 and 2021.
Mean ± SD (Range)
Significance of comparisons
2016
2021
Species richness
10.0 ± 2.3 (6–15)
11.9 ± 2.4 (6–16)
t = 2.93, P = 0.008
Total number of individuals
87.0 ± 61.9 (10–298)
147.6 ± 82.6 (25–393)
t = 2.38, P = 0.028
Shannon–Wiener diversity
1.86 ± 0.27 (1.04–2.21)
1.87 ± 0.30 (1.21–2.38)
t = 0.21, P = 0.836
Pielou evenness
0.57 ± 0.08 (0.32–0.67)
0.59 ± 0.09 (0.38–0.76)
t = 0.81, P = 0.429
Significant differences between the two years are highlighted in bold (paired t-test, n = 20).
Table
4.
Statistical results from GLMMs for the effects of environmental variables on the number of waterbird individuals across the 20 subsidence wetlands in the Huainan coal mining area.
Variables
Coefficient
SE
df
t
P
Total number of individuals
PA
34.99
11.42
15
3.06
0.008
Number of individuals in each guild
Vegetation gleaners
PA
10.54
2.22
15
4.75
< 0.001
Gulls
PA
22.21
6.58
15
3.37
0.004
Shorebirds
Age
2.68
1.26
15
2.14
0.049
Number of individuals of each species with main contributions to the temporal compositional changes
Podiceps ruficollis
PA
2.37
1.03
15
2.30
0.036
Egretta garzetta
PA
5.89
2.63
15
2.24
0.041
Gallinula chloropus
PA
8.78
1.72
15
5.10
< 0.001
PP
4.10
1.81
15
2.26
0.039
Chlidonias hybrida
PA
21.50
6.43
15
3.34
0.005
PA = area proportion of aquaculture enclosures in each wetland; PP = area proportion of floating photovoltaic panels in each wetland; Age = years since wetland creation.
Table
5.
The species (determined by the SIMPER analysis) contributing most to the overall compositional changes in the waterbird communities across the subsidence wetlands in the Huainan coal mining area from 2016 to 2021.
Species
Number of bird individuals (Mean ± SD)
Contribution (%)
Cumulative
Significance of changes in numbers
2016
2021
(%)
Chlidonias hybrida
8.3 ± 10.4
40.5 ± 55.4
20.7
20.7
V = 204.0, P < 0.001
Egretta garzetta
7.2 ± 11.8
19.5 ± 21.4
12.4
33.1
V = 185.0, P = 0.003
Nycticorax nycticorax
21.3 ± 47.5
8.2 ± 16.4
12.3
45.4
V = 43.5, P = 0.123
Gallinula chloropus
9.0 ± 5.4
21.9 ± 16.8
10.8
56.2
V = 180.5, P = 0.005
Tachybaptus ruficollis
11.5 ± 5.6
14.5 ± 7.9
6.4
62.6
V = 111.5, P = 0.267
Podiceps cristatus
5.3 ± 7.2
5.5 ± 8.7
5.6
68.2
V = 71.0, P = 0.897
Bubulcus ibis
5.2 ± 12.9
6.1 ± 12.4
5.5
73.7
V = 41.5, P = 0.476
Significant differences of individual number over the five years are highlighted in bold (paired Wilcoxon signed-ranks test, n = 20).

 DownLoad:


 Email Alerts
 RSS Feeds